***Last / Change / Volume quote data in this table corresponds with the timestamp on the note***
Symbol/Exchange
Company Name
Industry Group |
Last |
Chg. |
Vol
% DAV |
Date Featured |
Price Featured |
Latest Pivot Point
Featured |
Status |
| Latest Max Buy Price |
AMZN
- NASDAQ
Amazon.com Inc
INTERNET - Internet Software & Services
|
$147.11
|
+3.48
|
9,238,358
128% DAV
7,211,800
|
4/23/2010
(Date
Featured) |
$144.41
(Price
Featured) |
PP = $146.01 |
Y |
| MB = $153.31 |
Most Recent Note - 4/26/2010 4:09:32 PM
Y - Posted a gain today with above average volume as it rebounded back for a close above its pivot point. The confirming gains were reassuring to see. In recent weeks it rose from a 4-month cup shaped pattern to new multi-year highs, and AMZN was featured in the 4/23/10 mid-day report (read here) while encountering distributional pressure following strong results for the March 31, 2010 quarter. Technically, it had risen above the pivot point cited (based on its 12/03/09 high plus .10) with twice average volume behind its 4/22/10 gain. Subsequent losses undercutting its old high closes would raise concerns. Recent quarterly comparisons show sales revenues acceleration with 3 consecutive quarterly earnings per share increases in the +60% range, along with a solid annual earning history - satisfying the C and A criteria.
>>> The latest Featured Stock Update with an annotated graph appeared on 4/23/2010. click here.
|
|
C
A
S
I |
News |
Chart |
SEC
View all notes Alert
me of new notes
Company
Profile
|
ARUN
- NASDAQ
Aruba Networks Inc
COMPUTER HARDWARE - Networking & Communication Dev
|
$13.57
|
+0.17
|
1,565,023
97% DAV
1,612,100
|
2/19/2010
(Date
Featured) |
$12.71
(Price
Featured) |
PP = $11.94 |
G |
| MB = $12.54 |
Most Recent Note - 4/26/2010 4:13:45 PM
G - Gapped up today for a small gain on higher volume near average. It found prompt support last week near its 50 DMA line and above its recent chart low ($12.21 on 3/19/10).
>>> The latest Featured Stock Update with an annotated graph appeared on 3/31/2010. click here.
|
|
C
A
S
I |
News |
Chart |
SEC
View all notes Alert
me of new notes
Company
Profile
|
BIDU
- NASDAQ
Baidu Inc Ads
INTERNET - Internet Information Providers
|
$640.85
|
-4.91
|
898,233
56% DAV
1,609,100
|
1/13/2010
(Date
Featured) |
$431.25
(Price
Featured) |
PP = $426.75 |
G |
| MB = $448.09 |
Most Recent Note - 4/26/2010 4:15:26 PM
G - Holding its ground near all-time highs, it wedged higher for 12 consecutive weekly gains. BIDU is extended from any sound base, yet repeatedly noted it - "could produce more climactic gains, especially due to the small supply (S criteria) of shares outstanding. Earnings news is due on Wednesday, 4/28/10."
>>> The latest Featured Stock Update with an annotated graph appeared on 4/20/2010. click here.
|
|
C
A
S
I |
News |
Chart |
SEC
View all notes Alert
me of new notes
Company
Profile
|
BPI
- NYSE
Bridgepoint Education
DIVERSIFIED SERVICES - Education &; Training Services
|
$25.98
|
+0.97
|
460,932
108% DAV
425,700
|
4/13/2010
(Date
Featured) |
$25.59
(Price
Featured) |
PP = $25.76 |
Y |
| MB = $27.05 |
Most Recent Note - 4/26/2010 4:18:42 PM
Y- Gapped up and posted a solid gain today while concurrent weakness in Devry Inc (DV -5.77%) and Corinthian Colleges Inc. (COCO -3.47%) was said to be based on fears that for-profit schools could be hurt by proposed regulatory changes. The Commercial Services - Schools firm was featured in yellow in the 4/13/10 mid-day report (read here) as rose from a cup-with-high-handle.
>>> The latest Featured Stock Update with an annotated graph appeared on 4/13/2010. click here.
|
|
C
A
S
I |
News |
Chart |
SEC
View all notes Alert
me of new notes
Company
Profile
|
BRLI
- NASDAQ
Bio Reference Labs Inc
HEALTH SERVICES - Medical Laboratories & Researc
|
$23.63
|
-0.48
|
213,088
108% DAV
198,200
|
2/12/2010
(Date
Featured) |
$39.02
(Price
Featured) |
PP = $20.49 |
G |
| MB = $21.51 |
Most Recent Note - 4/26/2010 4:27:49 PM
G - Pulled back on average volume today for a second small loss, closing the session only +2.9% above its 3/12/10 high. The current consolidation leaves it not extended greatly from nearby support at its 50 DMA line even after its recent streak of 12 consecutive small gains. Do not be confused by 2:1 stock split impacting share prices as of 4/22/10 (PP and MB prices associated with the latest 2/12/10 Featured Date have been adjusted accordingly).
>>> The latest Featured Stock Update with an annotated graph appeared on 4/16/2010. click here.
|
|
C
A
S
I |
News |
Chart |
SEC
View all notes Alert
me of new notes
Company
Profile
|
CISG
- NASDAQ
Cninsure Inc Ads
INSURANCE - Insurance Brokers
|
$26.41
|
-0.16
|
112,540
44% DAV
255,400
|
3/3/2010
(Date
Featured) |
$24.38
(Price
Featured) |
PP = $23.10 |
G |
| MB = $24.26 |
Most Recent Note - 4/26/2010 4:30:21 PM
G - Consolidating following a big loss on 4/16/10, staying above its 50 DMA line ($25.32 now) and recent low ($24.77 on 4/19/10) which define important support. CISG traded up as much as +17.4% since featured in yellow in the 3/03/10 mid-day report (read here).
>>> The latest Featured Stock Update with an annotated graph appeared on 4/19/2010. click here.
|
|
C
A
S
I |
News |
Chart |
SEC
View all notes Alert
me of new notes
Company
Profile
|
CRM
- NYSE
Salesforce.com Inc
INTERNET - Internet Software & Services
|
$88.49
|
+0.33
|
969,049
55% DAV
1,748,700
|
3/5/2010
(Date
Featured) |
$72.28
(Price
Featured) |
PP = $75.53 |
G |
| MB = $79.31 |
Most Recent Note - 4/26/2010 4:31:36 PM
G - Holding its ground at its all-time high, extended from prior chart highs and well above its "max buy" level. Patience may allow disciplined investors to accumulate shares without chasing it too far from a sound base.
>>> The latest Featured Stock Update with an annotated graph appeared on 4/21/2010. click here.
|
|
C
A
S
I |
News |
Chart |
SEC
View all notes Alert
me of new notes
Company
Profile
|
CTRP
- NASDAQ
Ctrip.com Intl Ltd Adr
LEISURE - Resorts & Casinos
|
$39.44
|
+0.96
|
1,744,571
87% DAV
1,994,000
|
3/25/2010
(Date
Featured) |
$40.74
(Price
Featured) |
PP = $39.40 |
Y |
| MB = $41.37 |
Most Recent Note - 4/26/2010 4:45:29 PM
Y - Its color code is changed to yellow as it repaired a recent 50 DMA violation and today's gain helped it rally back above its old pivot point, showing encouraging signs of support. In recent months it has encountered stubborn resistance in the $40 area, so confirming gains with heavy volume for new highs would be a welcome reassurance shares are being accumulated. Distributional pressure has been noted since the 3/25/10 Stock Bulletin was published (read here).
>>> The latest Featured Stock Update with an annotated graph appeared on 4/12/2010. click here.
|
|
C
A
S
I |
News |
Chart |
SEC
View all notes Alert
me of new notes
Company
Profile
|
EZPW
- NASDAQ
Ezcorp Inc Cl A
SPECIALTY RETAIL - Specialty Retail, Other
|
$23.34
|
+0.03
|
379,557
74% DAV
514,100
|
4/14/2010
(Date
Featured) |
$21.80
(Price
Featured) |
PP = $22.29 |
Y |
| MB = $23.40 |
Most Recent Note - 4/26/2010 4:48:56 PM
Y - Small gain for a new high close today with lighter volume, approaching its "max buy" level. A considerable gain on 4/20/10 with +67% above average volume as it rallied above the pivot point triggered a technical buy signal. Rose from a 5-week flat base with no overhead supply to act as resistance for this high-ranked Finance - Consumer/Commercial Loans firm.
>>> The latest Featured Stock Update with an annotated graph appeared on 3/29/2010. click here.
|
|
C
A
S
I |
News |
Chart |
SEC
View all notes Alert
me of new notes
Company
Profile
|
GMCR
- NASDAQ
Green Mtn Coffee Roastrs
FOOD & BEVERAGE - Processed & Packaged Goods
|
$86.96
|
-0.34
|
740,924
N/A
|
2/26/2010
(Date
Featured) |
$84.39
(Price
Featured) |
PP = $88.75 |
|
| MB = $93.19 |
Most Recent Note - 4/26/2010
Small loss today on light volume. It will be dropped from the Featured Stocks list tonight. It triggered damaging technical sell signals last week and would have to rebound above its 50-day moving average (DMA) line for its outlook to improve. Earnings news is due on 4/28/10. The number of top-rated funds owning its shares fell from 114 in Dec '09 to 108 in Mar '10. GMCR rallied more than 5-fold from its November '08 low.
>>> The latest Featured Stock Update with an annotated graph appeared on 4/5/2010. click here.
|
|
C
A
S
I |
News |
Chart |
SEC
View all notes Alert
me of new notes
Company
Profile
|
ISRG
- NASDAQ
Intuitive Surgical Inc
HEALTH SERVICES - Medical Appliances & Equipment
|
$362.17
|
-2.81
|
421,816
74% DAV
568,400
|
4/13/2010
(Date
Featured) |
$363.46
(Price
Featured) |
PP = $367.10 |
Y |
| MB = $385.46 |
Most Recent Note - 4/26/2010 5:05:09 PM
Y - Holding its ground stubbornly with volume cooling since its considerable loss with 4 times average volume on 4/16/10 after reporting earnings. Any subsequent violation of its recent chart low or 50 DMA line could raise more serious concerns. ISRG was featured again in the 4/13/10 mid-day report (read here) with new pivot point cited based on its 3/03/10 high.
>>> The latest Featured Stock Update with an annotated graph appeared on 4/7/2010. click here.
|
|
C
A
S
I |
News |
Chart |
SEC
View all notes Alert
me of new notes
Company
Profile
|
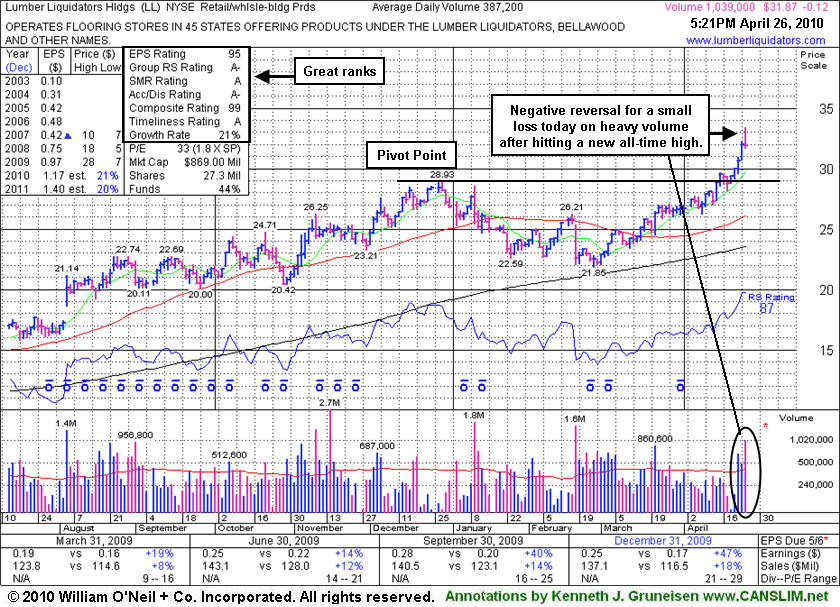
LL
- NYSE
Lumber Liquidators Hldgs
RETAIL - Home Improvement Stores
|
$31.87
|
-0.12
|
1,039,141
280% DAV
371,000
|
4/22/2010
(Date
Featured) |
$29.87
(Price
Featured) |
PP = $29.03 |
G |
| MB = $30.48 |
Most Recent Note - 4/26/2010 5:45:02 PM
G - After early gains today it negatively reversed. It quickly got extended beyond the "max buy" guideline used by disciplined investors. It is due to report earnings before the open on Wednesday, 4/28/10. First featured in yellow at $29.87 in the 4/22/10 the mid-day report (read here) - "rising from an orderly cup shaped pattern (without a proper handle) formed since last noted on 12/17/09. It rallied steadily after a 'breakaway gap' on 8/05/09 helped it clear stubborn resistance in the $17 area. Quarterly sales and earnings increases have recently shown encouraging acceleration while growth rates have previously been noted as below the investment system's guidelines."
>>> The latest Featured Stock Update with an annotated graph appeared on 4/26/2010. click here.
|
|
C
A
S
I |
News |
Chart |
SEC
View all notes Alert
me of new notes
Company
Profile
|
LOPE
- NASDAQ
Grand Canyon Education
DIVERSIFIED SERVICES - Education &; Training Services
|
$25.83
|
-0.29
|
243,599
73% DAV
333,400
|
4/13/2010
(Date
Featured) |
$27.71
(Price
Featured) |
PP = $27.33 |
G |
| MB = $28.70 |
Most Recent Note - 4/26/2010 6:26:53 PM
G - Down today on light volume for a 4th consecutive loss. Its color code is changed to green as it has slumped further below its pivot point and closed below its old high close ($26.64 on 3/25/10), raising more concerns. Featured in the 4/13/10 mid-day report (read here), its gain triggered a technical buy after an advanced "3-weeks tight" type pattern.
>>> The latest Featured Stock Update with an annotated graph appeared on 4/14/2010. click here.
|
|
C
A
S
I |
News |
Chart |
SEC
View all notes Alert
me of new notes
Company
Profile
|
PCLN
- NASDAQ
Priceline.com Inc
INTERNET - Internet Software & Services
|
$399.55
|
-4.72
|
584,812
N/A
|
11/1/2002
(Date
Featured) |
$399.55
(Price
Featured) |
PP = $428.20 |
Y |
| MB = $449.61 |
Most Recent Note - 1/2/2011
Y - Returns to Featured Stocks list with its appearance in the January 2011 CANSLIM.net News including detailed analysis and annotated daily and weekly graphs.
>>> The latest Featured Stock Update with an annotated graph appeared on 3/30/2010. click here.
|
|
C
A
S
I |
News |
Chart |
SEC
View all notes Alert
me of new notes
Company
Profile
|
ROVI
- NASDAQ
Rovi Corp
COMPUTER SOFTWARE & SERVICES - Security Software & Services
|
$39.77
|
+0.32
|
801,448
61% DAV
1,323,500
|
4/20/2010
(Date
Featured) |
$37.62
(Price
Featured) |
PP = $38.60 |
Y |
| MB = $40.53 |
Most Recent Note - 4/26/2010 6:32:56 PM
Y - Today's small gap up gain for a new 52-week high came with very light volume. Its 4/23/10 rally above its pivot point had only +34% above average volume, below the volume threshold for a solid new technical buy signal. Its 50 DMA line and recent chart low ($35.91 on 4/08/10) define important support to watch. Earnings news is due on May 6th.
>>> The latest Featured Stock Update with an annotated graph appeared on 4/8/2010. click here.
|
|
C
A
S
I |
News |
Chart |
SEC
View all notes Alert
me of new notes
Company
Profile
|
SIRO
- NASDAQ
Sirona Dental Systems
HEALTH SERVICES - Medical Instruments & Supplies
|
$42.04
|
-0.39
|
837,473
154% DAV
542,400
|
2/16/2010
(Date
Featured) |
$36.43
(Price
Featured) |
PP = $36.15 |
G |
| MB = $37.96 |
Most Recent Note - 4/26/2010 6:36:22 PM
G - Pulled back today following a 4/23/10 gap up for a considerable gain and new 52-week high. Extended from any sound base, its prior chart highs and 50 DMA line in the $36 area define an initial support level to watch. Earnings release is scheduled for May 5th.
>>> The latest Featured Stock Update with an annotated graph appeared on 4/22/2010. click here.
|
|
C
A
S
I |
News |
Chart |
SEC
View all notes Alert
me of new notes
Company
Profile
|
ULTA
- NASDAQ
Ulta Salon Cosm & Frag
SPECIALTY RETAIL - Specialty Retail, Other
|
$24.97
|
-0.39
|
268,287
68% DAV
393,600
|
3/12/2010
(Date
Featured) |
$22.81
(Price
Featured) |
PP = $21.72 |
G |
| MB = $22.81 |
Most Recent Note - 4/26/2010 6:38:13 PM
G - Early gain helped it hit a new 52-week high today, then it reversed into the red for a small loss on light volume. Its 50 DMA line defines support. Held its ground above prior highs since it was featured in a detailed Stock Bulletin and mid-day report appearances on 3/12/10.
>>> The latest Featured Stock Update with an annotated graph appeared on 4/1/2010. click here.
|
|
C
A
S
I |
News |
Chart |
SEC
View all notes Alert
me of new notes
Company
Profile
|
VIT
-
|
$26.37
|
+0.81
|
461,944
71% DAV
650,200
|
4/9/2010
(Date
Featured) |
$23.79
(Price
Featured) |
PP = $23.95 |
G |
| MB = $25.15 |
Most Recent Note - 4/26/2010 6:41:16 PM
G - Gain today on light volume, getting more extended above its "max buy" level. Prior chart highs in the $23 area are an initial support level to watch above its 50 DMA line. Featured in the 4/09/10 mid-day report (read here).
>>> The latest Featured Stock Update with an annotated graph appeared on 4/9/2010. click here.
|
|
C
A
S
I |
News |
Chart |
SEC
View all notes Alert
me of new notes
Company
Profile
|
VPRT
- NASDAQ
Vistaprint Nv
DIVERSIFIED SERVICES - Business/Management Services
|
$61.43
|
-0.03
|
486,793
135% DAV
361,600
|
4/23/2010
(Date
Featured) |
$61.46
(Price
Featured) |
PP = $62.64 |
Y |
| MB = $65.77 |
Most Recent Note - 4/26/2010 6:43:44 PM
Y - Small loss today ended a streak of 8 consecutive small gains. It has recently found impressive support near its 50 DMA line, and its color code was changed to yellow with new pivot point cited. Volume +50% above average or greater is still required to trigger a proper technical buy signal. It did not trigger a new technical buy signal since it was featured in the March 2010 CANSLIM.net News monthly newsletter (read here).
>>> The latest Featured Stock Update with an annotated graph appeared on 4/15/2010. click here.
|
|
C
A
S
I |
News |
Chart |
SEC
View all notes Alert
me of new notes
Company
Profile
|