***Last / Change / Volume data in this table is the closing quote data***
Symbol/Exchange
Company Name
Industry Group |
PRICE |
CHANGE
(%Change) |
Day High |
Volume
(% DAV)
(% 50 day avg vol) |
52 Wk Hi
% From Hi |
Featured
Date |
Price
Featured |
Pivot Featured |
|
Max Buy |
ACN
-
NYSE
Accenture Plc
DIVERSIFIED SERVICES - Business/Management Services
|
$64.06
|
+1.24
1.97% |
$64.15
|
2,840,605
87.04% of 50 DAV
50 DAV is 3,263,600
|
$65.89
-2.78%
|
3/23/2012
|
$64.13
|
PP = $63.76
|
|
MB = $66.95
|
Most Recent Note - 4/23/2012 11:51:09 AM
Y - Gapped down today amid widespread market weakness. Slumping back below its pivot point near prior highs in the $62-63 area and its 50 DMA line defining important near-term support.
>>> The latest Featured Stock Update with an annotated graph appeared on 3/23/2012. Click here.
View all notes |
Alert me of new notes |
CANSLIM.net Company Profile |
SEC |
Zacks Reports |
StockTalk |
News |
Chart |
Request a new note
C
A N
S L
I M


|
ADS
-
NYSE
Alliance Data Sys Corp
COMPUTER SOFTWARE and SERVICES - Information and Delivery Service
|
$128.85
|
+1.63
1.28% |
$129.44
|
478,684
79.62% of 50 DAV
50 DAV is 601,200
|
$130.31
-1.12%
|
1/17/2012
|
$108.24
|
PP = $107.43
|
|
MB = $112.80
|
Most Recent Note - 4/24/2012 6:58:14 PM
G - Still holding its ground near its all-time high today. Reported earnings +17% on +20% sales revenues for the quarter ended March 31, 2012 versus the year-ago period. Fundamental concerns were raised earlier by earnings reported +9%, well below the +25% minimum guideline, for the latest quarter ended December 31, 2011 versus the year-ago period. See the latest FSU analysis for more details and a new annotated graph.
>>> The latest Featured Stock Update with an annotated graph appeared on 4/24/2012. Click here.
View all notes |
Alert me of new notes |
CANSLIM.net Company Profile |
SEC |
Zacks Reports |
StockTalk |
News |
Chart |
Request a new note
C
A N
S L
I M
|
ALLT
-
NASDAQ
Allot Communications Ltd
COMPUTER SOFTWARE andamp; SERVICES - Technical andamp; System Software
|
$23.74
|
+0.60
2.59% |
$23.98
|
219,155
48.06% of 50 DAV
50 DAV is 456,000
|
$25.36
-6.39%
|
3/13/2012
|
$19.72
|
PP = $18.91
|
|
MB = $19.86
|
Most Recent Note - 4/23/2012 11:31:47 AM
G - Down today amid widespread market weakness. There was a "negative reversal" on 4/19/12 after touching a new all-time high. Volume totals have been cooling while stubbornly holding its ground, a sign that few are exiting, while it remains perched near its 52-week high. Its latest consolidation has been brief, yet it may be forming an advanced "3-weeks tight" base well above its 50 DMA line and prior highs near $18-19 that define support to watch on pullbacks.
>>> The latest Featured Stock Update with an annotated graph appeared on 3/19/2012. Click here.
View all notes |
Alert me of new notes |
CANSLIM.net Company Profile |
SEC |
Zacks Reports |
StockTalk |
News |
Chart |
Request a new note
C
A N
S L
I M
|
ALXN
-
NASDAQ
Alexion Pharmaceuticals
DRUGS - Drug Manufacturers - Other
|
$90.46
|
+1.56
1.75% |
$90.98
|
1,370,699
110.02% of 50 DAV
50 DAV is 1,245,900
|
$95.01
-4.79%
|
3/12/2012
|
$87.87
|
PP = $87.73
|
|
MB = $92.12
|
Most Recent Note - 4/24/2012 12:00:40 PM
G - Gapped up today but then reversed into the red. Recently found support at its 50 DMA line, and it is now consolidating above that important short-term average, possibly building a new late-stage base.
>>> The latest Featured Stock Update with an annotated graph appeared on 4/16/2012. Click here.
View all notes |
Alert me of new notes |
CANSLIM.net Company Profile |
SEC |
Zacks Reports |
StockTalk |
News |
Chart |
Request a new note
C
A N
S L
I M
|
BODY
-
NASDAQ
Body Central Corp
RETAIL - Catalog andamp; Mail Order Houses
|
$28.29
|
+0.85
3.10% |
$28.32
|
182,359
92.10% of 50 DAV
50 DAV is 198,000
|
$29.49
-4.07%
|
4/18/2012
|
$27.44
|
PP = $29.59
|
|
MB = $31.07
|
 Most Recent Note - 4/25/2012 8:11:58 PM
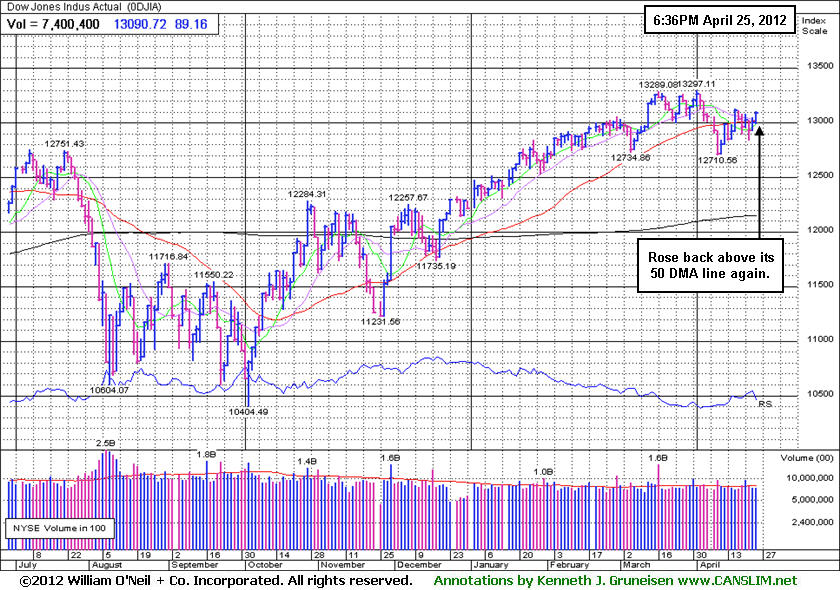
Y - Rebounded above its 50 DMA line today. Volume-driven gains above the pivot point may trigger a new (or add-on) technical buy signal. Subsequent damaging losses below its recent lows (near $25) would raise more serious concerns and trigger additional sell signals.
>>> The latest Featured Stock Update with an annotated graph appeared on 3/13/2012. Click here.
View all notes |
Alert me of new notes |
CANSLIM.net Company Profile |
SEC |
Zacks Reports |
StockTalk |
News |
Chart |
Request a new note
C
A N
S L
I M
|
Symbol/Exchange
Company Name
Industry Group |
PRICE |
CHANGE
(%Change) |
Day High |
Volume
(% DAV)
(% 50 day avg vol) |
52 Wk Hi
% From Hi |
Featured
Date |
Price
Featured |
Pivot Featured |
|
Max Buy |
CDNS
-
NASDAQ
Cadence Design Systems
COMPUTER SOFTWARE and SERVICES - Technical and System Software
|
$11.67
|
+0.39
3.46% |
$11.70
|
3,782,946
133.87% of 50 DAV
50 DAV is 2,825,800
|
$12.60
-7.38%
|
2/3/2012
|
$11.66
|
PP = $11.15
|
|
MB = $11.71
|
Most Recent Note - 4/25/2012 10:25:25 AM
G - Up today following a streak of 5 consecutive losses and distributional pressure that briefly undercut the prior low ($11.20 on 4/10/12) and raised more serious concerns. Its 50 DMA line acted as resistance since last noted, and a rebound above that important short-term average is needed for its technical stance and outlook to improve.
>>> The latest Featured Stock Update with an annotated graph appeared on 3/28/2012. Click here.
View all notes |
Alert me of new notes |
CANSLIM.net Company Profile |
SEC |
Zacks Reports |
StockTalk |
News |
Chart |
Request a new note
C
A N
S L
I M
|
CELG
-
NASDAQ
Celgene Corp
DRUGS - Drug Manufacturers - Major
|
$77.91
|
+0.56
0.72% |
$78.66
|
3,075,947
114.99% of 50 DAV
50 DAV is 2,674,900
|
$80.42
-3.12%
|
2/2/2012
|
$74.16
|
PP = $75.21
|
|
MB = $78.97
|
Most Recent Note - 4/25/2012 10:30:03 AM
G - Consolidating just under its "max buy" level and above its 50 DMA line which defines important support to watch. Weakening market conditions (M criteria) are an overriding concern arguing in favor of reducing exposure to stocks, especially if more technical deterioration occurs.
>>> The latest Featured Stock Update with an annotated graph appeared on 3/26/2012. Click here.
View all notes |
Alert me of new notes |
CANSLIM.net Company Profile |
SEC |
Zacks Reports |
StockTalk |
News |
Chart |
Request a new note
C
A N
S L
I M
|
COO
-
NYSE
Cooper Companies Inc
HEALTH SERVICES - Medical Instruments and Supplies
|
$86.69
|
+1.06
1.24% |
$87.54
|
501,712
115.90% of 50 DAV
50 DAV is 432,900
|
$87.18
-0.56%
|
3/9/2012
|
$83.05
|
PP = $81.02
|
|
MB = $85.07
|
Most Recent Note - 4/25/2012 10:32:17 AM
G - Up today without great volume conviction while trading to new 52-week and all-time highs above its "max buy" level. Color code is changed to green after getting extended from its prior base.
>>> The latest Featured Stock Update with an annotated graph appeared on 3/9/2012. Click here.
View all notes |
Alert me of new notes |
CANSLIM.net Company Profile |
SEC |
Zacks Reports |
StockTalk |
News |
Chart |
Request a new note
C
A N
S L
I M
|
DISH
-
NASDAQ
Dish Network Corp Cl A
CONSUMER DURABLES - Electronic Equipment
|
$31.64
|
+0.67
2.16% |
$31.71
|
1,072,766
41.86% of 50 DAV
50 DAV is 2,562,600
|
$35.64
-11.22%
|
3/7/2012
|
$30.83
|
PP = $30.10
|
|
MB = $31.61
|
Most Recent Note - 4/25/2012 8:13:52 PM
G - Today's gain on light volume helped it bounce from important support at its 50 DMA line. Continued support near that important short-term average would help its outlook, but further deterioration would raise more serious concerns.
>>> The latest Featured Stock Update with an annotated graph appeared on 3/14/2012. Click here.
View all notes |
Alert me of new notes |
CANSLIM.net Company Profile |
SEC |
Zacks Reports |
StockTalk |
News |
Chart |
Request a new note
C
A N
S L
I M
|
FEIC
-
NASDAQ
F E I Co
ELECTRONICS - Diversified Electronics
|
$48.56
|
+2.07
4.45% |
$48.74
|
374,681
124.52% of 50 DAV
50 DAV is 300,900
|
$49.92
-2.72%
|
12/7/2011
|
$41.41
|
PP = $42.35
|
|
MB = $44.47
|
Most Recent Note - 4/25/2012 10:19:54 AM
G - Consolidating above its 50 DMA line, building a new base. The latest quarterly report showed +21% earnings for the Dec '11 quarter, below the +25% minimum guideline for earnings growth.
>>> The latest Featured Stock Update with an annotated graph appeared on 3/12/2012. Click here.
View all notes |
Alert me of new notes |
CANSLIM.net Company Profile |
SEC |
Zacks Reports |
StockTalk |
News |
Chart |
Request a new note
C
A N
S L
I M
|
Symbol/Exchange
Company Name
Industry Group |
PRICE |
CHANGE
(%Change) |
Day High |
Volume
(% DAV)
(% 50 day avg vol) |
52 Wk Hi
% From Hi |
Featured
Date |
Price
Featured |
Pivot Featured |
|
Max Buy |
GNC
-
NYSE
G N C Holdings Inc
RETAIL - Drug Stores
|
$39.89
|
+4.41
12.43% |
$40.82
|
5,136,401
300.08% of 50 DAV
50 DAV is 1,711,700
|
$36.41
9.56%
|
1/19/2012
|
$28.99
|
PP = $29.60
|
|
MB = $31.08
|
Most Recent Note - 4/25/2012 12:30:28 PM
G - Gapped up today for a considerable gain and new all-time high after reporting earnings +82% on +23% sales revenues for the quarter ended March 31, 2012 versus the year ago period. It has shown bullish action in recent weeks but did not form a sound new base pattern. It completed Secondary Offerings on 10/25/11 and 3/13/12 after making steady progress following its 4/01/11 IPO.
>>> The latest Featured Stock Update with an annotated graph appeared on 3/5/2012. Click here.
View all notes |
Alert me of new notes |
CANSLIM.net Company Profile |
SEC |
Zacks Reports |
StockTalk |
News |
Chart |
Request a new note
C
A N
S L
I M
|
HLF
-
NYSE
Herbalife Ltd
DRUGS - Nutrition and Weight Management
|
$70.15
|
+1.05
1.52% |
$71.25
|
2,095,837
146.65% of 50 DAV
50 DAV is 1,429,100
|
$73.00
-3.90%
|
4/18/2012
|
$71.19
|
PP = $72.21
|
|
MB = $75.82
|
Most Recent Note - 4/25/2012 12:42:05 PM
Y - Still consolidating above its 50 DMA line, important support to watch, following a damaging 4/24/12 loss. Previously noted - "Churning above average volume this week without making meaningful price progress above prior highs. Volume-driven gains for new highs did not trigger a proper new (or add-on) technical buy signal."
>>> The latest Featured Stock Update with an annotated graph appeared on 4/13/2012. Click here.
View all notes |
Alert me of new notes |
CANSLIM.net Company Profile |
SEC |
Zacks Reports |
StockTalk |
News |
Chart |
Request a new note
C
A N
S L
I M
|
ISRG
-
NASDAQ
Intuitive Surgical Inc
HEALTH SERVICES - Medical Appliances and Equipment
|
$575.50
|
+15.39
2.75% |
$578.36
|
276,311
93.35% of 50 DAV
50 DAV is 296,000
|
$594.89
-3.26%
|
12/20/2011
|
$442.43
|
PP = $449.16
|
|
MB = $471.62
|
Most Recent Note - 4/20/2012 12:13:37 PM
G - Holding its ground following a considerable gap up gain on 4/18/12. It may produce more climactic gains, however it has not spent much time basing since its last "Featured Date" when highlighted in yellow on 12/23/11. Disciplined investors always limit losses if any stock falls -7% from their purchase price. It is on track for a 10th consecutive weekly gain.
>>> The latest Featured Stock Update with an annotated graph appeared on 3/1/2012. Click here.
View all notes |
Alert me of new notes |
CANSLIM.net Company Profile |
SEC |
Zacks Reports |
StockTalk |
News |
Chart |
Request a new note
C
A N
S L
I M
|
LULU
-
NASDAQ
Lululemon Athletica
MANUFACTURING - Textile Manufacturing
|
$71.93
|
+1.75
2.49% |
$72.59
|
2,196,232
109.91% of 50 DAV
50 DAV is 1,998,200
|
$77.13
-6.74%
|
1/10/2012
|
$60.97
|
PP = $59.46
|
|
MB = $62.43
|
Most Recent Note - 4/24/2012 2:06:21 PM
G - Raising concerns with yet another distribution day, it violated its 50 DMA line with today's loss on higher volume. Only a prompt rebound above its short-term average would help its outlook.
>>> The latest Featured Stock Update with an annotated graph appeared on 4/12/2012. Click here.
View all notes |
Alert me of new notes |
CANSLIM.net Company Profile |
SEC |
Zacks Reports |
StockTalk |
News |
Chart |
Request a new note
C
A N
S L
I M
|
MA
-
NYSE
Mastercard Inc Cl A
DIVERSIFIED SERVICES - Business/Management Services
|
$445.06
|
+14.76
3.43% |
$445.06
|
978,076
119.91% of 50 DAV
50 DAV is 815,700
|
$443.80
0.28%
|
3/12/2012
|
$419.86
|
PP = $428.67
|
|
MB = $450.10
|
Most Recent Note - 4/25/2012 8:08:54 PM
Y - Considerable gain today with slightly above average volume for new 52-week and all-time highs. This week it tested its 50 DMA line and found support.
>>> The latest Featured Stock Update with an annotated graph appeared on 4/11/2012. Click here.
View all notes |
Alert me of new notes |
CANSLIM.net Company Profile |
SEC |
Zacks Reports |
StockTalk |
News |
Chart |
Request a new note
C
A N
S L
I M
|
Symbol/Exchange
Company Name
Industry Group |
PRICE |
CHANGE
(%Change) |
Day High |
Volume
(% DAV)
(% 50 day avg vol) |
52 Wk Hi
% From Hi |
Featured
Date |
Price
Featured |
Pivot Featured |
|
Max Buy |
MELI
-
NASDAQ
Mercadolibre Inc
INTERNET - Internet Software and; Services
|
$91.57
|
+3.50
3.97% |
$91.80
|
332,800
67.66% of 50 DAV
50 DAV is 491,900
|
$104.50
-12.37%
|
2/6/2012
|
$97.09
|
PP = $95.58
|
|
MB = $100.36
|
Most Recent Note - 4/25/2012 8:10:03 PM
G - It remains well below its 50 DMA line while today's gain on light volume broke a streak of 3 consecutive losses. It now faces resistance due to overhead supply up through the $104 level that will hinder its progress.
>>> The latest Featured Stock Update with an annotated graph appeared on 3/29/2012. Click here.
View all notes |
Alert me of new notes |
CANSLIM.net Company Profile |
SEC |
Zacks Reports |
StockTalk |
News |
Chart |
Request a new note
C
A N
S L
I M
|
MG
-
NYSE
Mistras Group Inc
DIVERSIFIED SERVICES - Bulding and Faci;ity Management Services
|
$23.73
|
+0.42
1.80% |
$23.83
|
59,673
58.56% of 50 DAV
50 DAV is 101,900
|
$26.24
-9.57%
|
3/22/2012
|
$24.96
|
PP = $26.34
|
|
MB = $27.66
|
Most Recent Note - 4/20/2012 1:38:13 PM
G - Gain today has it rebounding above its 50 DMA line. A volume-driven gain above its recent chart high ($25.49 on 3/21/12) may help trigger a proper technical buy signal after a new base formation, however no new (lower) pivot point is currently being cited, and it may continue encountering stubborn resistance.
>>> The latest Featured Stock Update with an annotated graph appeared on 4/2/2012. Click here.
View all notes |
Alert me of new notes |
CANSLIM.net Company Profile |
SEC |
Zacks Reports |
StockTalk |
News |
Chart |
Request a new note
C
A N
S L
I M
|
MKTX
-
NASDAQ
Marketaxess Holdings Inc
FINANCIAL SERVICES - Investment Brokerage - Nationa
|
$35.39
|
-0.66
-1.83% |
$36.75
|
333,748
107.80% of 50 DAV
50 DAV is 309,600
|
$37.95
-6.75%
|
3/8/2012
|
$35.80
|
PP = $35.52
|
|
MB = $37.30
|
Most Recent Note - 4/20/2012 1:40:58 PM
Y - Color code was changed to yellow based on its impressive resilience. Volume totals have been cooling since it rebounded above its 50 DMA line after a brief intra-day violation on 4/12/12.
>>> The latest Featured Stock Update with an annotated graph appeared on 3/8/2012. Click here.
View all notes |
Alert me of new notes |
CANSLIM.net Company Profile |
SEC |
Zacks Reports |
StockTalk |
News |
Chart |
Request a new note
C
A N
S L
I M
|
NTES
-
NASDAQ
Netease Inc Adr
INTERNET - Internet Information Providers
|
$59.63
|
+1.49
2.56% |
$59.82
|
640,458
92.58% of 50 DAV
50 DAV is 691,800
|
$60.50
-1.44%
|
3/19/2012
|
$56.18
|
PP = $55.10
|
|
MB = $57.86
|
Most Recent Note - 4/23/2012 2:53:14 PM
G - Consolidating just above its "max buy" level and its color code is changed to green. Recent lows and prior highs in the $55 area define important near-term chart support to watch above its 50 DMA line.
>>> The latest Featured Stock Update with an annotated graph appeared on 3/27/2012. Click here.
View all notes |
Alert me of new notes |
CANSLIM.net Company Profile |
SEC |
Zacks Reports |
StockTalk |
News |
Chart |
Request a new note
C
A N
S L
I M
|
RAX
-
NYSE
Rackspace Hosting Inc
INTERNET - Internet Software and; Services
|
$55.29
|
+1.84
3.44% |
$55.92
|
1,438,212
72.96% of 50 DAV
50 DAV is 1,971,100
|
$60.00
-7.85%
|
2/2/2012
|
$46.69
|
PP = $45.55
|
|
MB = $47.83
|
Most Recent Note - 4/24/2012 2:16:49 PM
G - Down again today and slumping below its 50 DMA line after triggering a technical sell signal with a damaging loss. Only a prompt rebound above that short-term average would help its outlook.
>>> The latest Featured Stock Update with an annotated graph appeared on 4/10/2012. Click here.
View all notes |
Alert me of new notes |
CANSLIM.net Company Profile |
SEC |
Zacks Reports |
StockTalk |
News |
Chart |
Request a new note
C
A N
S L
I M
|
Symbol/Exchange
Company Name
Industry Group |
PRICE |
CHANGE
(%Change) |
Day High |
Volume
(% DAV)
(% 50 day avg vol) |
52 Wk Hi
% From Hi |
Featured
Date |
Price
Featured |
Pivot Featured |
|
Max Buy |
RGR
-
NYSE
Sturm Ruger & Co Inc
CONSUMER DURABLES - Sporting Goods
|
$54.60
|
+1.35
2.54% |
$54.77
|
465,273
115.51% of 50 DAV
50 DAV is 402,800
|
$54.59
0.02%
|
3/22/2012
|
$46.49
|
PP = $46.78
|
|
MB = $49.12
|
Most Recent Note - 4/23/2012 12:47:12 PM
G - Holding its ground at its 52-week high today following 4 consecutive gains. It is extended from any sound base. Found prompt support after a pullback near its prior high in the $46 area previously noted as support to watch above its 50 DMA line.
>>> The latest Featured Stock Update with an annotated graph appeared on 3/22/2012. Click here.
View all notes |
Alert me of new notes |
CANSLIM.net Company Profile |
SEC |
Zacks Reports |
StockTalk |
News |
Chart |
Request a new note
C
A N
S L
I M
|
RRTS
-
NYSE
Roadrunner Trans Systems
TRANSPORTATION - Air Delivery and Freight Service
|
$16.97
|
+0.07
0.41% |
$17.19
|
40,731
39.82% of 50 DAV
50 DAV is 102,300
|
$18.59
-8.71%
|
2/10/2012
|
$17.40
|
PP = $17.50
|
|
MB = $18.38
|
Most Recent Note - 4/24/2012 4:47:46 PM
G - Down today with higher (near average) volume. Its 50 DMA line acted as resistance when it rebounded from its latest lows. After finding recent support, any subsequent deterioration below the prior low ($16.65 on 4/10/12) would raise more serious concerns and trigger more worrisome sell signals.
>>> The latest Featured Stock Update with an annotated graph appeared on 4/9/2012. Click here.
View all notes |
Alert me of new notes |
CANSLIM.net Company Profile |
SEC |
Zacks Reports |
StockTalk |
News |
Chart |
Request a new note
C
A N
S L
I M
|
SHFL
-
NASDAQ
Shuffle Master Inc
MANUFACTURING - Diversified Machinery
|
$16.91
|
+0.34
2.05% |
$17.28
|
324,172
48.69% of 50 DAV
50 DAV is 665,800
|
$18.77
-9.91%
|
3/6/2012
|
$17.07
|
PP = $15.25
|
|
MB = $16.01
|
Most Recent Note - 4/24/2012 4:44:45 PM
G - Consolidating just above its 50 DMA line. Its prior low ($16.14 on 4/10/12) and its short-term average define important near-term chart support to watch. It is -11.7% off its 52-week high today, extended from any sound base pattern.
>>> The latest Featured Stock Update with an annotated graph appeared on 3/15/2012. Click here.
View all notes |
Alert me of new notes |
CANSLIM.net Company Profile |
SEC |
Zacks Reports |
StockTalk |
News |
Chart |
Request a new note
C
A N
S L
I M
|
SXCI
-
NASDAQ
S X C Health Solutions
COMPUTER SOFTWARE and SERVICES - Healthcare Information Service
|
$92.81
|
+1.17
1.28% |
$94.32
|
731,339
84.30% of 50 DAV
50 DAV is 867,500
|
$100.50
-7.65%
|
2/23/2012
|
$68.24
|
PP = $66.05
|
|
MB = $69.35
|
Most Recent Note - 4/23/2012 2:44:55 PM
G - Perched near its all-time high today, very extended from its prior base. The market cheered the 4/18/12 news it will acquire and merge with Catalyst Health Solutions Inc (CHSI), rallying with volume-driven gains.
>>> The latest Featured Stock Update with an annotated graph appeared on 3/6/2012. Click here.
View all notes |
Alert me of new notes |
CANSLIM.net Company Profile |
SEC |
Zacks Reports |
StockTalk |
News |
Chart |
Request a new note
C
A N
S L
I M
|
TDG
-
NYSE
Transdigm Group Inc
AEROSPACE/DEFENSE - Aerospace/Defense Products and; Services
|
$124.70
|
+2.97
2.44% |
$125.00
|
631,045
155.16% of 50 DAV
50 DAV is 406,700
|
$123.39
1.06%
|
2/29/2012
|
$120.10
|
PP = $118.93
|
|
MB = $124.88
|
Most Recent Note - 4/25/2012 1:29:42 PM
Y - Small gap up today, hitting new 52-week and all-time highs and approaching the previously cited "max buy" level. Solid gain on 4/20/12 with +75% above average volume met the guideline for a proper technical buy signal. The encouraging sign of fresh institutional buying demand may signal the beginning of a meaningful leg up, but keep in mind 3 out of 4 stocks follow the direction of the major averages (M criteria) and the market has recently been pulling back under distributional pressure. Prior highs in the $118-121 area define initial chart support to watch on pullbacks.
>>> The latest Featured Stock Update with an annotated graph appeared on 3/30/2012. Click here.
View all notes |
Alert me of new notes |
CANSLIM.net Company Profile |
SEC |
Zacks Reports |
StockTalk |
News |
Chart |
Request a new note
C
A N
S L
I M
|
Symbol/Exchange
Company Name
Industry Group |
PRICE |
CHANGE
(%Change) |
Day High |
Volume
(% DAV)
(% 50 day avg vol) |
52 Wk Hi
% From Hi |
Featured
Date |
Price
Featured |
Pivot Featured |
|
Max Buy |
TIBX
-
NASDAQ
Tibco Software Inc
COMPUTER SOFTWARE and SERVICES - Business Software and Services
|
$32.57
|
+1.03
3.27% |
$32.62
|
2,686,661
93.59% of 50 DAV
50 DAV is 2,870,800
|
$34.67
-6.05%
|
3/30/2012
|
$31.01
|
PP = $31.25
|
|
MB = $32.81
|
Most Recent Note - 4/24/2012 4:06:24 PM
G - Sank near its pivot point and closed near the session low with above average volume behind today's 4th consecutive loss. Raised concerns as it violated the previously noted upward trendline connecting its December, March, and April lows triggering an early sell signal. Important support to watch is at prior highs in the $31 area and its 50 DMA line where more damaging losses would raise serious concerns.
>>> The latest Featured Stock Update with an annotated graph appeared on 4/5/2012. Click here.
View all notes |
Alert me of new notes |
CANSLIM.net Company Profile |
SEC |
Zacks Reports |
StockTalk |
News |
Chart |
Request a new note
C
A N
S L
I M
|
TNGO
-
NASDAQ
Tangoe Inc
COMPUTER SOFTWARE and SERVICES - Technical and System Software
|
$20.35
|
+0.82
4.20% |
$20.35
|
282,628
41.88% of 50 DAV
50 DAV is 674,900
|
$21.74
-6.39%
|
3/27/2012
|
$19.35
|
PP = $20.00
|
|
MB = $21.00
|
Most Recent Note - 4/25/2012 8:06:31 PM
Y - Today's gain came on lighter volume following 3 consecutive losses, yet it rebounded above prior highs in the $20 area previously noted as initial support to watch on pullbacks. The 50 DMA line ($18.66) is the next important support level to watch.
>>> The latest Featured Stock Update with an annotated graph appeared on 4/3/2012. Click here.
View all notes |
Alert me of new notes |
CANSLIM.net Company Profile |
SEC |
Zacks Reports |
StockTalk |
News |
Chart |
Request a new note
C
A N
S L
I M
|
TSCO
-
NASDAQ
Tractor Supply Co
SPECIALTY RETAIL - Specialty Retail, Other
|
$97.49
|
+0.56
0.58% |
$98.59
|
952,664
128.08% of 50 DAV
50 DAV is 743,800
|
$101.20
-3.67%
|
1/12/2012
|
$79.12
|
PP = $75.58
|
|
MB = $79.36
|
Most Recent Note - 4/24/2012 4:08:07 PM
G - Loss today with higher volume indicated another day of distributional pressure. Still holding its ground near its all-time high, very extended from its prior base. Its 50 DMA line defines support to watch on pullbacks.
>>> The latest Featured Stock Update with an annotated graph appeared on 4/17/2012. Click here.
View all notes |
Alert me of new notes |
CANSLIM.net Company Profile |
SEC |
Zacks Reports |
StockTalk |
News |
Chart |
Request a new note
C
A N
S L
I M
|
UA
-
NYSE
Under Armour Inc Cl A
CONSUMER NON-DURABLES - Textile - Apparel Clothing
|
$96.66
|
+1.32
1.38% |
$97.37
|
1,004,979
101.39% of 50 DAV
50 DAV is 991,200
|
$102.86
-6.03%
|
2/15/2012
|
$85.77
|
PP = $84.86
|
|
MB = $89.10
|
Most Recent Note - 4/24/2012 12:36:11 PM
G - Slumping under prior highs with a loss today. No overhead supply remains to act as resistance, however no new pivot point was cited following its latest base. Concerns were raised by weaker fundamentals. Reported earnings +22% on +23% sales revenues for the quarter ended March 31, 2012 versus the year ago period, its first quarterly earnings increase below the +25% minimum guideline in more than 2 years.
>>> The latest Featured Stock Update with an annotated graph appeared on 4/4/2012. Click here.
View all notes |
Alert me of new notes |
CANSLIM.net Company Profile |
SEC |
Zacks Reports |
StockTalk |
News |
Chart |
Request a new note
C
A N
S L
I M
|
UBNT
-
NASDAQ
Ubiquiti Networks Inc
TELECOMMUNICATIONS - Diversified Communication Serv
|
$31.93
|
-0.26
-0.81% |
$32.50
|
156,055
44.38% of 50 DAV
50 DAV is 351,600
|
$35.32
-9.60%
|
4/12/2012
|
$33.89
|
PP = $34.07
|
|
MB = $35.77
|
Most Recent Note - 4/23/2012 2:33:14 PM
Y - Still pulling back from its all-time high. Formed an advanced "ascending base" pattern marked by 3 pullbacks of 10-20% following its previous breakout. Prior low ($30.25 on 4/09/12) defines initial support above its 50 DMA line.
>>> The latest Featured Stock Update with an annotated graph appeared on 4/20/2012. Click here.
View all notes |
Alert me of new notes |
CANSLIM.net Company Profile |
SEC |
Zacks Reports |
StockTalk |
News |
Chart |
Request a new note
C
A N
S L
I M
|
Symbol/Exchange
Company Name
Industry Group |
PRICE |
CHANGE
(%Change) |
Day High |
Volume
(% DAV)
(% 50 day avg vol) |
52 Wk Hi
% From Hi |
Featured
Date |
Price
Featured |
Pivot Featured |
|
Max Buy |
ULTA
-
NASDAQ
Ulta Salon Cosm & Frag
SPECIALTY RETAIL - Specialty Retail, Other
|
$89.13
|
+1.98
2.27% |
$89.81
|
1,092,576
160.34% of 50 DAV
50 DAV is 681,400
|
$96.65
-7.78%
|
1/11/2012
|
$71.97
|
PP = $75.80
|
|
MB = $79.59
|
Most Recent Note - 4/24/2012 1:59:49 PM
G - Violated its 50 DMA line with heavy volume behind a damaging loss today raising concerns. Prior highs in the $75 area are the next important support level to watch. See the latest FSU analysis for more details and a new annotated graph.
>>> The latest Featured Stock Update with an annotated graph appeared on 4/23/2012. Click here.
View all notes |
Alert me of new notes |
CANSLIM.net Company Profile |
SEC |
Zacks Reports |
StockTalk |
News |
Chart |
Request a new note
C
A N
S L
I M
|
V
-
NYSE
Visa Inc Cl A
DIVERSIFIED SERVICES - Business/Management Services
|
$121.79
|
+2.86
2.40% |
$122.40
|
3,037,607
94.46% of 50 DAV
50 DAV is 3,215,800
|
$123.68
-1.53%
|
3/12/2012
|
$116.53
|
PP = $119.46
|
|
MB = $125.43
|
Most Recent Note - 4/23/2012 2:37:54 PM
Y - Dipped below its 50 DMA line earlier in the session and volume is running at an above average pace today while on track for its 4th consecutive loss. Sputtering since its 4/13/12 gain backed by +49% above average volume technically confirmed a buy signal. Its 50 DMA line defines support to watch well above prior highs in the $103-104 area.
>>> The latest Featured Stock Update with an annotated graph appeared on 3/7/2012. Click here.
View all notes |
Alert me of new notes |
CANSLIM.net Company Profile |
SEC |
Zacks Reports |
StockTalk |
News |
Chart |
Request a new note
C
A N
S L
I M
|
VMW
-
NYSE
Vmware Inc Cl A
COMPUTER SOFTWARE andamp; SERVICES - Technical andamp; System Software
|
$106.69
|
+3.21
3.10% |
$107.00
|
2,228,884
141.99% of 50 DAV
50 DAV is 1,569,800
|
$118.79
-10.19%
|
4/18/2012
|
$110.04
|
PP = $115.29
|
|
MB = $121.05
|
Most Recent Note - 4/24/2012 2:08:54 PM
G - Violated its 50 DMA line with today's loss, raising concerns. Its color code is changed to green based on technical deterioration. Reported +38% earnings on +25% sales revenues for the quarter ended March 31, 2012 versus the year ago period.
>>> The latest Featured Stock Update with an annotated graph appeared on 4/18/2012. Click here.
View all notes |
Alert me of new notes |
CANSLIM.net Company Profile |
SEC |
Zacks Reports |
StockTalk |
News |
Chart |
Request a new note
C
A N
S L
I M
|
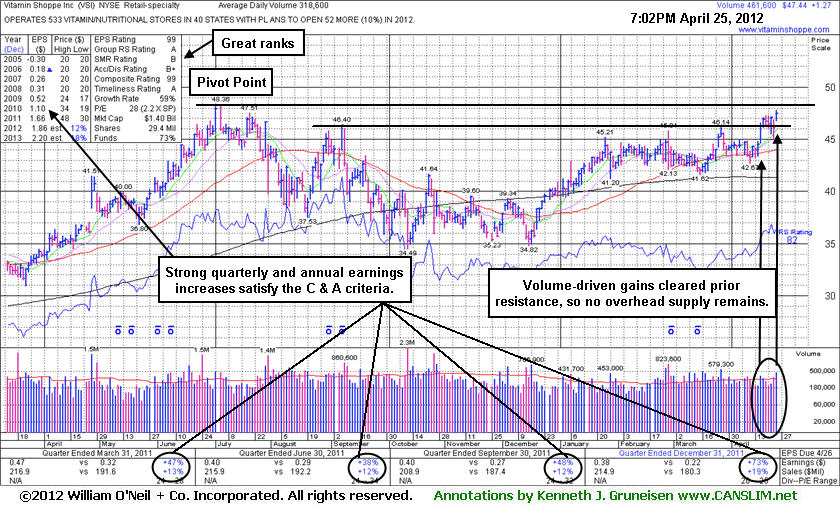
VSI
-
NYSE
Vitamin Shoppe Inc
SPECIALTY RETAIL - Specialty Retail, Other
|
$47.44
|
+1.27
2.75% |
$47.79
|
463,065
145.34% of 50 DAV
50 DAV is 318,600
|
$48.36
-1.90%
|
4/25/2012
|
$47.77
|
PP = $48.46
|
|
MB = $50.88
|
Most Recent Note - 4/25/2012 8:04:03 PM
Y - Gapped up today, rallying near its 52-week high. Color code was changed to yellow with pivot point based on its 7/05/11 high after a near 10-month cup shaped base. See the latest FSU analysis for more details and an annotated graph.
>>> The latest Featured Stock Update with an annotated graph appeared on 4/25/2012. Click here.
View all notes |
Alert me of new notes |
CANSLIM.net Company Profile |
SEC |
Zacks Reports |
StockTalk |
News |
Chart |
Request a new note
C
A N
S L
I M
|