***Last / Change / Volume data in this table is the closing quote data***
Symbol/Exchange
Company Name
Industry Group |
PRICE |
CHANGE
(%Change) |
Day High |
Volume
(% DAV)
(% 50 day avg vol) |
52 Wk Hi
% From Hi |
Featured
Date |
Price
Featured |
Pivot Featured |
|
Max Buy |
ACN
-
NYSE
Accenture Plc
DIVERSIFIED SERVICES - Business/Management Services
|
$62.82
|
-0.21
-0.33% |
$63.69
|
3,056,768
93.95% of 50 DAV
50 DAV is 3,253,700
|
$65.89
-4.66%
|
3/23/2012
|
$64.13
|
PP = $63.76
|
|
MB = $66.95
|
Most Recent Note - 4/23/2012 11:51:09 AM
Y - Gapped down today amid widespread market weakness. Slumping back below its pivot point near prior highs in the $62-63 area and its 50 DMA line defining important near-term support.
>>> The latest Featured Stock Update with an annotated graph appeared on 3/23/2012. Click here.
View all notes |
Alert me of new notes |
CANSLIM.net Company Profile |
SEC |
Zacks Reports |
StockTalk |
News |
Chart |
Request a new note
C
A N
S L
I M


|
ADS
-
NYSE
Alliance Data Sys Corp
COMPUTER SOFTWARE and SERVICES - Information and Delivery Service
|
$127.22
|
-0.78
-0.61% |
$128.49
|
814,198
136.27% of 50 DAV
50 DAV is 597,500
|
$130.31
-2.37%
|
1/17/2012
|
$108.24
|
PP = $107.43
|
|
MB = $112.80
|
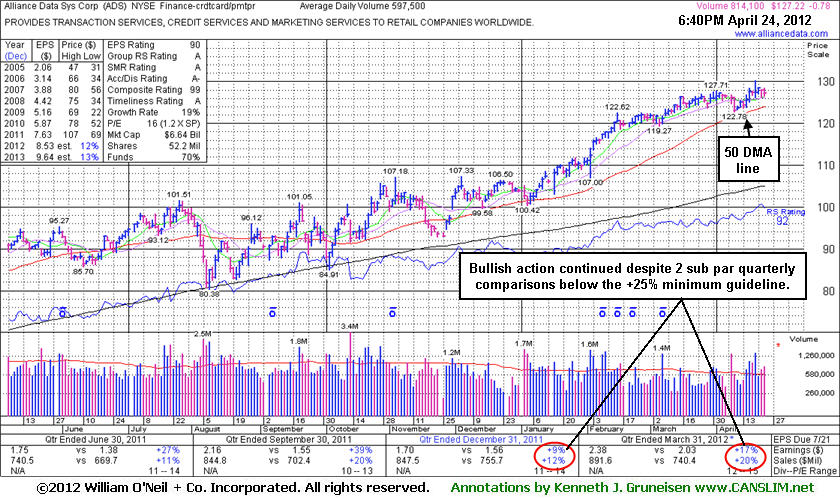
 Most Recent Note - 4/24/2012 6:58:14 PM
G - Still holding its ground near its all-time high today. Reported earnings +17% on +20% sales revenues for the quarter ended March 31, 2012 versus the year-ago period. Fundamental concerns were raised earlier by earnings reported +9%, well below the +25% minimum guideline, for the latest quarter ended December 31, 2011 versus the year-ago period. See the latest FSU analysis for more details and a new annotated graph.
>>> The latest Featured Stock Update with an annotated graph appeared on 4/24/2012. Click here.
View all notes |
Alert me of new notes |
CANSLIM.net Company Profile |
SEC |
Zacks Reports |
StockTalk |
News |
Chart |
Request a new note
C
A N
S L
I M
|
ALLT
-
NASDAQ
Allot Communications Ltd
COMPUTER SOFTWARE andamp; SERVICES - Technical andamp; System Software
|
$23.14
|
-0.31
-1.32% |
$23.72
|
160,228
34.87% of 50 DAV
50 DAV is 459,500
|
$25.36
-8.75%
|
3/13/2012
|
$19.72
|
PP = $18.91
|
|
MB = $19.86
|
Most Recent Note - 4/23/2012 11:31:47 AM
G - Down today amid widespread market weakness. There was a "negative reversal" on 4/19/12 after touching a new all-time high. Volume totals have been cooling while stubbornly holding its ground, a sign that few are exiting, while it remains perched near its 52-week high. Its latest consolidation has been brief, yet it may be forming an advanced "3-weeks tight" base well above its 50 DMA line and prior highs near $18-19 that define support to watch on pullbacks.
>>> The latest Featured Stock Update with an annotated graph appeared on 3/19/2012. Click here.
View all notes |
Alert me of new notes |
CANSLIM.net Company Profile |
SEC |
Zacks Reports |
StockTalk |
News |
Chart |
Request a new note
C
A N
S L
I M
|
ALXN
-
NASDAQ
Alexion Pharmaceuticals
DRUGS - Drug Manufacturers - Other
|
$88.90
|
-3.04
-3.31% |
$93.97
|
2,273,584
182.98% of 50 DAV
50 DAV is 1,242,500
|
$95.01
-6.43%
|
3/12/2012
|
$87.87
|
PP = $87.73
|
|
MB = $92.12
|
Most Recent Note - 4/24/2012 12:00:40 PM
G - Gapped up today but then reversed into the red. Recently found support at its 50 DMA line, and it is now consolidating above that important short-term average, possibly building a new late-stage base.
>>> The latest Featured Stock Update with an annotated graph appeared on 4/16/2012. Click here.
View all notes |
Alert me of new notes |
CANSLIM.net Company Profile |
SEC |
Zacks Reports |
StockTalk |
News |
Chart |
Request a new note
C
A N
S L
I M
|
BODY
-
NASDAQ
Body Central Corp
RETAIL - Catalog andamp; Mail Order Houses
|
$27.44
|
-0.02
-0.07% |
$27.53
|
229,687
117.19% of 50 DAV
50 DAV is 196,000
|
$29.49
-6.95%
|
4/18/2012
|
$27.44
|
PP = $29.59
|
|
MB = $31.07
|
Most Recent Note - 4/18/2012 1:41:04 PM
Y - Hovering near its 50 DMA line today, finding support near that important short-term average. Color code is changed to yellow with new pivot point cited based on its 52-week high plus 10 cents. Volume-driven gains above the pivot point may trigger a new (or add-on) technical buy signal. Subsequent damaging losses below its recent lows would raise more serious concerns and trigger additional sell signals.
>>> The latest Featured Stock Update with an annotated graph appeared on 3/13/2012. Click here.
View all notes |
Alert me of new notes |
CANSLIM.net Company Profile |
SEC |
Zacks Reports |
StockTalk |
News |
Chart |
Request a new note
C
A N
S L
I M
|
Symbol/Exchange
Company Name
Industry Group |
PRICE |
CHANGE
(%Change) |
Day High |
Volume
(% DAV)
(% 50 day avg vol) |
52 Wk Hi
% From Hi |
Featured
Date |
Price
Featured |
Pivot Featured |
|
Max Buy |
CDNS
-
NASDAQ
Cadence Design Systems
COMPUTER SOFTWARE and SERVICES - Technical and System Software
|
$11.28
|
-0.07
-0.62% |
$11.39
|
2,180,739
77.43% of 50 DAV
50 DAV is 2,816,400
|
$12.60
-10.48%
|
2/3/2012
|
$11.66
|
PP = $11.15
|
|
MB = $11.71
|
Most Recent Note - 4/18/2012 1:42:38 PM
G - Still lingering below its 50 DMA line which may now act as resistance. Last week's low ($11.20 on 4/10/12) defines important near-term support level above its 200 DMA line.
>>> The latest Featured Stock Update with an annotated graph appeared on 3/28/2012. Click here.
View all notes |
Alert me of new notes |
CANSLIM.net Company Profile |
SEC |
Zacks Reports |
StockTalk |
News |
Chart |
Request a new note
C
A N
S L
I M
|
CELG
-
NASDAQ
Celgene Corp
DRUGS - Drug Manufacturers - Major
|
$77.35
|
-0.08
-0.10% |
$78.18
|
2,539,869
94.63% of 50 DAV
50 DAV is 2,683,900
|
$80.42
-3.82%
|
2/2/2012
|
$74.16
|
PP = $75.21
|
|
MB = $78.97
|
Most Recent Note - 4/18/2012 1:45:31 PM
G - Volume totals have been cooling while still stubbornly holding its ground and dipping below its "max buy" level briefly during the past week. Its 50 DMA line defines important support to watch.
>>> The latest Featured Stock Update with an annotated graph appeared on 3/26/2012. Click here.
View all notes |
Alert me of new notes |
CANSLIM.net Company Profile |
SEC |
Zacks Reports |
StockTalk |
News |
Chart |
Request a new note
C
A N
S L
I M
|
COO
-
NYSE
Cooper Companies Inc
HEALTH SERVICES - Medical Instruments and Supplies
|
$85.63
|
+0.35
0.41% |
$85.89
|
363,977
84.55% of 50 DAV
50 DAV is 430,500
|
$87.18
-1.78%
|
3/9/2012
|
$83.05
|
PP = $81.02
|
|
MB = $85.07
|
Most Recent Note - 4/18/2012 1:51:04 PM
Y - Inching higher today with below average volume, trading at its 52-week high and near its "max buy" level. Wedging higher with no resistance remaining, but not showing signs of institutional accumulation since its big 4/05/12 gain on high volume. Its Relative Strength rating has improved to 84 now, better than the 80+ guideline for buy candidates.
>>> The latest Featured Stock Update with an annotated graph appeared on 3/9/2012. Click here.
View all notes |
Alert me of new notes |
CANSLIM.net Company Profile |
SEC |
Zacks Reports |
StockTalk |
News |
Chart |
Request a new note
C
A N
S L
I M
|
DISH
-
NASDAQ
Dish Network Corp Cl A
CONSUMER DURABLES - Electronic Equipment
|
$30.97
|
-0.15
-0.48% |
$31.24
|
1,063,588
41.30% of 50 DAV
50 DAV is 2,575,300
|
$35.64
-13.10%
|
3/7/2012
|
$30.83
|
PP = $30.10
|
|
MB = $31.61
|
Most Recent Note - 4/18/2012 1:27:09 PM
G - Violated its 50 DMA line and slumping near its pivot point with a damaging loss today on above average volume raising concerns. A prompt show of support near that important short-term average would help its outlook, but a weak finish and further deterioration would raise more serious concerns.
>>> The latest Featured Stock Update with an annotated graph appeared on 3/14/2012. Click here.
View all notes |
Alert me of new notes |
CANSLIM.net Company Profile |
SEC |
Zacks Reports |
StockTalk |
News |
Chart |
Request a new note
C
A N
S L
I M
|
FEIC
-
NASDAQ
F E I Co
ELECTRONICS - Diversified Electronics
|
$46.49
|
+0.26
0.56% |
$46.89
|
203,992
66.82% of 50 DAV
50 DAV is 305,300
|
$49.92
-6.87%
|
12/7/2011
|
$41.41
|
PP = $42.35
|
|
MB = $44.47
|
Most Recent Note - 4/18/2012 2:04:49 PM
G - Volume totals have been cooling while consolidating above its 50 DMA line. The latest quarterly report showed +21% earnings for the Dec '11 quarter, below the +25% minimum guideline for earnings growth.
>>> The latest Featured Stock Update with an annotated graph appeared on 3/12/2012. Click here.
View all notes |
Alert me of new notes |
CANSLIM.net Company Profile |
SEC |
Zacks Reports |
StockTalk |
News |
Chart |
Request a new note
C
A N
S L
I M
|
Symbol/Exchange
Company Name
Industry Group |
PRICE |
CHANGE
(%Change) |
Day High |
Volume
(% DAV)
(% 50 day avg vol) |
52 Wk Hi
% From Hi |
Featured
Date |
Price
Featured |
Pivot Featured |
|
Max Buy |
GNC
-
NYSE
G N C Holdings Inc
RETAIL - Drug Stores
|
$35.48
|
-0.67
-1.85% |
$36.41
|
3,365,260
202.19% of 50 DAV
50 DAV is 1,664,400
|
$36.30
-2.26%
|
1/19/2012
|
$28.99
|
PP = $29.60
|
|
MB = $31.08
|
Most Recent Note - 4/24/2012 7:00:49 PM
G - Touched a new all-time high then reversed into the red for a loss today on higher volume, a negative reversal after inching higher for 5 consecutive small gains. It has shown bullish action in recent weeks but did not form a sound new base pattern. It completed Secondary Offerings on 10/25/11 and 3/13/12 after making steady progress following its 4/01/11 IPO.
>>> The latest Featured Stock Update with an annotated graph appeared on 3/5/2012. Click here.
View all notes |
Alert me of new notes |
CANSLIM.net Company Profile |
SEC |
Zacks Reports |
StockTalk |
News |
Chart |
Request a new note
C
A N
S L
I M
|
HLF
-
NYSE
Herbalife Ltd
DRUGS - Nutrition and Weight Management
|
$69.10
|
-3.59
-4.94% |
$72.96
|
3,168,954
227.70% of 50 DAV
50 DAV is 1,391,700
|
$73.00
-5.34%
|
4/18/2012
|
$71.19
|
PP = $72.21
|
|
MB = $75.82
|
Most Recent Note - 4/24/2012 2:13:52 PM
Y - Pulling back with a considerable loss today and churning above average volume this week without making meaningful price progress above prior highs. Volume-driven gains for new highs did not trigger a proper new (or add-on) technical buy signal. Consolidating above its 50 DMA line, important support to watch.
>>> The latest Featured Stock Update with an annotated graph appeared on 4/13/2012. Click here.
View all notes |
Alert me of new notes |
CANSLIM.net Company Profile |
SEC |
Zacks Reports |
StockTalk |
News |
Chart |
Request a new note
C
A N
S L
I M
|
ISRG
-
NASDAQ
Intuitive Surgical Inc
HEALTH SERVICES - Medical Appliances and Equipment
|
$560.11
|
-7.33
-1.29% |
$570.60
|
244,219
82.23% of 50 DAV
50 DAV is 297,000
|
$594.89
-5.85%
|
12/20/2011
|
$442.43
|
PP = $449.16
|
|
MB = $471.62
|
Most Recent Note - 4/20/2012 12:13:37 PM
G - Holding its ground following a considerable gap up gain on 4/18/12. It may produce more climactic gains, however it has not spent much time basing since its last "Featured Date" when highlighted in yellow on 12/23/11. Disciplined investors always limit losses if any stock falls -7% from their purchase price. It is on track for a 10th consecutive weekly gain.
>>> The latest Featured Stock Update with an annotated graph appeared on 3/1/2012. Click here.
View all notes |
Alert me of new notes |
CANSLIM.net Company Profile |
SEC |
Zacks Reports |
StockTalk |
News |
Chart |
Request a new note
C
A N
S L
I M
|
LULU
-
NASDAQ
Lululemon Athletica
MANUFACTURING - Textile Manufacturing
|
$70.18
|
-3.64
-4.93% |
$73.93
|
2,596,194
132.09% of 50 DAV
50 DAV is 1,965,500
|
$77.13
-9.01%
|
1/10/2012
|
$60.97
|
PP = $59.46
|
|
MB = $62.43
|
Most Recent Note - 4/24/2012 2:06:21 PM
G - Raising concerns with yet another distribution day, it violated its 50 DMA line with today's loss on higher volume. Only a prompt rebound above its short-term average would help its outlook.
>>> The latest Featured Stock Update with an annotated graph appeared on 4/12/2012. Click here.
View all notes |
Alert me of new notes |
CANSLIM.net Company Profile |
SEC |
Zacks Reports |
StockTalk |
News |
Chart |
Request a new note
C
A N
S L
I M
|
MA
-
NYSE
Mastercard Inc Cl A
DIVERSIFIED SERVICES - Business/Management Services
|
$430.30
|
+0.04
0.01% |
$435.87
|
652,403
79.79% of 50 DAV
50 DAV is 817,600
|
$443.80
-3.04%
|
3/12/2012
|
$419.86
|
PP = $428.67
|
|
MB = $450.10
|
Most Recent Note - 4/23/2012 12:32:01 PM
Y - Considerable loss today, and at its earlier low it tested its 50 DMA line which defines important near-term support to watch.
>>> The latest Featured Stock Update with an annotated graph appeared on 4/11/2012. Click here.
View all notes |
Alert me of new notes |
CANSLIM.net Company Profile |
SEC |
Zacks Reports |
StockTalk |
News |
Chart |
Request a new note
C
A N
S L
I M
|
Symbol/Exchange
Company Name
Industry Group |
PRICE |
CHANGE
(%Change) |
Day High |
Volume
(% DAV)
(% 50 day avg vol) |
52 Wk Hi
% From Hi |
Featured
Date |
Price
Featured |
Pivot Featured |
|
Max Buy |
MELI
-
NASDAQ
Mercadolibre Inc
INTERNET - Internet Software and; Services
|
$88.07
|
-0.55
-0.62% |
$89.09
|
325,043
65.99% of 50 DAV
50 DAV is 492,600
|
$104.50
-15.72%
|
2/6/2012
|
$97.09
|
PP = $95.58
|
|
MB = $100.36
|
Most Recent Note - 4/23/2012 11:28:47 AM
G - Down today, slumping further below its 50 DMA line follow 3 consecutive weekly losses. It now faces resistance due to overhead supply up through the $104 level that will hinder its progress.
>>> The latest Featured Stock Update with an annotated graph appeared on 3/29/2012. Click here.
View all notes |
Alert me of new notes |
CANSLIM.net Company Profile |
SEC |
Zacks Reports |
StockTalk |
News |
Chart |
Request a new note
C
A N
S L
I M
|
MG
-
NYSE
Mistras Group Inc
DIVERSIFIED SERVICES - Bulding and Faci;ity Management Services
|
$23.31
|
+0.13
0.56% |
$23.36
|
70,726
69.27% of 50 DAV
50 DAV is 102,100
|
$26.24
-11.17%
|
3/22/2012
|
$24.96
|
PP = $26.34
|
|
MB = $27.66
|
Most Recent Note - 4/20/2012 1:38:13 PM
G - Gain today has it rebounding above its 50 DMA line. A volume-driven gain above its recent chart high ($25.49 on 3/21/12) may help trigger a proper technical buy signal after a new base formation, however no new (lower) pivot point is currently being cited, and it may continue encountering stubborn resistance.
>>> The latest Featured Stock Update with an annotated graph appeared on 4/2/2012. Click here.
View all notes |
Alert me of new notes |
CANSLIM.net Company Profile |
SEC |
Zacks Reports |
StockTalk |
News |
Chart |
Request a new note
C
A N
S L
I M
|
MKTX
-
NASDAQ
Marketaxess Holdings Inc
FINANCIAL SERVICES - Investment Brokerage - Nationa
|
$36.05
|
+0.30
0.84% |
$36.56
|
136,267
43.75% of 50 DAV
50 DAV is 311,500
|
$37.95
-5.01%
|
3/8/2012
|
$35.80
|
PP = $35.52
|
|
MB = $37.30
|
Most Recent Note - 4/20/2012 1:40:58 PM
Y - Color code was changed to yellow based on its impressive resilience. Volume totals have been cooling since it rebounded above its 50 DMA line after a brief intra-day violation on 4/12/12.
>>> The latest Featured Stock Update with an annotated graph appeared on 3/8/2012. Click here.
View all notes |
Alert me of new notes |
CANSLIM.net Company Profile |
SEC |
Zacks Reports |
StockTalk |
News |
Chart |
Request a new note
C
A N
S L
I M
|
NTES
-
NASDAQ
Netease Inc Adr
INTERNET - Internet Information Providers
|
$58.14
|
-0.52
-0.89% |
$58.78
|
540,976
77.01% of 50 DAV
50 DAV is 702,500
|
$60.50
-3.90%
|
3/19/2012
|
$56.18
|
PP = $55.10
|
|
MB = $57.86
|
Most Recent Note - 4/23/2012 2:53:14 PM
G - Consolidating just above its "max buy" level and its color code is changed to green. Recent lows and prior highs in the $55 area define important near-term chart support to watch above its 50 DMA line.
>>> The latest Featured Stock Update with an annotated graph appeared on 3/27/2012. Click here.
View all notes |
Alert me of new notes |
CANSLIM.net Company Profile |
SEC |
Zacks Reports |
StockTalk |
News |
Chart |
Request a new note
C
A N
S L
I M
|
RAX
-
NYSE
Rackspace Hosting Inc
INTERNET - Internet Software and; Services
|
$53.45
|
-1.59
-2.89% |
$54.94
|
1,813,093
92.02% of 50 DAV
50 DAV is 1,970,300
|
$60.00
-10.92%
|
2/2/2012
|
$46.69
|
PP = $45.55
|
|
MB = $47.83
|
Most Recent Note - 4/24/2012 2:16:49 PM
G - Down again today and slumping below its 50 DMA line after triggering a technical sell signal with a damaging loss. Only a prompt rebound above that short-term average would help its outlook.
>>> The latest Featured Stock Update with an annotated graph appeared on 4/10/2012. Click here.
View all notes |
Alert me of new notes |
CANSLIM.net Company Profile |
SEC |
Zacks Reports |
StockTalk |
News |
Chart |
Request a new note
C
A N
S L
I M
|
Symbol/Exchange
Company Name
Industry Group |
PRICE |
CHANGE
(%Change) |
Day High |
Volume
(% DAV)
(% 50 day avg vol) |
52 Wk Hi
% From Hi |
Featured
Date |
Price
Featured |
Pivot Featured |
|
Max Buy |
RGR
-
NYSE
Sturm Ruger & Co Inc
CONSUMER DURABLES - Sporting Goods
|
$53.25
|
-0.18
-0.34% |
$54.59
|
585,618
148.07% of 50 DAV
50 DAV is 395,500
|
$53.75
-0.93%
|
3/22/2012
|
$46.49
|
PP = $46.78
|
|
MB = $49.12
|
Most Recent Note - 4/23/2012 12:47:12 PM
G - Holding its ground at its 52-week high today following 4 consecutive gains. It is extended from any sound base. Found prompt support after a pullback near its prior high in the $46 area previously noted as support to watch above its 50 DMA line.
>>> The latest Featured Stock Update with an annotated graph appeared on 3/22/2012. Click here.
View all notes |
Alert me of new notes |
CANSLIM.net Company Profile |
SEC |
Zacks Reports |
StockTalk |
News |
Chart |
Request a new note
C
A N
S L
I M
|
RRTS
-
NYSE
Roadrunner Trans Systems
TRANSPORTATION - Air Delivery and Freight Service
|
$16.90
|
-0.24
-1.40% |
$17.19
|
100,372
94.51% of 50 DAV
50 DAV is 106,200
|
$18.59
-9.09%
|
2/10/2012
|
$17.40
|
PP = $17.50
|
|
MB = $18.38
|
Most Recent Note - 4/24/2012 4:47:46 PM
G - Down today with higher (near average) volume. Its 50 DMA line acted as resistance when it rebounded from its latest lows. After finding recent support, any subsequent deterioration below the prior low ($16.65 on 4/10/12) would raise more serious concerns and trigger more worrisome sell signals.
>>> The latest Featured Stock Update with an annotated graph appeared on 4/9/2012. Click here.
View all notes |
Alert me of new notes |
CANSLIM.net Company Profile |
SEC |
Zacks Reports |
StockTalk |
News |
Chart |
Request a new note
C
A N
S L
I M
|
SHFL
-
NASDAQ
Shuffle Master Inc
MANUFACTURING - Diversified Machinery
|
$16.57
|
-0.32
-1.89% |
$17.07
|
514,895
77.92% of 50 DAV
50 DAV is 660,800
|
$18.77
-11.72%
|
3/6/2012
|
$17.07
|
PP = $15.25
|
|
MB = $16.01
|
Most Recent Note - 4/24/2012 4:44:45 PM
G - Consolidating just above its 50 DMA line. Its prior low ($16.14 on 4/10/12) and its short-term average define important near-term chart support to watch. It is -11.7% off its 52-week high today, extended from any sound base pattern.
>>> The latest Featured Stock Update with an annotated graph appeared on 3/15/2012. Click here.
View all notes |
Alert me of new notes |
CANSLIM.net Company Profile |
SEC |
Zacks Reports |
StockTalk |
News |
Chart |
Request a new note
C
A N
S L
I M
|
SXCI
-
NASDAQ
S X C Health Solutions
COMPUTER SOFTWARE and SERVICES - Healthcare Information Service
|
$91.64
|
-1.42
-1.53% |
$93.22
|
1,149,724
135.06% of 50 DAV
50 DAV is 851,300
|
$100.50
-8.82%
|
2/23/2012
|
$68.24
|
PP = $66.05
|
|
MB = $69.35
|
Most Recent Note - 4/23/2012 2:44:55 PM
G - Perched near its all-time high today, very extended from its prior base. The market cheered the 4/18/12 news it will acquire and merge with Catalyst Health Solutions Inc (CHSI), rallying with volume-driven gains.
>>> The latest Featured Stock Update with an annotated graph appeared on 3/6/2012. Click here.
View all notes |
Alert me of new notes |
CANSLIM.net Company Profile |
SEC |
Zacks Reports |
StockTalk |
News |
Chart |
Request a new note
C
A N
S L
I M
|
TDG
-
NYSE
Transdigm Group Inc
AEROSPACE/DEFENSE - Aerospace/Defense Products and; Services
|
$121.73
|
-0.27
-0.22% |
$122.10
|
277,769
67.98% of 50 DAV
50 DAV is 408,600
|
$123.39
-1.35%
|
2/29/2012
|
$120.10
|
PP = $118.93
|
|
MB = $124.88
|
Most Recent Note - 4/23/2012 2:49:55 PM
Y - Pulling back today. On the prior session it hit new 52-week and all-time highs with +75% above average volume, meeting the guideline for a proper technical buy signal. The encouraging sign of fresh institutional buying demand may signal the beginning of a meaningful leg up, but keep in mind 3 out of 4 stocks follow the direction of the major averages (M criteria) and the market has recently been pulling back under distributional pressure. Subsequent deterioration below its 50 DMA line or prior lows ($110.60 on 3/20/12) would trigger more worrisome technical sell signals.
>>> The latest Featured Stock Update with an annotated graph appeared on 3/30/2012. Click here.
View all notes |
Alert me of new notes |
CANSLIM.net Company Profile |
SEC |
Zacks Reports |
StockTalk |
News |
Chart |
Request a new note
C
A N
S L
I M
|
Symbol/Exchange
Company Name
Industry Group |
PRICE |
CHANGE
(%Change) |
Day High |
Volume
(% DAV)
(% 50 day avg vol) |
52 Wk Hi
% From Hi |
Featured
Date |
Price
Featured |
Pivot Featured |
|
Max Buy |
TIBX
-
NASDAQ
Tibco Software Inc
COMPUTER SOFTWARE and SERVICES - Business Software and Services
|
$31.54
|
-1.36
-4.13% |
$32.88
|
4,603,487
163.21% of 50 DAV
50 DAV is 2,820,600
|
$34.67
-9.03%
|
3/30/2012
|
$31.01
|
PP = $31.25
|
|
MB = $32.81
|
Most Recent Note - 4/24/2012 4:06:24 PM
G - Sank near its pivot point and closed near the session low with above average volume behind today's 4th consecutive loss. Raised concerns as it violated the previously noted upward trendline connecting its December, March, and April lows triggering an early sell signal. Important support to watch is at prior highs in the $31 area and its 50 DMA line where more damaging losses would raise serious concerns.
>>> The latest Featured Stock Update with an annotated graph appeared on 4/5/2012. Click here.
View all notes |
Alert me of new notes |
CANSLIM.net Company Profile |
SEC |
Zacks Reports |
StockTalk |
News |
Chart |
Request a new note
C
A N
S L
I M
|
TNGO
-
NASDAQ
Tangoe Inc
COMPUTER SOFTWARE and SERVICES - Technical and System Software
|
$19.53
|
-0.11
-0.56% |
$20.71
|
370,643
55.26% of 50 DAV
50 DAV is 670,700
|
$21.74
-10.17%
|
3/27/2012
|
$19.35
|
PP = $20.00
|
|
MB = $21.00
|
Most Recent Note - 4/23/2012 11:39:14 AM
Y - Today's 2nd consecutive loss amid a mostly negative market has negated the recent breakout with it slumping under prior highs in the $20 area previously noted as initial support to watch on pullbacks. The 50 DMA line ($18.38) is the next important support level to watch.
>>> The latest Featured Stock Update with an annotated graph appeared on 4/3/2012. Click here.
View all notes |
Alert me of new notes |
CANSLIM.net Company Profile |
SEC |
Zacks Reports |
StockTalk |
News |
Chart |
Request a new note
C
A N
S L
I M
|
TSCO
-
NASDAQ
Tractor Supply Co
SPECIALTY RETAIL - Specialty Retail, Other
|
$96.93
|
-2.48
-2.49% |
$99.44
|
1,020,166
139.20% of 50 DAV
50 DAV is 732,900
|
$101.20
-4.22%
|
1/12/2012
|
$79.12
|
PP = $75.58
|
|
MB = $79.36
|
Most Recent Note - 4/24/2012 4:08:07 PM
G - Loss today with higher volume indicated another day of distributional pressure. Still holding its ground near its all-time high, very extended from its prior base. Its 50 DMA line defines support to watch on pullbacks.
>>> The latest Featured Stock Update with an annotated graph appeared on 4/17/2012. Click here.
View all notes |
Alert me of new notes |
CANSLIM.net Company Profile |
SEC |
Zacks Reports |
StockTalk |
News |
Chart |
Request a new note
C
A N
S L
I M
|
UA
-
NYSE
Under Armour Inc Cl A
CONSUMER NON-DURABLES - Textile - Apparel Clothing
|
$95.34
|
-5.11
-5.09% |
$100.74
|
1,651,598
168.84% of 50 DAV
50 DAV is 978,200
|
$102.86
-7.31%
|
2/15/2012
|
$85.77
|
PP = $84.86
|
|
MB = $89.10
|
Most Recent Note - 4/24/2012 12:36:11 PM
G - Slumping under prior highs with a loss today. No overhead supply remains to act as resistance, however no new pivot point was cited following its latest base. Concerns were raised by weaker fundamentals. Reported earnings +22% on +23% sales revenues for the quarter ended March 31, 2012 versus the year ago period, its first quarterly earnings increase below the +25% minimum guideline in more than 2 years.
>>> The latest Featured Stock Update with an annotated graph appeared on 4/4/2012. Click here.
View all notes |
Alert me of new notes |
CANSLIM.net Company Profile |
SEC |
Zacks Reports |
StockTalk |
News |
Chart |
Request a new note
C
A N
S L
I M
|
UBNT
-
NASDAQ
Ubiquiti Networks Inc
TELECOMMUNICATIONS - Diversified Communication Serv
|
$32.19
|
+0.32
1.00% |
$32.58
|
195,707
55.93% of 50 DAV
50 DAV is 349,900
|
$35.32
-8.86%
|
4/12/2012
|
$33.89
|
PP = $34.07
|
|
MB = $35.77
|
Most Recent Note - 4/23/2012 2:33:14 PM
Y - Still pulling back from its all-time high. Formed an advanced "ascending base" pattern marked by 3 pullbacks of 10-20% following its previous breakout. Prior low ($30.25 on 4/09/12) defines initial support above its 50 DMA line.
>>> The latest Featured Stock Update with an annotated graph appeared on 4/20/2012. Click here.
View all notes |
Alert me of new notes |
CANSLIM.net Company Profile |
SEC |
Zacks Reports |
StockTalk |
News |
Chart |
Request a new note
C
A N
S L
I M
|
Symbol/Exchange
Company Name
Industry Group |
PRICE |
CHANGE
(%Change) |
Day High |
Volume
(% DAV)
(% 50 day avg vol) |
52 Wk Hi
% From Hi |
Featured
Date |
Price
Featured |
Pivot Featured |
|
Max Buy |
ULTA
-
NASDAQ
Ulta Salon Cosm & Frag
SPECIALTY RETAIL - Specialty Retail, Other
|
$87.15
|
-6.38
-6.82% |
$93.71
|
2,535,688
391.25% of 50 DAV
50 DAV is 648,100
|
$96.65
-9.83%
|
1/11/2012
|
$71.97
|
PP = $75.80
|
|
MB = $79.59
|
Most Recent Note - 4/24/2012 1:59:49 PM
G - Violated its 50 DMA line with heavy volume behind a damaging loss today raising concerns. Prior highs in the $75 area are the next important support level to watch. See the latest FSU analysis for more details and a new annotated graph.
>>> The latest Featured Stock Update with an annotated graph appeared on 4/23/2012. Click here.
View all notes |
Alert me of new notes |
CANSLIM.net Company Profile |
SEC |
Zacks Reports |
StockTalk |
News |
Chart |
Request a new note
C
A N
S L
I M
|
V
-
NYSE
Visa Inc Cl A
DIVERSIFIED SERVICES - Business/Management Services
|
$118.93
|
+0.83
0.70% |
$119.24
|
2,358,426
71.94% of 50 DAV
50 DAV is 3,278,100
|
$123.68
-3.84%
|
3/12/2012
|
$116.53
|
PP = $119.46
|
|
MB = $125.43
|
Most Recent Note - 4/23/2012 2:37:54 PM
Y - Dipped below its 50 DMA line earlier in the session and volume is running at an above average pace today while on track for its 4th consecutive loss. Sputtering since its 4/13/12 gain backed by +49% above average volume technically confirmed a buy signal. Its 50 DMA line defines support to watch well above prior highs in the $103-104 area.
>>> The latest Featured Stock Update with an annotated graph appeared on 3/7/2012. Click here.
View all notes |
Alert me of new notes |
CANSLIM.net Company Profile |
SEC |
Zacks Reports |
StockTalk |
News |
Chart |
Request a new note
C
A N
S L
I M
|
VMW
-
NYSE
Vmware Inc Cl A
COMPUTER SOFTWARE andamp; SERVICES - Technical andamp; System Software
|
$103.48
|
-4.04
-3.76% |
$107.90
|
3,162,744
207.01% of 50 DAV
50 DAV is 1,527,800
|
$118.79
-12.89%
|
4/18/2012
|
$110.04
|
PP = $115.29
|
|
MB = $121.05
|
Most Recent Note - 4/24/2012 2:08:54 PM
G - Violated its 50 DMA line with today's loss, raising concerns. Its color code is changed to green based on technical deterioration. Reported +38% earnings on +25% sales revenues for the quarter ended March 31, 2012 versus the year ago period.
>>> The latest Featured Stock Update with an annotated graph appeared on 4/18/2012. Click here.
View all notes |
Alert me of new notes |
CANSLIM.net Company Profile |
SEC |
Zacks Reports |
StockTalk |
News |
Chart |
Request a new note
C
A N
S L
I M
|