You are not logged in.
This means you
CAN ONLY VIEW reports that were published prior to Monday, April 14, 2025.
You
MUST UPGRADE YOUR MEMBERSHIP if you want to see any current reports.
AFTER MARKET UPDATE - WEDNESDAY, APRIL 23RD, 2014
Previous After Market Report Next After Market Report >>>
|
|
|
|
DOW |
-12.72 |
16,501.65 |
-0.08% |
|
Volume |
648,430,510 |
-3% |
|
Volume |
1,620,321,230 |
-6% |
|
NASDAQ |
-34.49 |
4,126.97 |
-0.83% |
|
Advancers |
1,496 |
47% |
|
Advancers |
835 |
30% |
|
S&P 500 |
-4.16 |
1,875.39 |
-0.22% |
|
Decliners |
1,571 |
50% |
|
Decliners |
1,828 |
66% |
|
Russell 2000 |
-8.53 |
1,147.08 |
-0.74% |
|
52 Wk Highs |
136 |
|
|
52 Wk Highs |
39 |
|
|
S&P 600 |
-3.97 |
661.69 |
-0.60% |
|
52 Wk Lows |
5 |
|
|
52 Wk Lows |
18 |
|
|
 |
Major Averages Had Small Losses on Lighter Volume Totals
Kenneth J. Gruneisen - Passed the CAN SLIM® Master's Exam
Stocks took a breather on Wednesday's session and ended with modest losses. The volume totals were reported lighter than the prior session totals on both the NYSE and on the Nasdaq exchange. Advancers and decliners were just about evenly matched on the NYSE but decliners led advancers by a 9-4 margin on the Nasdaq exchange. There were 26 high-ranked companies from the CANSLIM.net Leaders List that made new 52-week highs and appeared on the CANSLIM.net BreakOuts Page, up a notch from the total of 25 stocks on the prior session. New 52-week highs outnumbered new 52-week lows on the NYSE and on the Nasdaq exchange. None of the 4 high-ranked companies currently included on the Featured Stocks Page posted gains. The Market (M criteria) pullback earned the label of a "correction" as a result of recent pressure on the indices. Graphs in the commentary following last Thursday's action (read here) illustrated that recent weeks have been especially tough on many stocks which were high-ranked leaders in the previous rally. This is precisely how the fact-based investment system prompts investors to reduce their overall market exposure during weak periods.
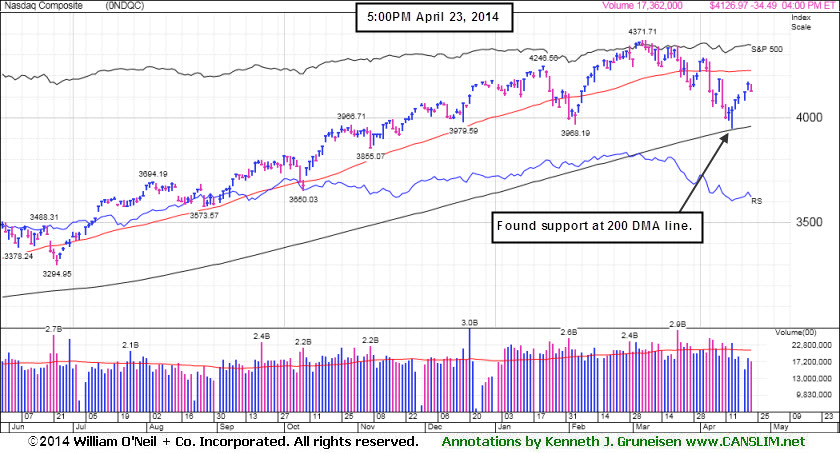
The Dow was off 12 points to 16501. The S&P 500 snapped a six-day winning streak as it declined 4 points to 1,875. The NASDAQ lost 34 points to 4,126.
The major averages retreated amid a batch of disappointing economic data. New home sales unexpectedly dropped by -14.5% in March to an eight-month low amid record prices and higher mortgage rates. Meanwhile, the preliminary reading on a U.S. manufacturing gauge surprisingly decreased to 55.4 in April from a final reading of 55.5 a month earlier. In addition, a measure of manufacturing in China contracted for the fourth consecutive month.
Overall, sectors finished mixed. Telecommunications and technology were the worst performing groups. AT&T (T -3.78%) as phone installment plans weighed on the company's profit outlook. Apple (AAPL -1.31%) and Facebook (FB -2.65%) fell a head of their earnings reports after the close. Gains in energy and industrials helped limit losses. EOG Resources (EOG +2.68%) and Boeing (BA +2.41%) rose after posting quarterly earnings and revenue above analyst expectations.
Treasuries rose and a government auction of five-year notes received stronger-than-average demand. The 10-year note was up 6/32 to yield 2.69%. The 30-year bond gained half of a point to yield 3.47%.
To shift the market stance (M criteria) back to a "confirmed uptrend" requires a solid follow-through day or one or more of the major indices rallying to new high territory. Keep in mind that any sustained and meaningful market advance requires a healthy crop of stocks hitting new highs. The CANSLIM.net Featured Stocks Page shows the most action-worthy candidates and their latest notes and a Headline Link directs members to the latest detailed analysis with data-packed graphs annotated by a Certified expert along with links to additional resources. The Premium Member Homepage includes "dynamic archives" to all prior pay reports published. Watch for an announcement via email concerning the next WEBCAST.
PICTURED: The Nasdaq Composite Index recently found support at its 200-day moving average (DMA) line and near prior lows.
|
 Kenneth J. Gruneisen started out as a licensed stockbroker in August 1987, a couple of months prior to the historic stock market crash that took the Dow Jones Industrial Average down -22.6% in a single day. He has published daily fact-based fundamental and technical analysis on high-ranked stocks online for two decades. Through FACTBASEDINVESTING.COM, Kenneth provides educational articles, news, market commentary, and other information regarding proven investment systems that work in good times and bad.
Comments contained in the body of this report are technical opinions only and are not necessarily those of Gruneisen Growth Corp. The material herein has been obtained from sources believed to be reliable and accurate, however, its accuracy and completeness cannot be guaranteed. Our firm, employees, and customers may effect transactions, including transactions contrary to any recommendation herein, or have positions in the securities mentioned herein or options with respect thereto. Any recommendation contained in this report may not be suitable for all investors and it is not to be deemed an offer or solicitation on our part with respect to the purchase or sale of any securities. |
|
 |
Gold & Silver Index Led Gainers While Most Groups Pulled Back
Kenneth J. Gruneisen - Passed the CAN SLIM® Master's Exam
The Retail Index ($RLX -1.00%) was a negative influence on the major averages and the Broker/Dealer Index ($XBD -0.61%) edged lower while the Bank Index ($BKX +0.50%) posted a small gain. The Biotechnology Index ($BTK -1.63%) led the tech sector's retreat while the Networking Index ($NWX -0.49%) suffered a smaller loss and the Semiconductor Index ($SOX -0.12%) edged lower. The Oil Services Index ($OSX +0.40%) posted a small gain. The Gold & Silver Index ($XAU +2.01%) was a standout gainer.
Charts courtesy www.stockcharts.com
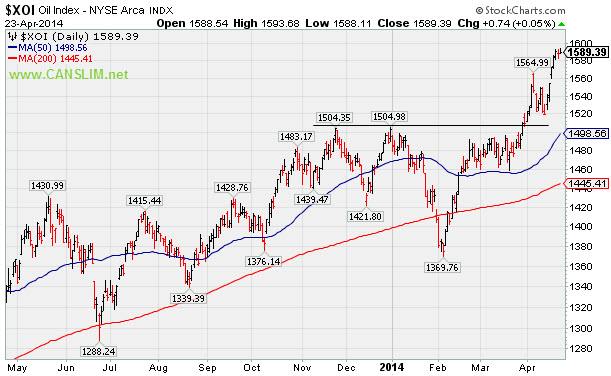
PICTURED: The Integrated Oil Index ($XOI +0.05%) finished flat, yet it has distanced itself from prior highs after rallying considerably in April.
| Oil Services |
$OSX |
301.49 |
+1.21 |
+0.40% |
+7.28% |
| Integrated Oil |
$XOI |
1,589.39 |
+0.74 |
+0.05% |
+5.74% |
| Semiconductor |
$SOX |
588.43 |
-0.68 |
-0.12% |
+9.98% |
| Networking |
$NWX |
336.29 |
-1.66 |
-0.49% |
+3.81% |
| Broker/Dealer |
$XBD |
156.02 |
-0.96 |
-0.61% |
-2.83% |
| Retail |
$RLX |
871.86 |
-8.79 |
-1.00% |
-7.23% |
| Gold & Silver |
$XAU |
92.88 |
+1.83 |
+2.01% |
+10.37% |
| Bank |
$BKX |
69.86 |
+0.35 |
+0.50% |
+0.87% |
| Biotech |
$BTK |
2,509.92 |
-41.52 |
-1.63% |
+7.70% |
|
|
|
 |
Submit Your Request for a Featured Stock Update
Kenneth J. Gruneisen - Passed the CAN SLIM® Master's Exam
Market conditions (the M criteria) are challenging at times. There are few stocks included on the Featured Stocks list and none of the companies need additional review in detail with annotated graphs. At times like these we have an opportunity to look back and review previously featured stocks which were dropped. This can serve as an educational review of the investment system's tactics. It is also a reminder that high-ranked leaders eventually fall out of favor. If you wish to request for a specific stock to receive more detailed coverage in this section please use the inquiry form to submit your request. Thank you! |
|
|
Color Codes Explained :
Y - Better candidates highlighted by our
staff of experts.
G - Previously featured
in past reports as yellow but may no longer be buyable under the
guidelines.
***Last / Change / Volume data in this table is the closing quote data***
Symbol/Exchange
Company Name
Industry Group |
PRICE |
CHANGE
(%Change) |
Day High |
Volume
(% DAV)
(% 50 day avg vol) |
52 Wk Hi
% From Hi |
Featured
Date |
Price
Featured |
Pivot Featured |
|
Max Buy |
EQM
-
NYSE
E Q T Midstream Partners
ENERGY - Oil and Gas Pipelines
|
$75.76
|
-0.76
-0.99% |
$77.77
|
118,121
103.61% of 50 DAV
50 DAV is 114,000
|
$77.73
-2.53%
|
12/12/2013
|
$53.17
|
PP = $56.51
|
|
MB = $59.34
|
Most Recent Note - 4/22/2014 5:52:58 PM
G - Rallied for yet another new all-time high today. In strong shape, technically, despite fundamental concerns recently noted. Its 50 DMA line defines near-term support where a violation may trigger a technical sell signal.
>>> FEATURED STOCK ARTICLE : Technical Strength Continues Despite Fundamental Concerns - 4/9/2014
View all notes |
Set NEW NOTE alert |
CANSLIM.net Company Profile |
SEC
News |
Chart |
Request a new note
C
A N
S L
I M


|
GNRC
-
NYSE
Generac Hldgs Inc
Electrical-Power/Equipmt
|
$58.75
|
+0.00
0.00% |
$59.86
|
580,392
79.07% of 50 DAV
50 DAV is 734,000
|
$62.50
-6.00%
|
2/14/2014
|
$56.50
|
PP = $57.39
|
|
MB = $60.26
|
Most Recent Note - 4/21/2014 5:42:02 PM
Y - Finding support near its 50 DMA line and prior highs in the $57 area recently. More damaging losses below its recent low ($55.27 on 4/14/14) would raise greater concerns.
>>> FEATURED STOCK ARTICLE : Finished Just Below its 50-Day Average Line - 4/11/2014
View all notes |
Set NEW NOTE alert |
CANSLIM.net Company Profile |
SEC
News |
Chart |
Request a new note
C
A N
S L
I M
|
ICON
-
NASDAQ
Iconix Brand Group Inc
CONSUMER NON-DURABLES - Textile - Apparel Footwear
|
$38.72
|
-0.09
-0.23% |
$39.10
|
592,306
102.65% of 50 DAV
50 DAV is 577,000
|
$42.47
-8.82%
|
3/7/2014
|
$41.46
|
PP = $40.88
|
|
MB = $42.92
|
Most Recent Note - 4/21/2014 5:39:39 PM
G - Finished near the session high with near average volume behind its gain today. Halted its slide above its 200 DMA line but recent gains came on very light volume. Its Relative Strength rating improved to 84, above the 80+ minimum rank for buy candidates under the fact-based system. A rebound above the 50 DMA line is needed to help its outlook.
>>> FEATURED STOCK ARTICLE : Violated 50-Day Average and Relative Strength Rank Fell - 4/10/2014
View all notes |
Set NEW NOTE alert |
CANSLIM.net Company Profile |
SEC
News |
Chart |
Request a new note
C
A N
S L
I M
|
PSIX
-
NASDAQ
Power Solutions Intl Inc
Machinery-Gen Industrial
|
$80.51
|
-1.65
-2.01% |
$82.32
|
80,193
123.37% of 50 DAV
50 DAV is 65,000
|
$87.40
-7.88%
|
2/28/2014
|
$74.65
|
PP = $76.93
|
|
MB = $80.78
|
Most Recent Note - 4/21/2014 5:36:49 PM
G- Rallied beyond its "max buy" level with today's 6th consecutive gain and its color code is changed to green. The recent low ($66.03 on 4/07/14) defines important near-term support below the 50 DMA line where further deterioration would raise greater concerns.
>>> FEATURED STOCK ARTICLE : Halted Slide After Slump Below 50-Day Moving Average - 4/14/2014
View all notes |
Set NEW NOTE alert |
CANSLIM.net Company Profile |
SEC
News |
Chart |
Request a new note
C
A N
S L
I M
|
|
|
|
THESE ARE NOT BUY RECOMMENDATIONS!
Comments contained in the body of this report are technical
opinions only. The material herein has been obtained
from sources believed to be reliable and accurate, however,
its accuracy and completeness cannot be guaranteed.
This site is not an investment advisor, hence it does
not endorse or recommend any securities or other investments.
Any recommendation contained in this report may not
be suitable for all investors and it is not to be deemed
an offer or solicitation on our part with respect to
the purchase or sale of any securities. All trademarks,
service marks and trade names appearing in this report
are the property of their respective owners, and are
likewise used for identification purposes only.
This report is a service available
only to active Paid Premium Members.
You may opt-out of receiving report notifications
at any time. Questions or comments may be submitted
by writing to Premium Membership Services 665 S.E. 10 Street, Suite 201 Deerfield Beach, FL 33441-5634 or by calling 1-800-965-8307
or 954-785-1121.
|
|
|

