You are not logged in.
This means you
CAN ONLY VIEW reports that were published prior to Monday, April 14, 2025.
You
MUST UPGRADE YOUR MEMBERSHIP if you want to see any current reports.
AFTER MARKET UPDATE - TUESDAY, APRIL 23RD, 2013
Previous After Market Report Next After Market Report >>>
|
|
|
|
DOW |
+152.29 |
14,719.46 |
+1.05% |
|
Volume |
683,747,660 |
+10% |
|
Volume |
1,632,436,610 |
+1% |
|
NASDAQ |
+35.78 |
3,269.33 |
+1.11% |
|
Advancers |
2,424 |
77% |
|
Advancers |
1,898 |
74% |
|
S&P 500 |
+16.28 |
1,578.78 |
+1.04% |
|
Decliners |
607 |
19% |
|
Decliners |
563 |
22% |
|
Russell 2000 |
+14.56 |
929.36 |
+1.59% |
|
52 Wk Highs |
270 |
|
|
52 Wk Highs |
126 |
|
|
S&P 600 |
+8.06 |
519.56 |
+1.58% |
|
52 Wk Lows |
18 |
|
|
52 Wk Lows |
23 |
|
|
 |
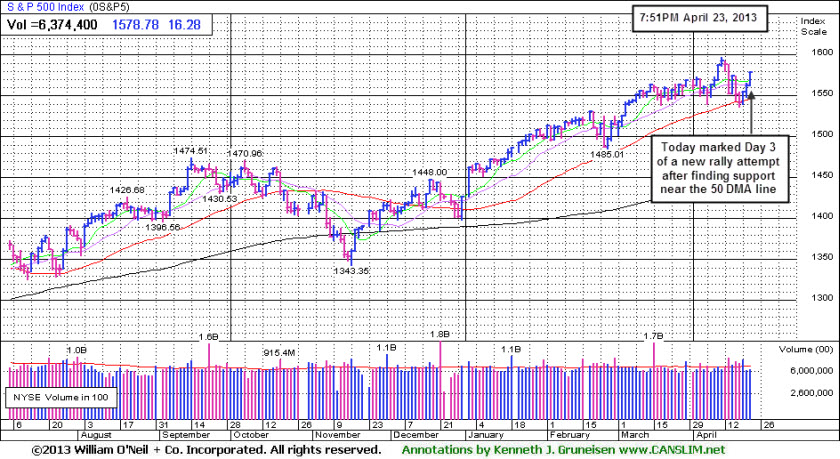
Major Averages Tallied 3rd Consecutive Gains in New Rally Attempt
Kenneth J. Gruneisen - Passed the CAN SLIM® Master's Exam
The major averages posted solid gains on Tuesday's session. The volume totals on the exchanges were reported higher than the prior session totals on the NYSE and on the Nasdaq exchange. Breadth was positive as advancers led decliners by more than a 3-1 margin on the Nasdaq exchange and by a 4-1 margin on the NYSE. New 52-week highs totals expanded and outnumbered new 52-week lows on the NYSE on the Nasdaq exchange. There were 65 high-ranked companies from the CANSLIM.net Leaders List making new 52-week highs and appearing on the CANSLIM.net BreakOuts Page, up from the prior session total of 35 stocks. There were gains for 7 of the 9 high-ranked companies currently included on the Featured Stocks Page.
The Dow Jones Industrial Average rallied 152 points to 14,719. The index briefly fell 143 points around mid-session after the Associated Press' twitter account was hacked and sent out a false news report of an attack on the White House.
Stocks rallied from the opening bell as investors responded to positive corporate earnings reports. All 10 sectors on the S&P 500 were higher, led by gains in financials including Bank of America Corp (BAC +3%) On the earnings front, Netflix Inc (NFLX +24.4%) rallied following a better-than-expected quarterly report that showed the company adding 2 million subscribers to their streaming service. Coach Inc (COH +9.8%) advanced after the luxury retailer topped analysts' estimates in the quarter and boosted their annual dividend by 13%. DuPont (DD +4.1%) and Texas Instruments (TXN +2.6%) rallied following their profit tallies.
Treasuries were lower with 10-year note down 3/32 to yield 1.70%.
The market's (M criteria) latest rally attempt is encouraging, however new buying efforts should still be avoided until there has been a follow-through day of meaningful gains (+1.4% or greater) from at least one of the major averages coupled with an expansion in leadership. That kind of bullish action is necessary to confirm that any new rally has the characteristics of institutional accumulation which have marked the beginning of most sustained market advances.
Watch for an announcement via email concerning the next WEBCAST. The webcast will also be available via an updated link highlighted at the top of the Premium Member Homepage.
PICTURED: The S&P 500 Index tallied a 3rd consecutive gain on Day 3 of a new rally attempt after finding support at its 50-day moving average (DMA) line. The window is open now for a possible follow-through-day within what has historically proven as most favorable window between Day 4-7 of a new rally attempt.
|
 Kenneth J. Gruneisen started out as a licensed stockbroker in August 1987, a couple of months prior to the historic stock market crash that took the Dow Jones Industrial Average down -22.6% in a single day. He has published daily fact-based fundamental and technical analysis on high-ranked stocks online for two decades. Through FACTBASEDINVESTING.COM, Kenneth provides educational articles, news, market commentary, and other information regarding proven investment systems that work in good times and bad.
Comments contained in the body of this report are technical opinions only and are not necessarily those of Gruneisen Growth Corp. The material herein has been obtained from sources believed to be reliable and accurate, however, its accuracy and completeness cannot be guaranteed. Our firm, employees, and customers may effect transactions, including transactions contrary to any recommendation herein, or have positions in the securities mentioned herein or options with respect thereto. Any recommendation contained in this report may not be suitable for all investors and it is not to be deemed an offer or solicitation on our part with respect to the purchase or sale of any securities. |
|
 |
Tech, Financial, Retail, Energy, and Healthcare Groups Rose
Kenneth J. Gruneisen - Passed the CAN SLIM® Master's Exam
The tech sector was led higher by the Internet Index ($IIX +2.07%) and the Semiconductor Index ($SOX +2.10%) while the Networking Index ($NWX +1.45%) and the Biotechnology Index ($BTK +1.17%) followed with smaller gains. A gain from the Retail Index ($RLX +1.13%) helped underpin the major averages' advance along with a positive bias in the influential financial groups as the Bank Index ($BKX +1.77%) and Broker/Dealer Index ($XBD +1.83%) both posted solid gains. The Healthcare Index ($HMO +1.24%) rose and energy-related shares traded up giving the Integrated Oil Index ($XOI +1.34%) and the Oil Services Index ($OSX +1.02%) both a boost. Meanwhile, the Gold & Silver Index ($XAU -1.91%) was a standout laggard as it lost ground.
Charts courtesy www.stockchart.com
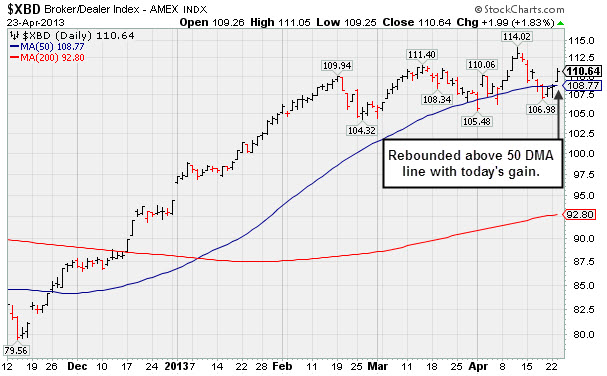
PICTURED: The Broker/Dealer Index ($XBD +1.83%) rebounded above its 50-day moving average (DMA) line with Tuesday's gain, an encouraging improvement in the technical stance of this influential financial group known as a reliable "leading indicator" for the broader market outlook.
| Oil Services |
$OSX |
241.69 |
+2.43 |
+1.02% |
+9.78% |
| Healthcare |
$HMO |
2,882.03 |
+35.30 |
+1.24% |
+14.63% |
| Integrated Oil |
$XOI |
1,315.43 |
+17.38 |
+1.34% |
+5.93% |
| Semiconductor |
$SOX |
430.21 |
+8.84 |
+2.10% |
+12.02% |
| Networking |
$NWX |
218.94 |
+3.13 |
+1.45% |
-3.36% |
| Internet |
$IIX |
359.40 |
+7.29 |
+2.07% |
+9.91% |
| Broker/Dealer |
$XBD |
110.64 |
+1.99 |
+1.83% |
+17.29% |
| Retail |
$RLX |
745.55 |
+8.32 |
+1.13% |
+14.16% |
| Gold & Silver |
$XAU |
102.30 |
-1.99 |
-1.91% |
-38.22% |
| Bank |
$BKX |
55.80 |
+0.97 |
+1.77% |
+8.81% |
| Biotech |
$BTK |
1,933.60 |
+22.32 |
+1.17% |
+24.99% |
|
|
|
 |
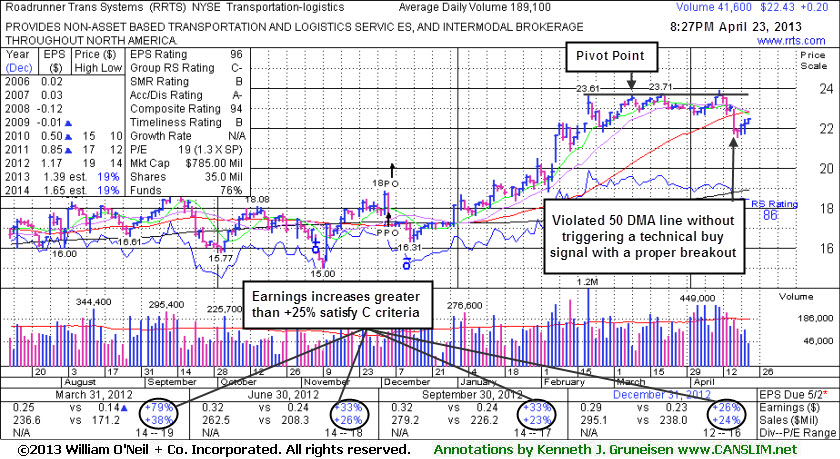
Groups' Weakness and Slump Under 50 Day Moving Average Line Hurt Stance
Kenneth J. Gruneisen - Passed the CAN SLIM® Master's Exam
Roadrunner Transportation Systems Inc (RRTS $+$0.20 or +0.90% to 22.43) recently violated the recent low and slumped below its 50-day moving average (DMA) line triggering technical sell signals. Only a prompt rebound above that important short-term average would help its outlook improve. Its last appearance in this FSU section was on 4/03/13 with an annotated graph under the headline, "Encountering Distributional Pressure While Building a New Base", after highlighted in yellow with new pivot point cited based on its 3/08/13 high plus 10 cents while consolidating in a flat base pattern in the earlier mid-day report (read here). Prior reports reminded members - "Disciplined investors may watch for a fresh technical breakout before taking action." The Transportation - Logistics group currently has seen the previously noted "mediocre (67) Relative Strength Rating slump to a more discouraging 31 rating, raising more serious concerns with respect to the L criteria. Investors' odds are most favorable when choosing stocks in groups that are showing better leadership rather than waning.
The number of top-rated funds owning its shares rose from 168 in Jun '12 to 196 in Mar '13, a reassuring sign concerning the I criteria. The company completed a new Public Offering on 12/06/12 and, technically, it broke out above previously stubborn resistance in $19 area with volume-driven gains in January. Regular readers may recall that, based on weak action, RRTS had been dropped from the Featured Stocks list on 5/18/12 following a choppy period.
It reported earnings +26% on +24% sales revenues for the quarter ended December 31, 2012 versus the year ago period, continuing its streak of quarters with earnings increases above the +25% minimum guideline (satisfying the C criteria). Fundamentals remain strong enough to still satisfy the C and A criteria, however decelerating sales revenues and earnings increases in sequential quarterly comparisons through the Dec '12 quarter are noted as a concern. It is more ideal when a company shows accelerating sales revenues and earnings increases.
Confirming volume-driven gains into new high ground from it and other leaders in the group would be a welcome reassurance to disciplined investors. But the longer it lingers below its 50 DMA line the worse its outlook gets.
|
|
|
Color Codes Explained :
Y - Better candidates highlighted by our
staff of experts.
G - Previously featured
in past reports as yellow but may no longer be buyable under the
guidelines.
***Last / Change / Volume data in this table is the closing quote data***
Symbol/Exchange
Company Name
Industry Group |
PRICE |
CHANGE
(%Change) |
Day High |
Volume
(% DAV)
(% 50 day avg vol) |
52 Wk Hi
% From Hi |
Featured
Date |
Price
Featured |
Pivot Featured |
|
Max Buy |
CELG
-
NASDAQ
Celgene Corp
DRUGS - Drug Manufacturers - Major
|
$126.00
|
-0.84
-0.66% |
$128.52
|
3,238,945
104.65% of 50 DAV
50 DAV is 3,095,000
|
$127.57
-1.23%
|
3/27/2013
|
$113.24
|
PP = $115.54
|
|
MB = $121.32
|
Most Recent Note - 4/22/2013 8:23:45 PM
G - Gapped up today and hit a new all-time high, getting more extended from any sound base. Its 50 DMA line defines important near-term support to watch.
>>> The latest Featured Stock Update with an annotated graph appeared on 4/19/2013. Click here.
View all notes |
Alert me of new notes |
CANSLIM.net Company Profile |
SEC |
Zacks Reports |
StockTalk |
News |
Chart |
Request a new note
C
A N
S L
I M


|
CMCSA
-
NASDAQ
Comcast Corp Cl A
MEDIA - CATV Systems
|
$40.90
|
+0.43
1.06% |
$40.93
|
11,956,992
83.66% of 50 DAV
50 DAV is 14,292,300
|
$42.61
-4.01%
|
12/3/2012
|
$37.08
|
PP = $38.06
|
|
MB = $39.96
|
Most Recent Note - 4/19/2013 12:11:14 PM
G - Rebounding toward its 50 DMA line today after violating that important short-term average with 2 prior losses marked by above average volume. A prompt rebound above its 50 DMA line is needed for its outlook to improve.
>>> The latest Featured Stock Update with an annotated graph appeared on 4/16/2013. Click here.
View all notes |
Alert me of new notes |
CANSLIM.net Company Profile |
SEC |
Zacks Reports |
StockTalk |
News |
Chart |
Request a new note
C
A N
S L
I M
|
FLT
-
NYSE
Fleetcor Technologies
DIVERSIFIED SERVICES - Business/Management Services
|
$77.22
|
+1.92
2.55% |
$77.34
|
1,005,852
119.74% of 50 DAV
50 DAV is 840,000
|
$78.87
-2.09%
|
3/21/2013
|
$71.14
|
PP = $73.00
|
|
MB = $76.65
|
Most Recent Note - 4/19/2013 12:17:32 PM
Y - Managed a "positive reversal" after early weakness today, making a stand near its 50 DMA line ($71.67 now). More damaging losses would raise more serious concerns and trigger a worrisome technical sell signal.
>>> The latest Featured Stock Update with an annotated graph appeared on 4/15/2013. Click here.
View all notes |
Alert me of new notes |
CANSLIM.net Company Profile |
SEC |
Zacks Reports |
StockTalk |
News |
Chart |
Request a new note
C
A N
S L
I M
|
LNKD
-
NYSE
Linkedin Corp Class A
INTERNET - Internet Information Providers
|
$186.11
|
+8.89
5.02% |
$187.13
|
2,179,143
86.89% of 50 DAV
50 DAV is 2,508,000
|
$186.06
0.03%
|
4/12/2013
|
$182.69
|
PP = $184.25
|
|
MB = $193.46
|
 Most Recent Note - 4/23/2013 9:03:56 PM
Y - Rallied with near average volume for a 3rd consecutive gain today and hit a new 52-week high. Volume-driven gains above the pivot point may clinch a proper new (or add-on) technical buy signal. Its 50 DMA line and recent low define important near-term chart support to watch.
>>> The latest Featured Stock Update with an annotated graph appeared on 4/5/2013. Click here.
View all notes |
Alert me of new notes |
CANSLIM.net Company Profile |
SEC |
Zacks Reports |
StockTalk |
News |
Chart |
Request a new note
C
A N
S L
I M
|
MRLN
-
NASDAQ
Marlin Business Services
DIVERSIFIED SERVICES - Rental and Leasing Services
|
$23.61
|
+1.16
5.17% |
$23.62
|
9,528
36.51% of 50 DAV
50 DAV is 26,100
|
$23.98
-1.54%
|
3/15/2013
|
$22.29
|
PP = $23.18
|
|
MB = $24.34
|
Most Recent Note - 4/23/2013 9:01:29 PM
Y - Rallied for a new high close today but with light volume behind the gain, not volume indicative of institutional buying demand. Perched within close striking distance of its 52-week high and little resistance remains.
>>> The latest Featured Stock Update with an annotated graph appeared on 4/9/2013. Click here.
View all notes |
Alert me of new notes |
CANSLIM.net Company Profile |
SEC |
Zacks Reports |
StockTalk |
News |
Chart |
Request a new note
C
A N
S L
I M
|
Symbol/Exchange
Company Name
Industry Group |
PRICE |
CHANGE
(%Change) |
Day High |
Volume
(% DAV)
(% 50 day avg vol) |
52 Wk Hi
% From Hi |
Featured
Date |
Price
Featured |
Pivot Featured |
|
Max Buy |
MWIV
-
NASDAQ
M W I Veterinary Supply
HEALTH SERVICES - Medical Instruments and; Supplies
|
$122.55
|
-2.50
-2.00% |
$126.20
|
71,226
129.97% of 50 DAV
50 DAV is 54,800
|
$137.18
-10.66%
|
3/4/2013
|
$130.90
|
PP = $129.45
|
|
MB = $135.92
|
Most Recent Note - 4/19/2013 1:16:09 PM
G - Still sputtering below its 50 DMA line, and its Relative Strength rating has slumped to 79, below the 80+ minimum guideline for buy candidates.
>>> The latest Featured Stock Update with an annotated graph appeared on 4/4/2013. Click here.
View all notes |
Alert me of new notes |
CANSLIM.net Company Profile |
SEC |
Zacks Reports |
StockTalk |
News |
Chart |
Request a new note
C
A N
S L
I M
|
N
-
NYSE
Netsuite Inc
DIVERSIFIED SERVICES - Business/Management Services
|
$79.80
|
+1.05
1.33% |
$80.01
|
380,409
109.25% of 50 DAV
50 DAV is 348,200
|
$80.33
-0.66%
|
12/12/2012
|
$64.75
|
PP = $67.12
|
|
MB = $70.48
|
Most Recent Note - 4/16/2013 6:47:10 PM
G - Hovering near its all-time high, extended after a recent streak of 7 consecutive weekly gains. Its 50 DMA line ($73.58 now) defines important near-term support to watch.
>>> The latest Featured Stock Update with an annotated graph appeared on 4/22/2013. Click here.
View all notes |
Alert me of new notes |
CANSLIM.net Company Profile |
SEC |
Zacks Reports |
StockTalk |
News |
Chart |
Request a new note
C
A N
S L
I M
|
RRTS
-
NYSE
Roadrunner Trans Systems
TRANSPORTATION - Air Delivery and Freight Service
|
$22.43
|
+0.20
0.90% |
$22.49
|
42,238
22.34% of 50 DAV
50 DAV is 189,100
|
$23.88
-6.07%
|
4/3/2013
|
$22.77
|
PP = $23.75
|
|
MB = $24.94
|
Most Recent Note - 4/23/2013 8:58:25 PM
G - Still sputtering below its 50 DMA line after failing to trigger a new buy signal since featured on 4/03/13. A rebound above that important short-term average would help its outlook improve. See the latest FSU analysis for more details and a new annotated graph.
>>> The latest Featured Stock Update with an annotated graph appeared on 4/23/2013. Click here.
View all notes |
Alert me of new notes |
CANSLIM.net Company Profile |
SEC |
Zacks Reports |
StockTalk |
News |
Chart |
Request a new note
C
A N
S L
I M
|
VRX
-
NYSE
Valeant Pharmaceuticals
DRUGS - Drug Manufacturers - Other
|
$74.98
|
+0.78
1.05% |
$75.59
|
945,933
70.07% of 50 DAV
50 DAV is 1,350,000
|
$76.56
-2.06%
|
12/20/2012
|
$60.24
|
PP = $61.21
|
|
MB = $64.27
|
Most Recent Note - 4/19/2013 1:18:34 PM
G - Finding recent support well above its 50 DMA line defining important near-term support.
>>> The latest Featured Stock Update with an annotated graph appeared on 4/8/2013. Click here.
View all notes |
Alert me of new notes |
CANSLIM.net Company Profile |
SEC |
Zacks Reports |
StockTalk |
News |
Chart |
Request a new note
C
A N
S L
I M
|
|
|
|
THESE ARE NOT BUY RECOMMENDATIONS!
Comments contained in the body of this report are technical
opinions only. The material herein has been obtained
from sources believed to be reliable and accurate, however,
its accuracy and completeness cannot be guaranteed.
This site is not an investment advisor, hence it does
not endorse or recommend any securities or other investments.
Any recommendation contained in this report may not
be suitable for all investors and it is not to be deemed
an offer or solicitation on our part with respect to
the purchase or sale of any securities. All trademarks,
service marks and trade names appearing in this report
are the property of their respective owners, and are
likewise used for identification purposes only.
This report is a service available
only to active Paid Premium Members.
You may opt-out of receiving report notifications
at any time. Questions or comments may be submitted
by writing to Premium Membership Services 665 S.E. 10 Street, Suite 201 Deerfield Beach, FL 33441-5634 or by calling 1-800-965-8307
or 954-785-1121.
|
|
|

