You are not logged in.
This means you
CAN ONLY VIEW reports that were published prior to Monday, April 14, 2025.
You
MUST UPGRADE YOUR MEMBERSHIP if you want to see any current reports.
AFTER MARKET UPDATE - MONDAY, APRIL 22ND, 2013
Previous After Market Report Next After Market Report >>>
|
|
|
|
DOW |
+19.66 |
14,567.17 |
+0.14% |
|
Volume |
620,514,740 |
-32% |
|
Volume |
1,616,014,130 |
-4% |
|
NASDAQ |
+27.49 |
3,233.55 |
+0.86% |
|
Advancers |
1,739 |
56% |
|
Advancers |
1,272 |
50% |
|
S&P 500 |
+7.25 |
1,562.50 |
+0.47% |
|
Decliners |
1,260 |
40% |
|
Decliners |
1,175 |
46% |
|
Russell 2000 |
+2.30 |
914.80 |
+0.25% |
|
52 Wk Highs |
157 |
|
|
52 Wk Highs |
75 |
|
|
S&P 600 |
+0.64 |
511.50 |
+0.13% |
|
52 Wk Lows |
42 |
|
|
52 Wk Lows |
44 |
|
|
 |
Major Averages Rose Again With Less Volume Conviction
Kenneth J. Gruneisen - Passed the CAN SLIM® Master's Exam
Stocks managed to pare last week's losses as investors overlooked a disappointing housing report. Behind Monday's gains the volume totals on the exchanges were reported lighter than the prior session totals on the NYSE and on the Nasdaq exchange. Breadth was positive as advancers led decliners by almost a 3-2 margin on the NYSE, but the lead was narrow on the Nasdaq exchange. New 52-week highs outnumbered new 52-week lows on the NYSE on the Nasdaq exchange. There were 35 high-ranked companies from the CANSLIM.net Leaders List making new 52-week highs and appearing on the CANSLIM.net BreakOuts Page, up from the prior session total of 27 stocks. There were gains for 5 of the 10 high-ranked companies currently included on the Featured Stocks Page.

Positive corporate earnings helped buoy the major averages. All 10 sectors on the S&P finished higher, led by gains in energy stocks. Shares of Chevron Corp (CVX +0.58%) to $116.57 as crude oil advanced +1.1% to $89.26 per barrel. Mining stocks also showed strength as gold prices rose +2.1% to about $1,424 an ounce. On the earnings front, Halliburton Co (HAL +5.59%) rallied following the company’s better-than-expected profit tally. Also on the upside, shares of Hasbro (HAS +3.40%) to $46.55 after the toymaker topped analysts’ expectations in the quarter. In other news, Microsoft Corp (MSFT +3.58%) on news that activist investor David Faber took a $2 billion stake in the company.
Turning to fixed income markets, treasuries were modestly higher along the curve. The benchmark 10-year note was up 1/8 of a point to yield 1.70% and the 30-year bond added 5/32 to yield 2.88%.
The market's (M criteria) quick evaporation of leadership (stocks hitting new 52-week highs) and decisive pullback on higher volume of late was a sign of more worrisome distributional pressure. The damaging action ended the latest rally. Investors should be watchful for technical sell signals and be ready to reduce market exposure. New buying efforts should be avoided until broader strength returns and until it is noted and there is again a follow-through day of meaningful gains from at least one of the major averages coupled with an expansion in leadership.
Watch for an announcement via email concerning the next WEBCAST. The webcast will also be available via an updated link highlighted at the top of the Premium Member Homepage.
PICTURED: The Dow Jones Industrial Average is consolidating well above its 50-day moving average (DMA) line. Greater concerns would be raised by any subsequent violation of that important short-term average as the technical deterioration would be evidence that the correction was worsening.
|
 Kenneth J. Gruneisen started out as a licensed stockbroker in August 1987, a couple of months prior to the historic stock market crash that took the Dow Jones Industrial Average down -22.6% in a single day. He has published daily fact-based fundamental and technical analysis on high-ranked stocks online for two decades. Through FACTBASEDINVESTING.COM, Kenneth provides educational articles, news, market commentary, and other information regarding proven investment systems that work in good times and bad.
Comments contained in the body of this report are technical opinions only and are not necessarily those of Gruneisen Growth Corp. The material herein has been obtained from sources believed to be reliable and accurate, however, its accuracy and completeness cannot be guaranteed. Our firm, employees, and customers may effect transactions, including transactions contrary to any recommendation herein, or have positions in the securities mentioned herein or options with respect thereto. Any recommendation contained in this report may not be suitable for all investors and it is not to be deemed an offer or solicitation on our part with respect to the purchase or sale of any securities. |
|
 |
Semiconductor, Networking, Commodity-Linked Groups Led Gainers
Kenneth J. Gruneisen - Passed the CAN SLIM® Master's Exam
Commodity-linked groups had a positive bias as the Integrated Oil Index ($XOI +1.10%), Oil Services Index ($OSX +1.30%), and the Gold & Silver Index ($XAU +1.36%) tallied gains. The Semiconductor Index ($SOX +1.06%) led the tech sector higher while the Internet Index ($IIX +0.62%) posted a smaller gain and the Networking Index ($NWX +0.13%) inched higher. while the Medical-related shares showed a negative bias as the Healthcare Index ($HMO -0.92%) and Biotechnology Index ($BTK -0.43%) both lost ground. The Retail Index ($RLX +0.31%) and the Broker/Dealer Index ($XBD +0.25%) edged higher while the Bank Index ($BKX -0.04%) finished flat.
Charts courtesy www.stockcharts.com
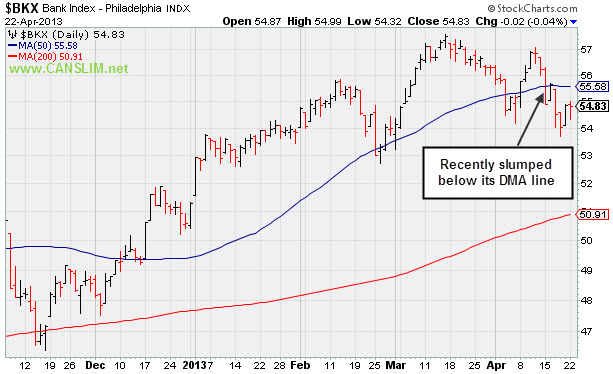
PICTURED: The Bank Index ($BKX -0.04%) recently slumped below its 50-day moving average (DMA).
| Oil Services |
$OSX |
239.26 |
+3.06 |
+1.30% |
+8.68% |
| Healthcare |
$HMO |
2,846.73 |
-26.46 |
-0.92% |
+13.23% |
| Integrated Oil |
$XOI |
1,298.04 |
+14.15 |
+1.10% |
+4.53% |
| Semiconductor |
$SOX |
421.37 |
+4.40 |
+1.06% |
+9.71% |
| Networking |
$NWX |
215.81 |
+0.27 |
+0.13% |
-4.74% |
| Internet |
$IIX |
352.11 |
+2.15 |
+0.62% |
+7.68% |
| Broker/Dealer |
$XBD |
108.65 |
+0.27 |
+0.25% |
+15.18% |
| Retail |
$RLX |
737.23 |
+2.29 |
+0.31% |
+12.89% |
| Gold & Silver |
$XAU |
104.29 |
+1.40 |
+1.36% |
-37.02% |
| Bank |
$BKX |
54.83 |
-0.02 |
-0.04% |
+6.92% |
| Biotech |
$BTK |
1,911.29 |
-8.17 |
-0.43% |
+23.55% |
|
|
|
 |
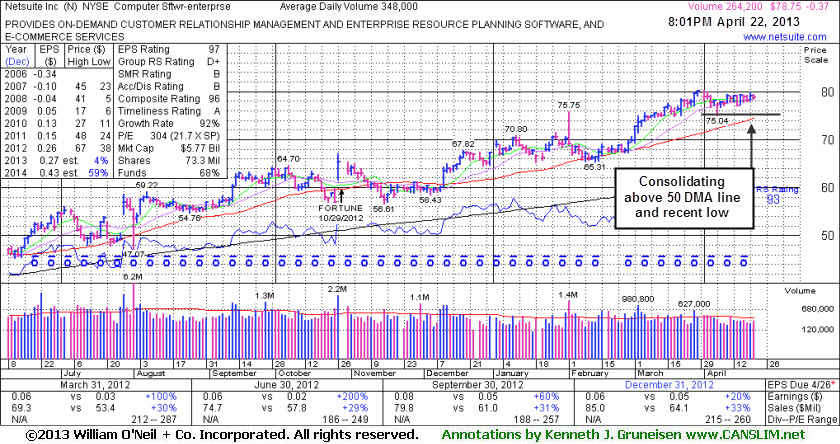
New Flat Base Formed, But Fundamental Concerns Remain
Kenneth J. Gruneisen - Passed the CAN SLIM® Master's Exam
Netsuite Inc (N -$0.37 or -0.47% to $78.75) is consolidating in a tight range near its all-time high. It has formed an orderly flat base however, due to fundamental concerns, no new pivot point is being cited. A subsequent volume-driven gain into new high territory may trigger a new (or add-on) technical buy signal, however historic studies showed that the markets best winners had a combination of strong fundamentals (earnings history) coupled with bullish technical (price/volume) action. Its 50-day moving average (DMA) line ($74.48 now) defines important near-term support to watch.
It reported earnings +20% on +33% sales revenues for the Dec '12 quarter, below the +25% minimum earnings guideline (C criteria), raising fundamental concerns for followers of the fact-based investment system. The company had reported earnings increases above the +25% minimum earnings guideline (C criteria) in the 5 prior quarterly comparisons. Its annual earnings (A criteria) history improved from losses prior to FY '09. The stock made limited progress since it was highlighted in yellow in the 12/12/12 mid-day report with a pivot point cited based on its 10/26/12 high plus 10 cents (read here), however it seems to be rewarding patient investors.
Netsuite's last appearance in this FSU section was on 4/01/13 with an annotated graph under the headline, "Bullish Up/Down Volume Ratio Despite Sub Par Dec '12 Earnings Increase". The number of top-rated funds owning its shares rose from 201 in Jun '11 to 322 in Dec '12, a reassuring sign concerning the I criteria. Its current Up/Down Volume Ratio of 1.6 is an unbiased indication its shares have been under accumulation over the past 50 days.
|
|
|
Color Codes Explained :
Y - Better candidates highlighted by our
staff of experts.
G - Previously featured
in past reports as yellow but may no longer be buyable under the
guidelines.
***Last / Change / Volume data in this table is the closing quote data***
Symbol/Exchange
Company Name
Industry Group |
PRICE |
CHANGE
(%Change) |
Day High |
Volume
(% DAV)
(% 50 day avg vol) |
52 Wk Hi
% From Hi |
Featured
Date |
Price
Featured |
Pivot Featured |
|
Max Buy |
CELG
-
NASDAQ
Celgene Corp
DRUGS - Drug Manufacturers - Major
|
$126.84
|
+4.48
3.66% |
$127.57
|
3,762,573
122.23% of 50 DAV
50 DAV is 3,078,300
|
$124.10
2.21%
|
3/27/2013
|
$113.24
|
PP = $115.54
|
|
MB = $121.32
|
 Most Recent Note - 4/22/2013 8:23:45 PM
G - Gapped up today and hit a new all-time high, getting more extended from any sound base. Its 50 DMA line defines important near-term support to watch.
>>> The latest Featured Stock Update with an annotated graph appeared on 4/19/2013. Click here.
View all notes |
Alert me of new notes |
CANSLIM.net Company Profile |
SEC |
Zacks Reports |
StockTalk |
News |
Chart |
Request a new note
C
A N
S L
I M


|
CFNL
-
NASDAQ
Cardinal Financial Corp
BANKING - Regional - Southeast Banks
|
$14.63
|
-0.39
-2.60% |
$14.91
|
682,186
301.85% of 50 DAV
50 DAV is 226,000
|
$18.40
-20.49%
|
3/22/2013
|
$17.99
|
PP = $18.29
|
|
MB = $19.20
|
Most Recent Note - 4/22/2013 8:26:24 PM
Slumped further below its 200 DMA line today, and it will be dropped from the Featured Stocks list tonight. A rebound above its 50 DMA line is needed to help its outlook improve.
>>> The latest Featured Stock Update with an annotated graph appeared on 4/10/2013. Click here.
View all notes |
Alert me of new notes |
CANSLIM.net Company Profile |
SEC |
Zacks Reports |
StockTalk |
News |
Chart |
Request a new note
C
A N
S L
I M
|
CMCSA
-
NASDAQ
Comcast Corp Cl A
MEDIA - CATV Systems
|
$40.47
|
-0.09
-0.22% |
$40.62
|
13,750,769
96.31% of 50 DAV
50 DAV is 14,277,900
|
$42.61
-5.02%
|
12/3/2012
|
$37.08
|
PP = $38.06
|
|
MB = $39.96
|
Most Recent Note - 4/19/2013 12:11:14 PM
G - Rebounding toward its 50 DMA line today after violating that important short-term average with 2 prior losses marked by above average volume. A prompt rebound above its 50 DMA line is needed for its outlook to improve.
>>> The latest Featured Stock Update with an annotated graph appeared on 4/16/2013. Click here.
View all notes |
Alert me of new notes |
CANSLIM.net Company Profile |
SEC |
Zacks Reports |
StockTalk |
News |
Chart |
Request a new note
C
A N
S L
I M
|
FLT
-
NYSE
Fleetcor Technologies
DIVERSIFIED SERVICES - Business/Management Services
|
$75.30
|
+1.86
2.53% |
$75.49
|
1,039,222
124.43% of 50 DAV
50 DAV is 835,200
|
$78.87
-4.53%
|
3/21/2013
|
$71.14
|
PP = $73.00
|
|
MB = $76.65
|
Most Recent Note - 4/19/2013 12:17:32 PM
Y - Managed a "positive reversal" after early weakness today, making a stand near its 50 DMA line ($71.67 now). More damaging losses would raise more serious concerns and trigger a worrisome technical sell signal.
>>> The latest Featured Stock Update with an annotated graph appeared on 4/15/2013. Click here.
View all notes |
Alert me of new notes |
CANSLIM.net Company Profile |
SEC |
Zacks Reports |
StockTalk |
News |
Chart |
Request a new note
C
A N
S L
I M
|
LNKD
-
NYSE
Linkedin Corp Class A
INTERNET - Internet Information Providers
|
$177.22
|
+2.27
1.30% |
$178.36
|
1,472,745
57.40% of 50 DAV
50 DAV is 2,565,800
|
$186.06
-4.75%
|
4/12/2013
|
$182.69
|
PP = $184.25
|
|
MB = $193.46
|
Most Recent Note - 4/16/2013 6:43:53 PM
Y - Traded up today with lighter volume. Color code was changed to yellow with a new pivot point cited based on its 3/14/18 high plus 10 cents while forming a short 5-week flat base pattern. Volume-driven gains above the pivot point may trigger a new (or add-on) technical buy signal. Its 50 DMA line and recent low define important near-term chart support to watch.
>>> The latest Featured Stock Update with an annotated graph appeared on 4/5/2013. Click here.
View all notes |
Alert me of new notes |
CANSLIM.net Company Profile |
SEC |
Zacks Reports |
StockTalk |
News |
Chart |
Request a new note
C
A N
S L
I M
|
Symbol/Exchange
Company Name
Industry Group |
PRICE |
CHANGE
(%Change) |
Day High |
Volume
(% DAV)
(% 50 day avg vol) |
52 Wk Hi
% From Hi |
Featured
Date |
Price
Featured |
Pivot Featured |
|
Max Buy |
MRLN
-
NASDAQ
Marlin Business Services
DIVERSIFIED SERVICES - Rental and Leasing Services
|
$22.45
|
-0.48
-2.09% |
$23.25
|
13,582
52.04% of 50 DAV
50 DAV is 26,100
|
$23.98
-6.38%
|
3/15/2013
|
$22.29
|
PP = $23.18
|
|
MB = $24.34
|
Most Recent Note - 4/19/2013 1:14:00 PM
Y - Rallying within close striking distance of its 52-week high today and little resistance remains. Promptly rebounded above its 50 DMA line, an encouraging sign of institutional support on the prior session. Subsequent deterioration below the recent low ($20.10) or its 200 DMA line would raise more serious concerns and trigger additional sell signals.
>>> The latest Featured Stock Update with an annotated graph appeared on 4/9/2013. Click here.
View all notes |
Alert me of new notes |
CANSLIM.net Company Profile |
SEC |
Zacks Reports |
StockTalk |
News |
Chart |
Request a new note
C
A N
S L
I M
|
MWIV
-
NASDAQ
M W I Veterinary Supply
HEALTH SERVICES - Medical Instruments and; Supplies
|
$125.05
|
+0.90
0.72% |
$125.63
|
37,719
68.58% of 50 DAV
50 DAV is 55,000
|
$137.18
-8.84%
|
3/4/2013
|
$130.90
|
PP = $129.45
|
|
MB = $135.92
|
Most Recent Note - 4/19/2013 1:16:09 PM
G - Still sputtering below its 50 DMA line, and its Relative Strength rating has slumped to 79, below the 80+ minimum guideline for buy candidates.
>>> The latest Featured Stock Update with an annotated graph appeared on 4/4/2013. Click here.
View all notes |
Alert me of new notes |
CANSLIM.net Company Profile |
SEC |
Zacks Reports |
StockTalk |
News |
Chart |
Request a new note
C
A N
S L
I M
|
N
-
NYSE
Netsuite Inc
DIVERSIFIED SERVICES - Business/Management Services
|
$78.75
|
-0.37
-0.47% |
$79.41
|
264,373
75.97% of 50 DAV
50 DAV is 348,000
|
$80.33
-1.97%
|
12/12/2012
|
$64.75
|
PP = $67.12
|
|
MB = $70.48
|
Most Recent Note - 4/16/2013 6:47:10 PM
G - Hovering near its all-time high, extended after a recent streak of 7 consecutive weekly gains. Its 50 DMA line ($73.58 now) defines important near-term support to watch.
>>> The latest Featured Stock Update with an annotated graph appeared on 4/22/2013. Click here.
View all notes |
Alert me of new notes |
CANSLIM.net Company Profile |
SEC |
Zacks Reports |
StockTalk |
News |
Chart |
Request a new note
C
A N
S L
I M
|
RRTS
-
NYSE
Roadrunner Trans Systems
TRANSPORTATION - Air Delivery and Freight Service
|
$22.23
|
+0.08
0.36% |
$22.43
|
98,770
50.21% of 50 DAV
50 DAV is 196,700
|
$23.88
-6.91%
|
4/3/2013
|
$22.77
|
PP = $23.75
|
|
MB = $24.94
|
Most Recent Note - 4/17/2013 11:39:46 AM
G - Color code is changed to green after violating the recent low and its 50 DMA line triggering technical sell signals. Only a prompt rebound above that important short-term average would help its outlook improve.
>>> The latest Featured Stock Update with an annotated graph appeared on 4/3/2013. Click here.
View all notes |
Alert me of new notes |
CANSLIM.net Company Profile |
SEC |
Zacks Reports |
StockTalk |
News |
Chart |
Request a new note
C
A N
S L
I M
|
VRX
-
NYSE
Valeant Pharmaceuticals
DRUGS - Drug Manufacturers - Other
|
$74.20
|
-1.32
-1.75% |
$75.33
|
1,056,759
78.70% of 50 DAV
50 DAV is 1,342,700
|
$76.56
-3.08%
|
12/20/2012
|
$60.24
|
PP = $61.21
|
|
MB = $64.27
|
Most Recent Note - 4/19/2013 1:18:34 PM
G - Finding recent support well above its 50 DMA line defining important near-term support.
>>> The latest Featured Stock Update with an annotated graph appeared on 4/8/2013. Click here.
View all notes |
Alert me of new notes |
CANSLIM.net Company Profile |
SEC |
Zacks Reports |
StockTalk |
News |
Chart |
Request a new note
C
A N
S L
I M
|
Symbol/Exchange
Company Name
Industry Group |
PRICE |
CHANGE
(%Change) |
Day High |
Volume
(% DAV)
(% 50 day avg vol) |
52 Wk Hi
% From Hi |
Featured
Date |
Price
Featured |
Pivot Featured |
|
Max Buy |
|
|
|
THESE ARE NOT BUY RECOMMENDATIONS!
Comments contained in the body of this report are technical
opinions only. The material herein has been obtained
from sources believed to be reliable and accurate, however,
its accuracy and completeness cannot be guaranteed.
This site is not an investment advisor, hence it does
not endorse or recommend any securities or other investments.
Any recommendation contained in this report may not
be suitable for all investors and it is not to be deemed
an offer or solicitation on our part with respect to
the purchase or sale of any securities. All trademarks,
service marks and trade names appearing in this report
are the property of their respective owners, and are
likewise used for identification purposes only.
This report is a service available
only to active Paid Premium Members.
You may opt-out of receiving report notifications
at any time. Questions or comments may be submitted
by writing to Premium Membership Services 665 S.E. 10 Street, Suite 201 Deerfield Beach, FL 33441-5634 or by calling 1-800-965-8307
or 954-785-1121.
|
|
|

