You are not logged in.
This means you
CAN ONLY VIEW reports that were published prior to Monday, April 14, 2025.
You
MUST UPGRADE YOUR MEMBERSHIP if you want to see any current reports.
AFTER MARKET UPDATE - THURSDAY, APRIL 21ST, 2011
Previous After Market Report Next After Market Report >>>
|
|
|
|
DOW |
+52.45 |
12,505.99 |
+0.42% |
|
Volume |
813,254,140 |
-16% |
|
Volume |
1,823,605,980 |
-10% |
|
NASDAQ |
+17.65 |
2,820.16 |
+0.63% |
|
Advancers |
1,981 |
63% |
|
Advancers |
1,553 |
57% |
|
S&P 500 |
+7.02 |
1,337.38 |
+0.53% |
|
Decliners |
1,034 |
33% |
|
Decliners |
1,047 |
39% |
|
Russell 2000 |
+6.19 |
845.64 |
+0.74% |
|
52 Wk Highs |
224 |
|
|
52 Wk Highs |
143 |
|
|
S&P 600 |
+3.22 |
447.51 |
+0.72% |
|
52 Wk Lows |
10 |
|
|
52 Wk Lows |
20 |
|
|
 |
Indices Rallied After Rough Start to Short Trading Week
Kenneth J. Gruneisen - Passed the CAN SLIM® Master's Exam
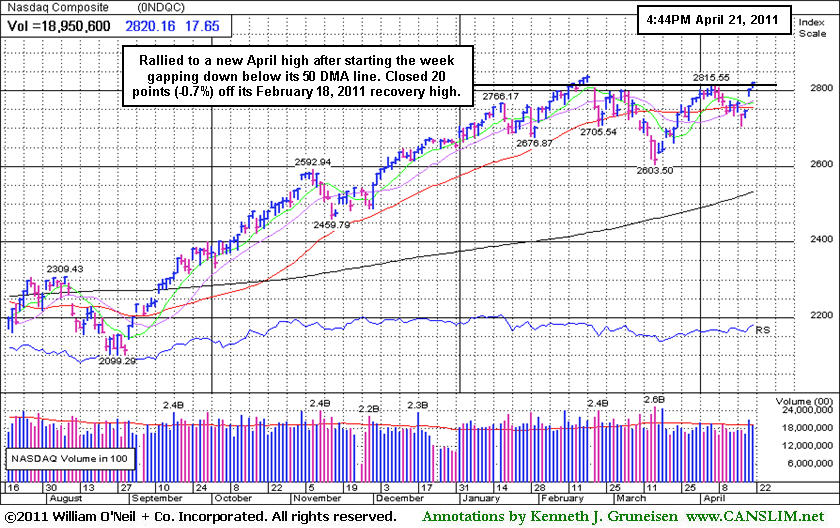
The markets will be closed in tomorrow in observation of Good Friday. For the week, the Dow Jones Industrial Average was up +1.3% and rallied to new recovery highs. The benchmark S&P 500 Index also gained +1.3%, and the Nasdaq rose +2%, for the holiday-shortened week. The week had begun with damaging gaps down for the major averages that led to trading below their respective 50-day moving average (DMA) lines. As the major averages rebounded, the level of buying conviction or "accumulation" from institutional investors was evidenced by higher volume totals on both major exchanges. Volume totals cooled slightly on Thursday, meanwhile advancing issues beat decliners almost 2-1 on the NYSE and by 3-2 on the Nasdaq exchange. New 52-week highs solidly outnumbered new 52-week lows on the NYSE and on the Nasdaq exchange. There were 88 high-ranked companies from the CANSLIM.net Leaders List that made new 52-week highs and appeared on the CANSLIM.net BreakOuts Page, up slightly from the total of 84 on the prior session. On the Featured Stocks Page there were gains from 18 of the 21 high-ranked market leaders currently listed.
Strong earnings gains were softened by some weak economic data. New applications for unemployment benefits fell less than expected to 403,000 in the latest week. Home prices were down -1.6% in February, much more than economists forecast. A gauge of manufacturing in the Philadelphia area fell more than expected. Mining stocks rose as gold closed above $1,500 per ounce for the first time.
Apple Inc (AAPL +2.42%) rose after its second quarter profit almost doubled, and The Travelers Companies, Inc (TRV +3.70%) lifted its quarterly dividend and also reported positive results. Tech stocks also got a boost from Qualcomm Inc (QCOM +3.02%). The Dow's gain was limited by McDonald's Corp (MCD -1.9%) as the restaurant chain said profits rose, but it may need to boost prices because of higher food costs. Keep in mind that earnings reports will continue to be a factor next week, and volume and volatility are often greater near earnings announcements.
PICTURED: The Nasdaq Composite Index rallied to a new April high after starting the week gapping down below its 50-day moving average (DMA) line. Closed 20 points (-0.7%) off its February 18, 2011 recovery high.
|
 Kenneth J. Gruneisen started out as a licensed stockbroker in August 1987, a couple of months prior to the historic stock market crash that took the Dow Jones Industrial Average down -22.6% in a single day. He has published daily fact-based fundamental and technical analysis on high-ranked stocks online for two decades. Through FACTBASEDINVESTING.COM, Kenneth provides educational articles, news, market commentary, and other information regarding proven investment systems that work in good times and bad.
Comments contained in the body of this report are technical opinions only and are not necessarily those of Gruneisen Growth Corp. The material herein has been obtained from sources believed to be reliable and accurate, however, its accuracy and completeness cannot be guaranteed. Our firm, employees, and customers may effect transactions, including transactions contrary to any recommendation herein, or have positions in the securities mentioned herein or options with respect thereto. Any recommendation contained in this report may not be suitable for all investors and it is not to be deemed an offer or solicitation on our part with respect to the purchase or sale of any securities. |
|
 |
Optimism Continues In Healthcare Group
Kenneth J. Gruneisen - Passed the CAN SLIM® Master's Exam
The Broker/Dealer Index ($XBD +1.60%) outpaced the Bank Index ($BKX +0.42%)as financial shares and the Retail Index ($RLX +0.27%) had a positive bias on Thursday's widely positive session. Commodity-linked groups were on the rise as the Integrated Oil Index ($XOI +0.43%), Oil Services Index ($OSX +1.14%), and Gold & Silver Index ($XAU +1.35%) tallied gains. The Internet Index ($IIX +0.97%), Biotechnology Index ($BTK +1.00%), and Networking Index ($NWX +1.04%) posted gains, but the Semiconductor Index ($SOX -0.05%) paused following its standout gain among the tech indexes noted on Wednesday's session.
Charts courtesy www.stockcharts.com
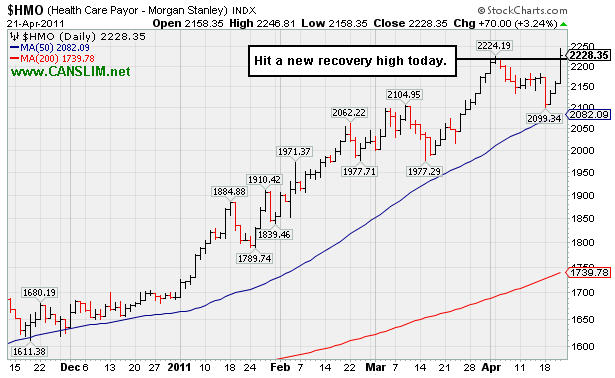
PICTURED: The Healthcare Index ($HMO +3.24%) was a standout gainer and hit a new recovery high. Year-to-date it has been a standout gainer among the group indexes regularly covered in the Industry Group Watch (IGW) section. When posting a 5th consecutive gain and rallying to new recovery highs, the January 6, 2011 report (read here) included the following observation - "While the new GOP-led Congress is quickly gunning to shoot down recent healthcare reform legislation, investors are showing optimism for the healthcare industry's outlook."
| Oil Services |
$OSX |
290.85 |
+3.27 |
+1.14% |
+18.66% |
| Healthcare |
$HMO |
2,228.35 |
+70.01 |
+3.24% |
+31.70% |
| Integrated Oil |
$XOI |
1,363.99 |
+5.81 |
+0.43% |
+12.43% |
| Semiconductor |
$SOX |
443.20 |
-0.22 |
-0.05% |
+7.62% |
| Networking |
$NWX |
335.95 |
+3.45 |
+1.04% |
+19.74% |
| Internet |
$IIX |
324.90 |
+3.12 |
+0.97% |
+5.58% |
| Broker/Dealer |
$XBD |
121.38 |
+1.92 |
+1.60% |
-0.11% |
| Retail |
$RLX |
534.51 |
+1.44 |
+0.27% |
+5.14% |
| Gold & Silver |
$XAU |
225.79 |
+3.01 |
+1.35% |
-0.35% |
| Bank |
$BKX |
50.47 |
+0.21 |
+0.42% |
-3.33% |
| Biotech |
$BTK |
1,437.36 |
+14.22 |
+1.00% |
+10.77% |
|
|
|
 |
Breakout Followed Recently Noted Public Offering
Kenneth J. Gruneisen - Passed the CAN SLIM® Master's Exam
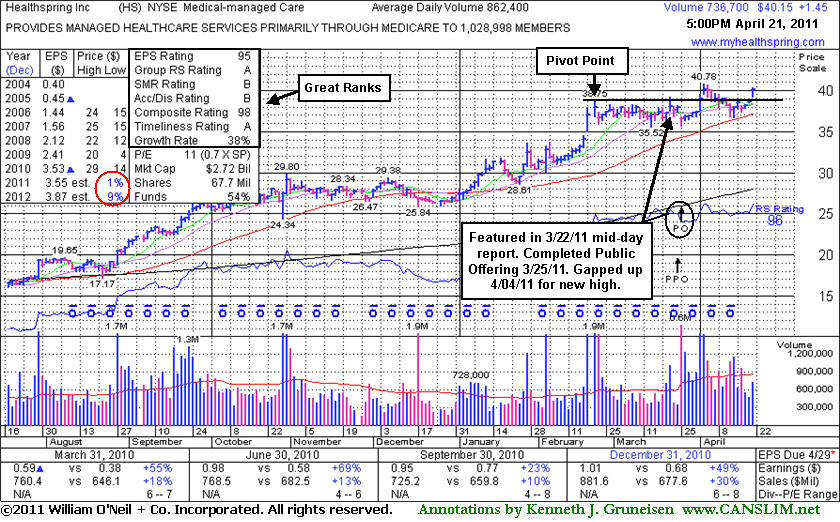
Healthspring Inc (HS +$1.45 or +3.75% to $40.13) gapped up again today and finished at its best ever close just -1.5% off its 52-week high. It found support above its 50-day moving average (DMA) line after as pullback below its pivot point last week. Its 50 DMA line ($37.19 now) defines important support above recent lows in the $35.50 area. Following its last appearance in this FSU section on March 23, 2011 with an annotated graph under the headline, "Not Yet a Convincing New Breakout", it completed a Public Offering on 3/25/11, then technically broke out on 4/01/11 and gapped up for another volume-driven gain and new all-time high on 4/04/11. The number of top-rated funds owning its shares rose from 438 in March '10 to 483 in March '11, a reassuring sign concerning the I criteria.
Since HS was first featured at $19.91 in the 8/27/10 mid-day report it has traded up as much as +104.8%. After an orderly flat base near minimum length, its color code was most recently changed to yellow with pivot point cited based on its 52-week high plus 10 cents when featured in the 3/22/11 mid-day report (read here). For the quarter ended December 31, 2011 versus the year earlier period its +30% increase in sales revenues and +49% increase in earnings were a welcome reassurance after sequential deceleration from +25%, +18%, +13%, to +10% in the Dec '09 and Mar, Jun, Sep '10 quarters, respectively. In light of its stronger sales and earnings increases in the latest quarter and other bullish characteristics, new buying efforts could be justified by disciplined investors. However, previously noted Street earnings estimates calling for EPS growth only in the +1-9% range in FY '11 and FY '12 (see red circle) remain a concern.
|
|
|
Color Codes Explained :
Y - Better candidates highlighted by our
staff of experts.
G - Previously featured
in past reports as yellow but may no longer be buyable under the
guidelines.
***Last / Change / Volume data in this table is the closing quote data***
Symbol/Exchange
Company Name
Industry Group |
PRICE |
CHANGE
(%Change) |
Day High |
Volume
(% DAV)
(% 50 day avg vol) |
52 Wk Hi
% From Hi |
Featured
Date |
Price
Featured |
Pivot Featured |
|
Max Buy |
AIXG
-
NASDAQ
Aixtron Se
ELECTRONICS - Semiconductor Equipment andamp; Mate
|
$42.06
|
+0.29
0.69% |
$42.52
|
163,677
63.74% of 50 DAV
50 DAV is 256,800
|
$44.96
-6.45%
|
4/5/2011
|
$44.14
|
PP = $44.64
|
|
MB = $46.87
|
Most Recent Note - 4/20/2011 11:34:07 AM
G - Gapped up today after finding support near prior lows in the $38 area. Its 50 DMA line may now act as resistance, while a convincing rebound above that important short-term average would help its outlook.
>>> The latest Featured Stock Update with an annotated graph appeared on 4/5/2011. Click here.
View all notes |
Alert me of new notes |
CANSLIM.net Company Profile |
SEC |
Zacks Reports |
StockTalk |
News |
Chart |
Request a new note
C
A N
S L
I M


|
BIDU
-
NASDAQ
Baidu Inc Ads
INTERNET - Internet Information Providers
|
$148.65
|
-0.66
-0.44% |
$150.55
|
5,917,502
85.53% of 50 DAV
50 DAV is 6,918,900
|
$154.00
-3.47%
|
3/17/2011
|
$121.97
|
PP = $131.73
|
|
MB = $138.32
|
Most Recent Note - 4/20/2011 11:53:51 AM
G - Touched yet another new all-time high today. It is extended from its latest base, and the prior high near $131 defines initial chart support to watch near its rising 50 DMA line.
>>> The latest Featured Stock Update with an annotated graph appeared on 4/7/2011. Click here.
View all notes |
Alert me of new notes |
CANSLIM.net Company Profile |
SEC |
Zacks Reports |
StockTalk |
News |
Chart |
Request a new note
C
A N
S L
I M
|
CMG
-
NYSE
Chipotle Mexican Grill
LEISURE - Restaurants
|
$277.30
|
-10.80
-3.75% |
$283.00
|
3,514,144
316.93% of 50 DAV
50 DAV is 1,108,800
|
$289.35
-4.16%
|
4/1/2011
|
$274.00
|
PP = $275.10
|
|
MB = $288.86
|
 Most Recent Note - 4/21/2011 12:39:47 PM
G - Gapped down today after reporting earnings +23% on +24% sales revenues for the quarter ended March 31, 2011 versus the year ago period. It marked its weakest earning increase in years, and slumping below the +25% guideline raises fundamental concerns. Its color code was changed to green. Volume and volatility often increase near earnings news. On the prior session its gain with +61% above average volume had helped it rally for a new high and confirmed a technical buy signal. Its 50 DMA line ($261.20 now) defines important chart support to watch.
>>> The latest Featured Stock Update with an annotated graph appeared on 4/13/2011. Click here.
View all notes |
Alert me of new notes |
CANSLIM.net Company Profile |
SEC |
Zacks Reports |
StockTalk |
News |
Chart |
Request a new note
C
A N
S L
I M
|
CTCT
-
NASDAQ
Constant Contact Inc
MEDIA - Advertising Services
|
$31.10
|
+0.37
1.19% |
$31.24
|
459,704
104.60% of 50 DAV
50 DAV is 439,500
|
$36.33
-14.41%
|
3/22/2011
|
$33.59
|
PP = $32.49
|
|
MB = $34.11
|
Most Recent Note - 4/20/2011 5:42:52 PM
G - Small gain today with light volume following 2 damaging losses with heavy volume in prior 3 sessions. Concerns were raised as it completely negated its recent breakout, slumping below its 50 DMA line again and triggering worrisome technical sell signals. Due to report earnings after the close on Thursday, April 28th. See the latest FSU analysis for details and a new annotated graph.
>>> The latest Featured Stock Update with an annotated graph appeared on 4/19/2011. Click here.
View all notes |
Alert me of new notes |
CANSLIM.net Company Profile |
SEC |
Zacks Reports |
StockTalk |
News |
Chart |
Request a new note
C
A N
S L
I M
|
CTSH
-
NASDAQ
Cognizant Tech Sol Cl A
COMPUTER SOFTWARE and SERVICES - Business Software and Services
|
$82.47
|
+0.43
0.52% |
$82.93
|
1,742,240
77.10% of 50 DAV
50 DAV is 2,259,800
|
$82.86
-0.47%
|
2/7/2011
|
$75.09
|
PP = $76.46
|
|
MB = $80.28
|
Most Recent Note - 4/20/2011 4:50:19 PM
G - Gapped up today, rallying with below average volume to finish -1% off its all-time high. This week it tested prior highs in the $77-78 area and its 50 DMA line and found prompt support. See the latest FSU analysis for more details and a new annotated graph.
>>> The latest Featured Stock Update with an annotated graph appeared on 4/15/2011. Click here.
View all notes |
Alert me of new notes |
CANSLIM.net Company Profile |
SEC |
Zacks Reports |
StockTalk |
News |
Chart |
Request a new note
C
A N
S L
I M
|
Symbol/Exchange
Company Name
Industry Group |
PRICE |
CHANGE
(%Change) |
Day High |
Volume
(% DAV)
(% 50 day avg vol) |
52 Wk Hi
% From Hi |
Featured
Date |
Price
Featured |
Pivot Featured |
|
Max Buy |
DECK
-
NASDAQ
Deckers Outdoor Corp
CONSUMER NON-DURABLES - Textile - Apparel Footwear
|
$96.11
|
+0.35
0.37% |
$97.00
|
682,147
50.18% of 50 DAV
50 DAV is 1,359,500
|
$95.99
0.13%
|
2/3/2011
|
$79.61
|
PP = $82.67
|
|
MB = $86.80
|
Most Recent Note - 4/20/2011 4:51:35 PM
G - Gapped up today and hit a new all-time high with a gain on light volume while rising from a shorter than minimum length "cup-with-handle" type consolidation. Its 50 DMA line defines initial chart support to watch.
>>> The latest Featured Stock Update with an annotated graph appeared on 4/6/2011. Click here.
View all notes |
Alert me of new notes |
CANSLIM.net Company Profile |
SEC |
Zacks Reports |
StockTalk |
News |
Chart |
Request a new note
C
A N
S L
I M
|
EZPW
-
NASDAQ
Ezcorp Inc Cl A
SPECIALTY RETAIL - Specialty Retail, Other
|
$30.00
|
+0.70
2.39% |
$30.01
|
373,776
108.00% of 50 DAV
50 DAV is 346,100
|
$33.08
-9.31%
|
2/18/2011
|
$27.94
|
PP = $30.04
|
|
MB = $31.54
|
Most Recent Note - 4/21/2011 6:04:26 PM
G - Closed near the session high today with its 3rd consecutive gain with near average volume. Reported earnings +31% on +21% sales revenues for the quarter ended March 31, 2011 versus the year ago period. This week's gains helped it rebound well above its 50 DMA line and back above prior highs in the $29-30 area, helping its outlook.
>>> The latest Featured Stock Update with an annotated graph appeared on 4/11/2011. Click here.
View all notes |
Alert me of new notes |
CANSLIM.net Company Profile |
SEC |
Zacks Reports |
StockTalk |
News |
Chart |
Request a new note
C
A N
S L
I M
|
FOSL
-
NASDAQ
Fossil Inc
CONSUMER DURABLES - Recreational Goods, Other
|
$96.71
|
+0.76
0.79% |
$96.99
|
607,828
60.72% of 50 DAV
50 DAV is 1,001,100
|
$96.76
-0.05%
|
2/1/2011
|
$73.30
|
PP = $74.44
|
|
MB = $78.16
|
Most Recent Note - 4/20/2011 11:31:25 AM
G - Gapped up today and hit a new all-time high. Previously noted - "It rallied more than +108% higher in 8 months since first featured in yellow in the 8/10/10 mid-day report (read here). It could produce more climactic gains, but recently it has been noted - "Extended from any sound base. Prior highs in the $83-85 area define chart support to watch above its 50 DMA line."
>>> The latest Featured Stock Update with an annotated graph appeared on 3/30/2011. Click here.
View all notes |
Alert me of new notes |
CANSLIM.net Company Profile |
SEC |
Zacks Reports |
StockTalk |
News |
Chart |
Request a new note
C
A N
S L
I M
|
HMSY
-
NASDAQ
H M S Holdings Corp
COMPUTER SOFTWARE and SERVICES - Healthcare Information Service
|
$81.70
|
+1.00
1.24% |
$81.78
|
65,893
40.67% of 50 DAV
50 DAV is 162,000
|
$84.82
-3.68%
|
11/19/2010
|
$61.89
|
PP = $63.01
|
|
MB = $66.16
|
Most Recent Note - 4/20/2011 5:35:26 PM
G - Perched -4.9% below its all-time high today after churning slightly above average volume the past couple of sessions during its short consolidation above its 50 DMA line ($78.29 now).
>>> The latest Featured Stock Update with an annotated graph appeared on 3/25/2011. Click here.
View all notes |
Alert me of new notes |
CANSLIM.net Company Profile |
SEC |
Zacks Reports |
StockTalk |
News |
Chart |
Request a new note
C
A N
S L
I M
|
HS
-
NYSE
Healthspring Inc
HEALTH SERVICES - Health Care Plans
|
$40.15
|
+1.45
3.75% |
$40.41
|
736,731
85.73% of 50 DAV
50 DAV is 859,400
|
$40.78
-1.54%
|
3/22/2011
|
$38.29
|
PP = $38.85
|
|
MB = $40.79
|
Most Recent Note - 4/21/2011 6:11:09 PM
Y - Gain today with below average volume for a new high close. Its 50 DMA line ($37.19 now) defines important support above recent lows in the $35.50 area. See the latest FSU analysis for more details and a new annotated graph.
>>> The latest Featured Stock Update with an annotated graph appeared on 4/21/2011. Click here.
View all notes |
Alert me of new notes |
CANSLIM.net Company Profile |
SEC |
Zacks Reports |
StockTalk |
News |
Chart |
Request a new note
C
A N
S L
I M
|
Symbol/Exchange
Company Name
Industry Group |
PRICE |
CHANGE
(%Change) |
Day High |
Volume
(% DAV)
(% 50 day avg vol) |
52 Wk Hi
% From Hi |
Featured
Date |
Price
Featured |
Pivot Featured |
|
Max Buy |
INFA
-
NASDAQ
Informatica Corp
COMPUTER SOFTWARE and SERVICES - Business Software and Services
|
$53.10
|
+0.10
0.19% |
$53.43
|
1,507,267
171.14% of 50 DAV
50 DAV is 880,700
|
$53.95
-1.58%
|
3/24/2011
|
$50.04
|
PP = $49.86
|
|
MB = $52.35
|
Most Recent Note - 4/21/2011 1:23:37 PM
G - Due to report earnings after the close today. It is perched at its 52-week high, above its "max buy" level. Prior highs in the $49 area define support to watch coinciding with its 50 DMA line.
>>> The latest Featured Stock Update with an annotated graph appeared on 3/28/2011. Click here.
View all notes |
Alert me of new notes |
CANSLIM.net Company Profile |
SEC |
Zacks Reports |
StockTalk |
News |
Chart |
Request a new note
C
A N
S L
I M
|
LULU
-
NASDAQ
Lululemon Athletica
MANUFACTURING - Textile Manufacturing
|
$102.17
|
+2.44
2.45% |
$102.83
|
1,739,083
76.09% of 50 DAV
50 DAV is 2,285,500
|
$101.98
0.19%
|
3/28/2011
|
$68.11
|
PP = $85.38
|
|
MB = $89.65
|
Most Recent Note - 4/21/2011 3:10:57 PM
G - Hitting another new all-time high today, this high-ranked Retail-Apparel firm is extended from any sound base pattern. Prior highs in the $85 area define initial chart support to watch.
>>> The latest Featured Stock Update with an annotated graph appeared on 3/31/2011. Click here.
View all notes |
Alert me of new notes |
CANSLIM.net Company Profile |
SEC |
Zacks Reports |
StockTalk |
News |
Chart |
Request a new note
C
A N
S L
I M
|
MG
-
NYSE
Mistras Group Inc
DIVERSIFIED SERVICES - Bulding and Faci;ity Management Services
|
$18.25
|
+0.30
1.67% |
$18.25
|
260,476
204.46% of 50 DAV
50 DAV is 127,400
|
$18.25
0.00%
|
3/15/2011
|
$15.48
|
PP = $15.90
|
|
MB = $16.70
|
Most Recent Note - 4/21/2011 6:06:43 PM
G - Closed at the session high today and matched its all-time high with above average volume behind a 7th consecutive gain. It is extended from any sound base pattern, meanwhile its 50 DMA line and prior highs define important support to watch.
>>> The latest Featured Stock Update with an annotated graph appeared on 4/12/2011. Click here.
View all notes |
Alert me of new notes |
CANSLIM.net Company Profile |
SEC |
Zacks Reports |
StockTalk |
News |
Chart |
Request a new note
C
A N
S L
I M
|
MWIV
-
NASDAQ
M W I Veterinary Supply
HEALTH SERVICES - Medical Instruments and; Supplies
|
$84.25
|
+1.07
1.29% |
$84.97
|
151,054
156.37% of 50 DAV
50 DAV is 96,600
|
$83.19
1.27%
|
11/4/2010
|
$61.79
|
PP = $59.60
|
|
MB = $62.58
|
Most Recent Note - 4/21/2011 3:12:41 PM
G - Up with above average volume today for yet another new all-time high, getting more extended from any sound base. Its 50 DMA line defines important support to watch.
>>> The latest Featured Stock Update with an annotated graph appeared on 4/8/2011. Click here.
View all notes |
Alert me of new notes |
CANSLIM.net Company Profile |
SEC |
Zacks Reports |
StockTalk |
News |
Chart |
Request a new note
C
A N
S L
I M
|
OPEN
-
NASDAQ
Opentable Inc
INTERNET - Internet Software and Services
|
$115.30
|
+4.01
3.60% |
$115.90
|
1,384,671
105.14% of 50 DAV
50 DAV is 1,317,000
|
$112.78
2.23%
|
3/17/2011
|
$90.71
|
PP = $96.07
|
|
MB = $100.87
|
Most Recent Note - 4/21/2011 3:08:58 PM
G - Today's considerable gain has it hitting a new all-time high. Repeatedly noted - "Extended from its latest base. Prior highs near $96 and its 50 DMA line define support to watch on pullbacks.
>>> The latest Featured Stock Update with an annotated graph appeared on 3/24/2011. Click here.
View all notes |
Alert me of new notes |
CANSLIM.net Company Profile |
SEC |
Zacks Reports |
StockTalk |
News |
Chart |
Request a new note
C
A N
S L
I M
|
Symbol/Exchange
Company Name
Industry Group |
PRICE |
CHANGE
(%Change) |
Day High |
Volume
(% DAV)
(% 50 day avg vol) |
52 Wk Hi
% From Hi |
Featured
Date |
Price
Featured |
Pivot Featured |
|
Max Buy |
PAY
-
NYSE
Verifone Systems Inc
COMPUTER HARDWARE - Transaction Automation Systems
|
$53.57
|
+0.52
0.98% |
$53.71
|
1,413,016
58.85% of 50 DAV
50 DAV is 2,400,900
|
$58.88
-9.02%
|
1/27/2011
|
$41.77
|
PP = $44.97
|
|
MB = $47.22
|
Most Recent Note - 4/20/2011 5:39:05 PM
G - Small gap up today, still quietly consolidating above its 50 DMA line ($50.64 now) defining important chart support to watch.
>>> The latest Featured Stock Update with an annotated graph appeared on 4/4/2011. Click here.
View all notes |
Alert me of new notes |
CANSLIM.net Company Profile |
SEC |
Zacks Reports |
StockTalk |
News |
Chart |
Request a new note
C
A N
S L
I M
|
PCLN
-
NASDAQ
Priceline.Com Inc
INTERNET - Internet Software and Services
|
$543.95
|
+12.60
2.37% |
$544.27
|
901,526
75.11% of 50 DAV
50 DAV is 1,200,300
|
$537.00
1.29%
|
1/3/2011
|
$399.55
|
PP = $428.20
|
|
MB = $449.61
|
Most Recent Note - 4/21/2011 6:09:18 PM
G - Closed near the session high today and hit a new 52-week high with a 3rd consecutive gain on below average volume. Without great volume conviction behind any recent gains, it has been repeatedly noted - "Extended from any sound base pattern. Its 50 DMA line has defined support throughout its advance."
>>> The latest Featured Stock Update with an annotated graph appeared on 4/20/2011. Click here.
View all notes |
Alert me of new notes |
CANSLIM.net Company Profile |
SEC |
Zacks Reports |
StockTalk |
News |
Chart |
Request a new note
C
A N
S L
I M
|
RAX
-
NYSE
Rackspace Hosting Inc
INTERNET - Internet Software and; Services
|
$44.69
|
+0.77
1.75% |
$44.88
|
1,513,108
87.18% of 50 DAV
50 DAV is 1,735,700
|
$44.80
-0.25%
|
3/16/2011
|
$36.28
|
PP = $40.72
|
|
MB = $42.76
|
Most Recent Note - 4/20/2011 12:47:23 PM
G - Gapped up and hit a new all-time high today following a brief consolidation during which volume totals cooled after its latest breakout. Prior highs near $40 define support above its 50 DMA line. See the latest FSU analysis for additional details and a new annotated graph.
>>> The latest Featured Stock Update with an annotated graph appeared on 4/18/2011. Click here.
View all notes |
Alert me of new notes |
CANSLIM.net Company Profile |
SEC |
Zacks Reports |
StockTalk |
News |
Chart |
Request a new note
C
A N
S L
I M
|
TIBX
-
NASDAQ
Tibco Software Inc
COMPUTER SOFTWARE and SERVICES - Business Software and Services
|
$29.77
|
+0.37
1.26% |
$29.83
|
2,135,400
88.77% of 50 DAV
50 DAV is 2,405,600
|
$29.85
-0.27%
|
3/18/2011
|
$23.88
|
PP = $26.04
|
|
MB = $27.34
|
Most Recent Note - 4/20/2011 5:03:45 PM
G - Small gap up gain today with below average volume for its second best close. It is extended from a sound base after a spurt of volume-driven gains. As previously noted, support is defined by prior highs in the $25-26 area and its 50 DMA line.
>>> The latest Featured Stock Update with an annotated graph appeared on 4/14/2011. Click here.
View all notes |
Alert me of new notes |
CANSLIM.net Company Profile |
SEC |
Zacks Reports |
StockTalk |
News |
Chart |
Request a new note
C
A N
S L
I M
|
UA
-
NYSE
Under Armour Inc Cl A
CONSUMER NON-DURABLES - Textile - Apparel Clothing
|
$78.53
|
+0.08
0.10% |
$79.20
|
398,682
52.41% of 50 DAV
50 DAV is 760,700
|
$79.59
-1.33%
|
3/31/2011
|
$68.04
|
PP = $70.79
|
|
MB = $74.33
|
Most Recent Note - 4/20/2011 1:10:25 PM
G - Small gap up today following a strong finish for considerable gain on higher volume, hitting new all-time highs and getting more extended from its latest sound base pattern. Due to report earnings on the morning of Tuesday, April 26th for the latest quarter ended March 31, 2011. Prior highs in the $70 area define support to watch above its 50 DMA line.
>>> The latest Featured Stock Update with an annotated graph appeared on 4/1/2011. Click here.
View all notes |
Alert me of new notes |
CANSLIM.net Company Profile |
SEC |
Zacks Reports |
StockTalk |
News |
Chart |
Request a new note
C
A N
S L
I M
|
Symbol/Exchange
Company Name
Industry Group |
PRICE |
CHANGE
(%Change) |
Day High |
Volume
(% DAV)
(% 50 day avg vol) |
52 Wk Hi
% From Hi |
Featured
Date |
Price
Featured |
Pivot Featured |
|
Max Buy |
ULTA
-
NASDAQ
Ulta Salon Cosm & Frag
SPECIALTY RETAIL - Specialty Retail, Other
|
$52.88
|
-0.14
-0.26% |
$53.99
|
423,349
69.55% of 50 DAV
50 DAV is 608,700
|
$53.11
-0.43%
|
1/6/2011
|
$36.12
|
PP = $37.34
|
|
MB = $39.21
|
Most Recent Note - 4/20/2011 11:29:14 AM
G - Gapped up and hit a new all-time high today. It is extended from any sound base. Its 50 DMA line defines chart support to watch well above prior highs.
>>> The latest Featured Stock Update with an annotated graph appeared on 3/29/2011. Click here.
View all notes |
Alert me of new notes |
CANSLIM.net Company Profile |
SEC |
Zacks Reports |
StockTalk |
News |
Chart |
Request a new note
C
A N
S L
I M
|
|
|
|
THESE ARE NOT BUY RECOMMENDATIONS!
Comments contained in the body of this report are technical
opinions only. The material herein has been obtained
from sources believed to be reliable and accurate, however,
its accuracy and completeness cannot be guaranteed.
This site is not an investment advisor, hence it does
not endorse or recommend any securities or other investments.
Any recommendation contained in this report may not
be suitable for all investors and it is not to be deemed
an offer or solicitation on our part with respect to
the purchase or sale of any securities. All trademarks,
service marks and trade names appearing in this report
are the property of their respective owners, and are
likewise used for identification purposes only.
This report is a service available
only to active Paid Premium Members.
You may opt-out of receiving report notifications
at any time. Questions or comments may be submitted
by writing to Premium Membership Services 665 S.E. 10 Street, Suite 201 Deerfield Beach, FL 33441-5634 or by calling 1-800-965-8307
or 954-785-1121.
|
|
|

