You are not logged in.
This means you
CAN ONLY VIEW reports that were published prior to Monday, April 14, 2025.
You
MUST UPGRADE YOUR MEMBERSHIP if you want to see any current reports.
AFTER MARKET UPDATE - WEDNESDAY, APRIL 20TH, 2011
Previous After Market Report Next After Market Report >>>
|
|
|
|
DOW |
+186.79 |
12,453.54 |
+1.52% |
|
Volume |
967,899,660 |
+15% |
|
Volume |
2,027,653,640 |
+24% |
|
NASDAQ |
+57.54 |
2,802.51 |
+2.10% |
|
Advancers |
2,496 |
80% |
|
Advancers |
2,016 |
73% |
|
S&P 500 |
+17.74 |
1,330.36 |
+1.35% |
|
Decliners |
521 |
17% |
|
Decliners |
637 |
23% |
|
Russell 2000 |
+16.44 |
839.45 |
+2.00% |
|
52 Wk Highs |
193 |
|
|
52 Wk Highs |
133 |
|
|
S&P 600 |
+8.33 |
444.29 |
+1.91% |
|
52 Wk Lows |
16 |
|
|
52 Wk Lows |
29 |
|
|
After the daily screen and expert noting process was completed today, a malfunction prevented us from publishing and announcing the mid-day report's availability. No new stocks were featured in yellow. Since the mid-day report was introduced in December 2003, on only a handful of very-stressful occasions have technical difficulties prevented us from getting it out well before the session close. We sincerely apologize for any confusion or inconvenience this may have caused our valued members, and we greatly appreciate your understanding. If you have any feedback on how we are doing, please let us know via the inquiry form. Thank you.
How else might upgraded CANSLIM.net members look for our experts' most timely analysis on current market leaders? Here are two suggestions:
Go to the Featured Stocks page and click on the column heading for "Featured Date" to sort the list, and carefully study the stocks with the most recent dates. Review the prior notes, feature articles and annotated graphs recently published for stocks which are closest to their pivot points via the Company Profile links. Also review the most recently noted stocks designated by the small yellow "New" graphic next to the timestamp on the latest notes.
Go to the Breakouts Page and click on the column heading for "% of DAV" and review the stocks with the biggest volume increase. Study the most recently noted stocks designated by the small yellow "New" graphic next to the timestamp on the latest notes.
This recent "Ken's Mailbag" article may help new members to better interpret what is presented in our premium reports. Please make sure you've taken time to read it.
|
 |
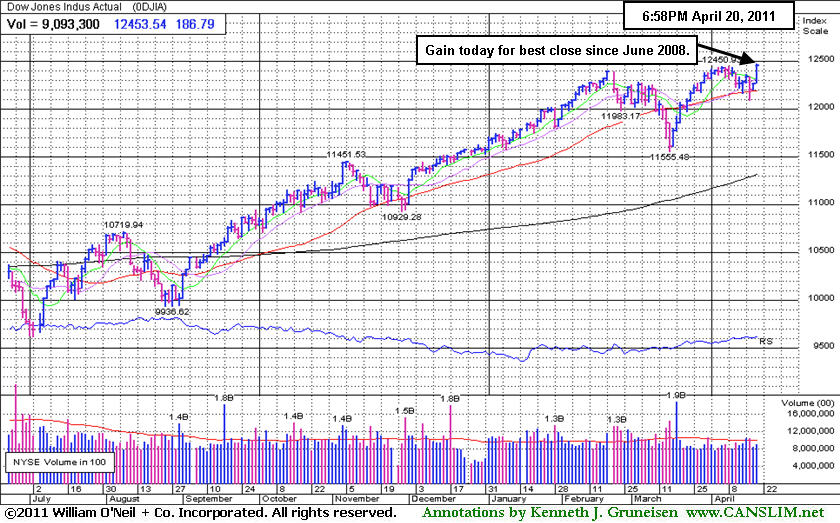
Dow Industrials Hit New Recovery High
Kenneth J. Gruneisen - Passed the CAN SLIM® Master's Exam
The Dow Jones Industrial Average rose to its best level since June 2008 and approached a three-year high, and the Nasdaq Composite Index traded up for its biggest jump in six months. As the major averages charged higher, the level of buying conviction or "accumulation" from institutional investors picked up, as evidenced by higher volume totals on both major exchanges Wednesday versus the prior session's totals. Advancing issues beat decliners on the NYSE by more than a 4-1 ratio and by more than a 3-1 ratio on the Nasdaq exchange. New 52-week highs outnumbered new 52-week lows on the NYSE and on the Nasdaq exchange. There were 84 high-ranked companies from the CANSLIM.net Leaders List that made new 52-week highs and appeared on the CANSLIM.net BreakOuts Page, up considerably from the total of 33 on the prior session. On the Featured Stocks Page there were gains from 19 of the 21 high-ranked market leaders currently listed.
A report from the National Association of Realtors showed sales of existing U.S. homes gained 3.7%, more than expected in March, even though the median price declined from a year earlier. The improvement followed an 8.9% decline the previous month. Strong earnings and higher commodities underpinned a broad-based rally. Chevron Corp (CVX +2.29%) and other energy-related shares rose as crude oil advanced more than $3 aper barrel. Gold rose to another new record above $1,500 as the dollar weakened.
On one of the busiest reporting days of the quarter, encouraging results came from Intel Corp (INTC +7.80%) and United Technologies Corp (UTX +4.3%), putting both among the best performing Dow components as both companies gave positive profit forecasts. International Business Machines Corp. (IBM -0.39%) beat earnings expectations, but shares fell after the company said it signed fewer overseas contracts. AT&T, Inc (T -0.59%) also sank as new contract customers fell from a year ago. In merger news, utility company The AES Corporation (AES +3.29%) agreed to buy DPL Inc (DPL +9.35%) for $3.5 billion.
PICTURED: The Dow Jones Industrial Average's considerable gain came on higher (but below average) volume as it spiked to levels not seen since June 2008.
|
 Kenneth J. Gruneisen started out as a licensed stockbroker in August 1987, a couple of months prior to the historic stock market crash that took the Dow Jones Industrial Average down -22.6% in a single day. He has published daily fact-based fundamental and technical analysis on high-ranked stocks online for two decades. Through FACTBASEDINVESTING.COM, Kenneth provides educational articles, news, market commentary, and other information regarding proven investment systems that work in good times and bad.
Comments contained in the body of this report are technical opinions only and are not necessarily those of Gruneisen Growth Corp. The material herein has been obtained from sources believed to be reliable and accurate, however, its accuracy and completeness cannot be guaranteed. Our firm, employees, and customers may effect transactions, including transactions contrary to any recommendation herein, or have positions in the securities mentioned herein or options with respect thereto. Any recommendation contained in this report may not be suitable for all investors and it is not to be deemed an offer or solicitation on our part with respect to the purchase or sale of any securities. |
|
 |
Semiconductor Index Rallied Above 50-Day Average
Kenneth J. Gruneisen - Passed the CAN SLIM® Master's Exam
The Bank Index ($BKX -0.48%) was a standout laggard as it slumped to a new 2011 low, meanwhile strength in the Broker/Dealer Index ($XBD +2.05%) and Retail Index ($RLX +1.44%) and a positive bias in the tech sector boosted the tech-heavy Nasdaq Composite Index and the small cap indexes. The Biotechnology Index ($BTK +1.85%), Internet Index ($IIX +2.31%), and Networking Index ($NWX +2.96%) posted solid gains while the Semiconductor Index ($SOX +4.27%) was a standout tech gainer. Commodity-linked groups and defensive areas were also on the rise as the Integrated Oil Index ($XOI +2.45%), Oil Services Index ($OSX +0.93%), Gold & Silver Index ($XAU +1.05%), and Healthcare Index ($HMO +1.17%) rounded out a widely positive session with solid gains.
Charts courtesy www.stockcharts.com
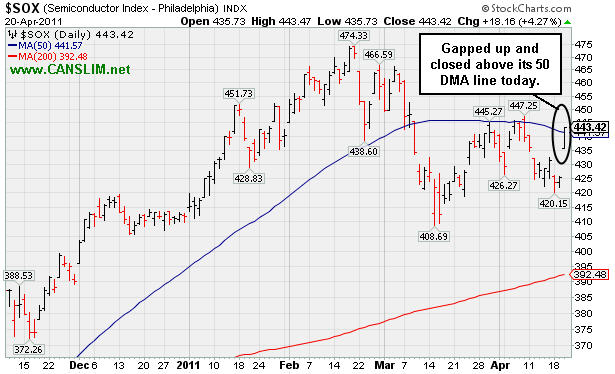
PICTURED: The Semiconductor Index ($SOX +4.27%) gapped up and closed above its 50-day moving average (DMA) line, largely inspired by a big gain from Intel Corp (INTC +7.8%) after encouraging earnings news.
| Oil Services |
$OSX |
287.58 |
+2.66 |
+0.93% |
+17.32% |
| Healthcare |
$HMO |
2,158.35 |
+24.91 |
+1.17% |
+27.56% |
| Integrated Oil |
$XOI |
1,358.18 |
+32.54 |
+2.45% |
+11.95% |
| Semiconductor |
$SOX |
443.42 |
+18.16 |
+4.27% |
+7.67% |
| Networking |
$NWX |
332.52 |
+9.55 |
+2.96% |
+18.52% |
| Internet |
$IIX |
321.78 |
+7.26 |
+2.31% |
+4.57% |
| Broker/Dealer |
$XBD |
119.47 |
+2.40 |
+2.05% |
-1.69% |
| Retail |
$RLX |
533.01 |
+7.57 |
+1.44% |
+4.84% |
| Gold & Silver |
$XAU |
222.78 |
+2.31 |
+1.05% |
-1.68% |
| Bank |
$BKX |
50.26 |
-0.24 |
-0.48% |
-3.73% |
| Biotech |
$BTK |
1,423.30 |
+25.87 |
+1.85% |
+9.68% |
|
|
|
 |
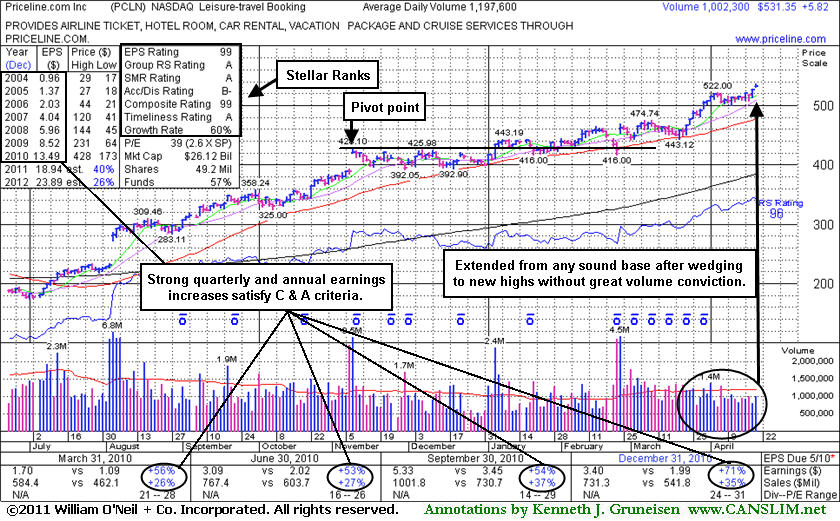
Extended Leader Already Familiar Among Institutional Crowd
Kenneth J. Gruneisen - Passed the CAN SLIM® Master's Exam
Priceline.com Inc. (PCLN +$5.82 or +1.11% to $531.35) gapped up today for a new 52-week high, rallying or "wedging" higher without great volume conviction. It could go on to produce more climactic gains, but disciplined investors know that it is usually best to avoid chasing extended stocks. It has been repeatedly noted - "Extended from any sound base pattern. Its 50 DMA line has defined support throughout its advance." Since its last appearance in this FSU section with an annotated graph on 3/21/11 under the headline, "Positive Reversal For Small Gain Today Right at 50-Day Average", it found support its 50-day moving average (DMA) line. Most of its gains in the interim have come with near average or lighter than average volume. It also has not encountered any recent distributional pressure.
The number of top-rated funds owning its shares rose from 1,350 in Sep '10 to 1,491 in Mar '11, and increasing interest is an encouraging sign concerning the I criteria. The investment system's biggest winning models were typically held by at least a few mutual funds and attracting many others. However, once a stock is very heavily owned by a long list of mutual funds, as is now the case with PCLN, investors should be especially cautious and alert for any technical sell signals or fundamental disappointments which could prompt a rush for the exits.
|
|
|
Color Codes Explained :
Y - Better candidates highlighted by our
staff of experts.
G - Previously featured
in past reports as yellow but may no longer be buyable under the
guidelines.
***Last / Change / Volume data in this table is the closing quote data***
Symbol/Exchange
Company Name
Industry Group |
PRICE |
CHANGE
(%Change) |
Day High |
Volume
(% DAV)
(% 50 day avg vol) |
52 Wk Hi
% From Hi |
Featured
Date |
Price
Featured |
Pivot Featured |
|
Max Buy |
AIXG
-
NASDAQ
Aixtron Se
ELECTRONICS - Semiconductor Equipment andamp; Mate
|
$41.77
|
+1.77
4.43% |
$42.09
|
385,575
150.15% of 50 DAV
50 DAV is 256,800
|
$44.96
-7.10%
|
4/5/2011
|
$44.14
|
PP = $44.64
|
|
MB = $46.87
|
 Most Recent Note - 4/20/2011 11:34:07 AM
G - Gapped up today after finding support near prior lows in the $38 area. Its 50 DMA line may now act as resistance, while a convincing rebound above that important short-term average would help its outlook.
>>> The latest Featured Stock Update with an annotated graph appeared on 4/5/2011. Click here.
View all notes |
Alert me of new notes |
CANSLIM.net Company Profile |
SEC |
Zacks Reports |
StockTalk |
News |
Chart |
Request a new note
C
A N
S L
I M


|
BIDU
-
NASDAQ
Baidu Inc Ads
INTERNET - Internet Information Providers
|
$149.31
|
-0.59
-0.39% |
$154.00
|
7,660,675
110.72% of 50 DAV
50 DAV is 6,918,900
|
$150.00
-0.46%
|
3/17/2011
|
$121.97
|
PP = $131.73
|
|
MB = $138.32
|
Most Recent Note - 4/20/2011 11:53:51 AM
G - Touched yet another new all-time high today. It is extended from its latest base, and the prior high near $131 defines initial chart support to watch near its rising 50 DMA line.
>>> The latest Featured Stock Update with an annotated graph appeared on 4/7/2011. Click here.
View all notes |
Alert me of new notes |
CANSLIM.net Company Profile |
SEC |
Zacks Reports |
StockTalk |
News |
Chart |
Request a new note
C
A N
S L
I M
|
CMG
-
NYSE
Chipotle Mexican Grill
LEISURE - Restaurants
|
$288.10
|
+8.25
2.95% |
$289.35
|
2,222,726
200.46% of 50 DAV
50 DAV is 1,108,800
|
$285.97
0.74%
|
4/1/2011
|
$274.00
|
PP = $275.10
|
|
MB = $288.86
|
Most Recent Note - 4/20/2011 4:55:59 PM
Y - Today's gain with +61% above average volume helped it rally for a new high and triggered a technical buy signal. It finished near its "max buy" level. Its 50 DMA line ($261.20 now) defines important chart support to watch.
>>> The latest Featured Stock Update with an annotated graph appeared on 4/13/2011. Click here.
View all notes |
Alert me of new notes |
CANSLIM.net Company Profile |
SEC |
Zacks Reports |
StockTalk |
News |
Chart |
Request a new note
C
A N
S L
I M
|
CTCT
-
NASDAQ
Constant Contact Inc
MEDIA - Advertising Services
|
$30.73
|
+0.60
1.99% |
$31.01
|
400,539
91.14% of 50 DAV
50 DAV is 439,500
|
$36.33
-15.41%
|
3/22/2011
|
$33.59
|
PP = $32.49
|
|
MB = $34.11
|
Most Recent Note - 4/20/2011 5:42:52 PM
G - Small gain today with light volume following 2 damaging losses with heavy volume in prior 3 sessions. Concerns were raised as it completely negated its recent breakout, slumping below its 50 DMA line again and triggering worrisome technical sell signals. Due to report earnings after the close on Thursday, April 28th. See the latest FSU analysis for details and a new annotated graph.
>>> The latest Featured Stock Update with an annotated graph appeared on 4/19/2011. Click here.
View all notes |
Alert me of new notes |
CANSLIM.net Company Profile |
SEC |
Zacks Reports |
StockTalk |
News |
Chart |
Request a new note
C
A N
S L
I M
|
CTSH
-
NASDAQ
Cognizant Tech Sol Cl A
COMPUTER SOFTWARE and SERVICES - Business Software and Services
|
$82.04
|
+2.76
3.48% |
$82.06
|
1,968,605
87.11% of 50 DAV
50 DAV is 2,259,800
|
$82.86
-0.99%
|
2/7/2011
|
$75.09
|
PP = $76.46
|
|
MB = $80.28
|
Most Recent Note - 4/20/2011 4:50:19 PM
G - Gapped up today, rallying with below average volume to finish -1% off its all-time high. This week it tested prior highs in the $77-78 area and its 50 DMA line and found prompt support. See the latest FSU analysis for more details and a new annotated graph.
>>> The latest Featured Stock Update with an annotated graph appeared on 4/15/2011. Click here.
View all notes |
Alert me of new notes |
CANSLIM.net Company Profile |
SEC |
Zacks Reports |
StockTalk |
News |
Chart |
Request a new note
C
A N
S L
I M
|
Symbol/Exchange
Company Name
Industry Group |
PRICE |
CHANGE
(%Change) |
Day High |
Volume
(% DAV)
(% 50 day avg vol) |
52 Wk Hi
% From Hi |
Featured
Date |
Price
Featured |
Pivot Featured |
|
Max Buy |
DECK
-
NASDAQ
Deckers Outdoor Corp
CONSUMER NON-DURABLES - Textile - Apparel Footwear
|
$95.76
|
+2.64
2.84% |
$95.99
|
958,140
70.48% of 50 DAV
50 DAV is 1,359,500
|
$95.49
0.28%
|
2/3/2011
|
$79.61
|
PP = $82.67
|
|
MB = $86.80
|
Most Recent Note - 4/20/2011 4:51:35 PM
G - Gapped up today and hit a new all-time high with a gain on light volume while rising from a shorter than minimum length "cup-with-handle" type consolidation. Its 50 DMA line defines initial chart support to watch.
>>> The latest Featured Stock Update with an annotated graph appeared on 4/6/2011. Click here.
View all notes |
Alert me of new notes |
CANSLIM.net Company Profile |
SEC |
Zacks Reports |
StockTalk |
News |
Chart |
Request a new note
C
A N
S L
I M
|
EZPW
-
NASDAQ
Ezcorp Inc Cl A
SPECIALTY RETAIL - Specialty Retail, Other
|
$29.30
|
+0.31
1.07% |
$29.48
|
310,498
89.71% of 50 DAV
50 DAV is 346,100
|
$33.08
-11.43%
|
2/18/2011
|
$27.94
|
PP = $30.04
|
|
MB = $31.54
|
Most Recent Note - 4/20/2011 5:44:23 PM
G - Gain with below average volume today, rising to a close back above its 50 DMA line. Recently slumped under prior highs in the $29-30 area previously noted as important support to watch.
>>> The latest Featured Stock Update with an annotated graph appeared on 4/11/2011. Click here.
View all notes |
Alert me of new notes |
CANSLIM.net Company Profile |
SEC |
Zacks Reports |
StockTalk |
News |
Chart |
Request a new note
C
A N
S L
I M
|
FOSL
-
NASDAQ
Fossil Inc
CONSUMER DURABLES - Recreational Goods, Other
|
$95.95
|
+3.55
3.84% |
$96.76
|
730,790
73.00% of 50 DAV
50 DAV is 1,001,100
|
$95.39
0.59%
|
2/1/2011
|
$73.30
|
PP = $74.44
|
|
MB = $78.16
|
Most Recent Note - 4/20/2011 11:31:25 AM
G - Gapped up today and hit a new all-time high. Previously noted - "It rallied more than +108% higher in 8 months since first featured in yellow in the 8/10/10 mid-day report (read here). It could produce more climactic gains, but recently it has been noted - "Extended from any sound base. Prior highs in the $83-85 area define chart support to watch above its 50 DMA line."
>>> The latest Featured Stock Update with an annotated graph appeared on 3/30/2011. Click here.
View all notes |
Alert me of new notes |
CANSLIM.net Company Profile |
SEC |
Zacks Reports |
StockTalk |
News |
Chart |
Request a new note
C
A N
S L
I M
|
HMSY
-
NASDAQ
H M S Holdings Corp
COMPUTER SOFTWARE and SERVICES - Healthcare Information Service
|
$80.70
|
+0.30
0.37% |
$81.19
|
171,892
106.11% of 50 DAV
50 DAV is 162,000
|
$84.82
-4.86%
|
11/19/2010
|
$61.89
|
PP = $63.01
|
|
MB = $66.16
|
Most Recent Note - 4/20/2011 5:35:26 PM
G - Perched -4.9% below its all-time high today after churning slightly above average volume the past couple of sessions during its short consolidation above its 50 DMA line ($78.29 now).
>>> The latest Featured Stock Update with an annotated graph appeared on 3/25/2011. Click here.
View all notes |
Alert me of new notes |
CANSLIM.net Company Profile |
SEC |
Zacks Reports |
StockTalk |
News |
Chart |
Request a new note
C
A N
S L
I M
|
HS
-
NYSE
Healthspring Inc
HEALTH SERVICES - Health Care Plans
|
$38.70
|
+0.45
1.18% |
$39.05
|
488,637
56.86% of 50 DAV
50 DAV is 859,400
|
$40.78
-5.10%
|
3/22/2011
|
$38.29
|
PP = $38.85
|
|
MB = $40.79
|
Most Recent Note - 4/20/2011 5:16:37 PM
Y - Small gap up gain today on very light volume. Its pullback below its pivot point last week technically negated its 4/01/11 breakout. Its nearby 50 DMA line ($37.03 now) defines important support above recent lows in the $35.50 area.
>>> The latest Featured Stock Update with an annotated graph appeared on 3/23/2011. Click here.
View all notes |
Alert me of new notes |
CANSLIM.net Company Profile |
SEC |
Zacks Reports |
StockTalk |
News |
Chart |
Request a new note
C
A N
S L
I M
|
Symbol/Exchange
Company Name
Industry Group |
PRICE |
CHANGE
(%Change) |
Day High |
Volume
(% DAV)
(% 50 day avg vol) |
52 Wk Hi
% From Hi |
Featured
Date |
Price
Featured |
Pivot Featured |
|
Max Buy |
INFA
-
NASDAQ
Informatica Corp
COMPUTER SOFTWARE and SERVICES - Business Software and Services
|
$53.00
|
+1.51
2.93% |
$53.06
|
1,392,883
158.16% of 50 DAV
50 DAV is 880,700
|
$53.95
-1.76%
|
3/24/2011
|
$50.04
|
PP = $49.86
|
|
MB = $52.35
|
Most Recent Note - 4/20/2011 12:26:32 PM
G - Gapped up today, rising back above its "max buy" level. Prior highs in the $49 area define support to watch coinciding with its 50 DMA line. Subsequent violations would raise concerns and may trigger technical sell signals.
>>> The latest Featured Stock Update with an annotated graph appeared on 3/28/2011. Click here.
View all notes |
Alert me of new notes |
CANSLIM.net Company Profile |
SEC |
Zacks Reports |
StockTalk |
News |
Chart |
Request a new note
C
A N
S L
I M
|
LULU
-
NASDAQ
Lululemon Athletica
MANUFACTURING - Textile Manufacturing
|
$99.73
|
-0.53
-0.53% |
$101.98
|
2,298,235
100.56% of 50 DAV
50 DAV is 2,285,500
|
$101.40
-1.65%
|
3/28/2011
|
$68.11
|
PP = $85.38
|
|
MB = $89.65
|
Most Recent Note - 4/20/2011 5:46:27 PM
G - Touched a new all-time high today and then paused after considerable back-to-back gains with above average volume. This high-ranked Retail-Apparel firm is extended from any sound base pattern. Prior highs in the $85 area define initial chart support to watch.
>>> The latest Featured Stock Update with an annotated graph appeared on 3/31/2011. Click here.
View all notes |
Alert me of new notes |
CANSLIM.net Company Profile |
SEC |
Zacks Reports |
StockTalk |
News |
Chart |
Request a new note
C
A N
S L
I M
|
MG
-
NYSE
Mistras Group Inc
DIVERSIFIED SERVICES - Bulding and Faci;ity Management Services
|
$17.95
|
+0.05
0.28% |
$18.11
|
67,765
53.19% of 50 DAV
50 DAV is 127,400
|
$18.25
-1.64%
|
3/15/2011
|
$15.48
|
PP = $15.90
|
|
MB = $16.70
|
Most Recent Note - 4/20/2011 5:37:15 PM
G - Holding its ground and inching higher today with lighter than average volume. It is extended from any sound base pattern, meanwhile its 50 DMA line and prior highs define important support to watch.
>>> The latest Featured Stock Update with an annotated graph appeared on 4/12/2011. Click here.
View all notes |
Alert me of new notes |
CANSLIM.net Company Profile |
SEC |
Zacks Reports |
StockTalk |
News |
Chart |
Request a new note
C
A N
S L
I M
|
MWIV
-
NASDAQ
M W I Veterinary Supply
HEALTH SERVICES - Medical Instruments and; Supplies
|
$83.18
|
+2.58
3.20% |
$83.19
|
95,275
98.63% of 50 DAV
50 DAV is 96,600
|
$81.63
1.90%
|
11/4/2010
|
$61.79
|
PP = $59.60
|
|
MB = $62.58
|
Most Recent Note - 4/20/2011 5:00:44 PM
G - Gapped up today for a gain with average volume for a new all-time high, getting more extended from any sound base. Its 50 DMA line defines important support to watch.
>>> The latest Featured Stock Update with an annotated graph appeared on 4/8/2011. Click here.
View all notes |
Alert me of new notes |
CANSLIM.net Company Profile |
SEC |
Zacks Reports |
StockTalk |
News |
Chart |
Request a new note
C
A N
S L
I M
|
OPEN
-
NASDAQ
Opentable Inc
INTERNET - Internet Software and Services
|
$111.29
|
+4.89
4.60% |
$111.46
|
1,192,087
90.52% of 50 DAV
50 DAV is 1,317,000
|
$112.78
-1.32%
|
3/17/2011
|
$90.71
|
PP = $96.07
|
|
MB = $100.87
|
Most Recent Note - 4/20/2011 11:41:55 AM
G - Gapped up today, challenging its all-time high hit on 4/06/11 as it negatively reversed on heavy volume. Repeatedly noted - "Extended from its latest base. Prior highs near $96 and its 50 DMA line define support to watch on pullbacks.
>>> The latest Featured Stock Update with an annotated graph appeared on 3/24/2011. Click here.
View all notes |
Alert me of new notes |
CANSLIM.net Company Profile |
SEC |
Zacks Reports |
StockTalk |
News |
Chart |
Request a new note
C
A N
S L
I M
|
Symbol/Exchange
Company Name
Industry Group |
PRICE |
CHANGE
(%Change) |
Day High |
Volume
(% DAV)
(% 50 day avg vol) |
52 Wk Hi
% From Hi |
Featured
Date |
Price
Featured |
Pivot Featured |
|
Max Buy |
PAY
-
NYSE
Verifone Systems Inc
COMPUTER HARDWARE - Transaction Automation Systems
|
$53.05
|
+0.80
1.53% |
$53.43
|
1,393,712
58.05% of 50 DAV
50 DAV is 2,400,900
|
$58.88
-9.90%
|
1/27/2011
|
$41.77
|
PP = $44.97
|
|
MB = $47.22
|
Most Recent Note - 4/20/2011 5:39:05 PM
G - Small gap up today, still quietly consolidating above its 50 DMA line ($50.64 now) defining important chart support to watch.
>>> The latest Featured Stock Update with an annotated graph appeared on 4/4/2011. Click here.
View all notes |
Alert me of new notes |
CANSLIM.net Company Profile |
SEC |
Zacks Reports |
StockTalk |
News |
Chart |
Request a new note
C
A N
S L
I M
|
PCLN
-
NASDAQ
Priceline.Com Inc
INTERNET - Internet Software and Services
|
$531.35
|
+5.82
1.11% |
$537.00
|
1,011,882
84.30% of 50 DAV
50 DAV is 1,200,300
|
$525.57
1.10%
|
1/3/2011
|
$399.55
|
PP = $428.20
|
|
MB = $449.61
|
Most Recent Note - 4/20/2011 5:40:40 PM
G - Gapped up today for a new 52-week high without great volume conviction behind any recent gains. Repeatedly noted - "Extended from any sound base pattern. Its 50 DMA line has defined support throughout its advance."
>>> The latest Featured Stock Update with an annotated graph appeared on 4/20/2011. Click here.
View all notes |
Alert me of new notes |
CANSLIM.net Company Profile |
SEC |
Zacks Reports |
StockTalk |
News |
Chart |
Request a new note
C
A N
S L
I M
|
RAX
-
NYSE
Rackspace Hosting Inc
INTERNET - Internet Software and; Services
|
$43.92
|
+1.74
4.13% |
$44.80
|
2,291,182
132.00% of 50 DAV
50 DAV is 1,735,700
|
$44.19
-0.61%
|
3/16/2011
|
$36.28
|
PP = $40.72
|
|
MB = $42.76
|
Most Recent Note - 4/20/2011 12:47:23 PM
G - Gapped up and hit a new all-time high today following a brief consolidation during which volume totals cooled after its latest breakout. Prior highs near $40 define support above its 50 DMA line. See the latest FSU analysis for additional details and a new annotated graph.
>>> The latest Featured Stock Update with an annotated graph appeared on 4/18/2011. Click here.
View all notes |
Alert me of new notes |
CANSLIM.net Company Profile |
SEC |
Zacks Reports |
StockTalk |
News |
Chart |
Request a new note
C
A N
S L
I M
|
TIBX
-
NASDAQ
Tibco Software Inc
COMPUTER SOFTWARE and SERVICES - Business Software and Services
|
$29.40
|
+0.84
2.94% |
$29.49
|
2,131,814
88.62% of 50 DAV
50 DAV is 2,405,600
|
$29.85
-1.51%
|
3/18/2011
|
$23.88
|
PP = $26.04
|
|
MB = $27.34
|
Most Recent Note - 4/20/2011 5:03:45 PM
G - Small gap up gain today with below average volume for its second best close. It is extended from a sound base after a spurt of volume-driven gains. As previously noted, support is defined by prior highs in the $25-26 area and its 50 DMA line.
>>> The latest Featured Stock Update with an annotated graph appeared on 4/14/2011. Click here.
View all notes |
Alert me of new notes |
CANSLIM.net Company Profile |
SEC |
Zacks Reports |
StockTalk |
News |
Chart |
Request a new note
C
A N
S L
I M
|
UA
-
NYSE
Under Armour Inc Cl A
CONSUMER NON-DURABLES - Textile - Apparel Clothing
|
$78.45
|
+0.65
0.84% |
$79.59
|
1,031,644
135.62% of 50 DAV
50 DAV is 760,700
|
$77.97
0.62%
|
3/31/2011
|
$68.04
|
PP = $70.79
|
|
MB = $74.33
|
Most Recent Note - 4/20/2011 1:10:25 PM
G - Small gap up today following a strong finish for considerable gain on higher volume, hitting new all-time highs and getting more extended from its latest sound base pattern. Due to report earnings on the morning of Tuesday, April 26th for the latest quarter ended March 31, 2011. Prior highs in the $70 area define support to watch above its 50 DMA line.
>>> The latest Featured Stock Update with an annotated graph appeared on 4/1/2011. Click here.
View all notes |
Alert me of new notes |
CANSLIM.net Company Profile |
SEC |
Zacks Reports |
StockTalk |
News |
Chart |
Request a new note
C
A N
S L
I M
|
Symbol/Exchange
Company Name
Industry Group |
PRICE |
CHANGE
(%Change) |
Day High |
Volume
(% DAV)
(% 50 day avg vol) |
52 Wk Hi
% From Hi |
Featured
Date |
Price
Featured |
Pivot Featured |
|
Max Buy |
ULTA
-
NASDAQ
Ulta Salon Cosm & Frag
SPECIALTY RETAIL - Specialty Retail, Other
|
$53.02
|
+3.24
6.51% |
$53.11
|
743,192
122.09% of 50 DAV
50 DAV is 608,700
|
$51.82
2.32%
|
1/6/2011
|
$36.12
|
PP = $37.34
|
|
MB = $39.21
|
Most Recent Note - 4/20/2011 11:29:14 AM
G - Gapped up and hit a new all-time high today. It is extended from any sound base. Its 50 DMA line defines chart support to watch well above prior highs.
>>> The latest Featured Stock Update with an annotated graph appeared on 3/29/2011. Click here.
View all notes |
Alert me of new notes |
CANSLIM.net Company Profile |
SEC |
Zacks Reports |
StockTalk |
News |
Chart |
Request a new note
C
A N
S L
I M
|
|
|
|
THESE ARE NOT BUY RECOMMENDATIONS!
Comments contained in the body of this report are technical
opinions only. The material herein has been obtained
from sources believed to be reliable and accurate, however,
its accuracy and completeness cannot be guaranteed.
This site is not an investment advisor, hence it does
not endorse or recommend any securities or other investments.
Any recommendation contained in this report may not
be suitable for all investors and it is not to be deemed
an offer or solicitation on our part with respect to
the purchase or sale of any securities. All trademarks,
service marks and trade names appearing in this report
are the property of their respective owners, and are
likewise used for identification purposes only.
This report is a service available
only to active Paid Premium Members.
You may opt-out of receiving report notifications
at any time. Questions or comments may be submitted
by writing to Premium Membership Services 665 S.E. 10 Street, Suite 201 Deerfield Beach, FL 33441-5634 or by calling 1-800-965-8307
or 954-785-1121.
|
|
|

