You are not logged in.
This means you
CAN ONLY VIEW reports that were published prior to Monday, April 14, 2025.
You
MUST UPGRADE YOUR MEMBERSHIP if you want to see any current reports.
AFTER MARKET UPDATE - FRIDAY, APRIL 19TH, 2013
Previous After Market Report Next After Market Report >>>
|
|
|
|
DOW |
+10.37 |
14,547.51 |
+0.07% |
|
Volume |
914,485,470 |
+15% |
|
Volume |
1,682,748,270 |
-2% |
|
NASDAQ |
+39.70 |
3,206.06 |
+1.25% |
|
Advancers |
2,189 |
70% |
|
Advancers |
1,684 |
66% |
|
S&P 500 |
+13.64 |
1,555.25 |
+0.88% |
|
Decliners |
817 |
26% |
|
Decliners |
780 |
31% |
|
Russell 2000 |
+10.99 |
912.50 |
+1.22% |
|
52 Wk Highs |
148 |
|
|
52 Wk Highs |
65 |
|
|
S&P 600 |
+6.16 |
510.86 |
+1.22% |
|
52 Wk Lows |
25 |
|
|
52 Wk Lows |
43 |
|
|
 |
Major Averages Managed Positive Reversal
Kenneth J. Gruneisen - Passed the CAN SLIM® Master's Exam
Despite Friday's gains, the Dow Jones Industrial and S&P 500 Index both declined -2.1% on the week while the Nasdaq Composite Index retreated -2.7%. The volume totals on the exchanges were reported mixed, higher than the prior session total on the NYSE and lower on the Nasdaq exchange. Breadth was positive as advancers led decliners by almost a 3-1 margin on the NYSE and by 2-1 on the Nasdaq exchange. New 52-week highs outnumbered new 52-week lows on the NYSE on the Nasdaq exchange. There were 27 high-ranked companies from the CANSLIM.net Leaders List making new 52-week highs and appearing on the CANSLIM.net BreakOuts Page, up from the prior session total of 10 stocks. There were gains for 9 of the 11 high-ranked companies currently included on the Featured Stocks Page.
The Dow recovered from being down as many as 93 points at its intra-day low Friday to close up 10 at 14,547. The S&P 500 added 14 points to 1,555. The Nasdaq Composite Index climbed 40 points to close at 3,206.
The major averages advanced to pare their weekly retreat as investors digested the latest earnings releases. Market participants also appeared preoccupied with the manhunt for a suspect in the Boston Marathon bombing.
On the earnings front, thirteen companies in the S&P 500 reported results. Capital One Financial Corp (COF +6.40%) rallied after posting earnings that beat projections. Kimberly-Clark (KMB +4.06%) gained after the maker of Kleenex tissues increased its full-year forecast. General Electric Co (GE -4.1%) and McDonald's Corp (MCD -1.95%) fell amid disappointment in their earnings releases. Telecom was the best performing sector with Verizon Communications Inc (VZ +2.6%) up. Tech was the notable laggard on the session. Shares of International Business Machines Inc (IBM -8.28%) dove after posting a rare earnings miss and reduced its full-year guidance. Google Inc (GOOG +4.43%) rose and Microsoft Corp (MSFT +3.39%) climbed after both companies posted earnings above consensus.
Treasuries were lower with the 10-year note down 5/32 to yield 1.70%.
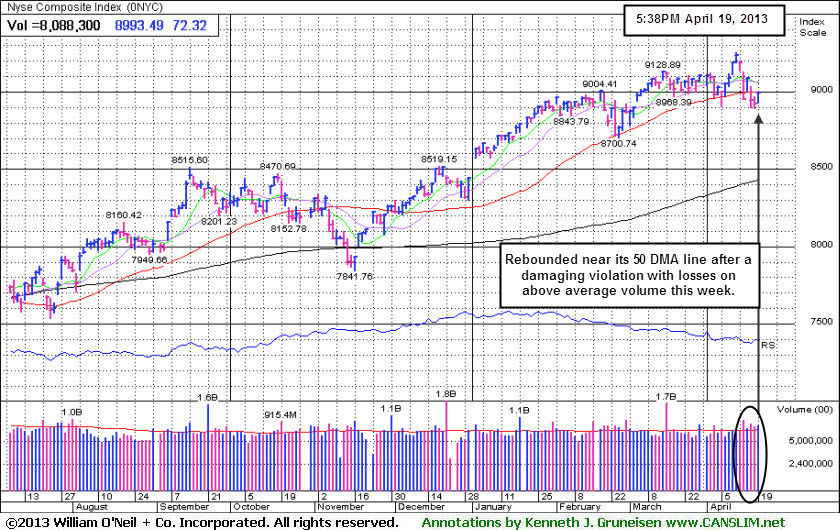
The market's (M criteria) quick evaporation of leadership (stocks hitting new 52-week highs) and decisive pullback on higher volume of late was a sign of more worrisome distributional pressure. The damaging action ended the latest rally. Investors should be watchful for technical sell signals and be ready to reduce market exposure. New buying efforts should be avoided until broader strength returns and until it is noted and there is again a follow-through day of meaningful gains from at least one of the major averages coupled with an expansion in leadership.
Watch for an announcement via email concerning the next WEBCAST. The webcast will also be available via an updated link highlighted at the top of the Premium Member Homepage.
PICTURED: The NYSE Composite Index rebounded near its 50-day moving average (DMA) line after damaging losses with above average volume this week led to a violation of that important short-term average.
|
 Kenneth J. Gruneisen started out as a licensed stockbroker in August 1987, a couple of months prior to the historic stock market crash that took the Dow Jones Industrial Average down -22.6% in a single day. He has published daily fact-based fundamental and technical analysis on high-ranked stocks online for two decades. Through FACTBASEDINVESTING.COM, Kenneth provides educational articles, news, market commentary, and other information regarding proven investment systems that work in good times and bad.
Comments contained in the body of this report are technical opinions only and are not necessarily those of Gruneisen Growth Corp. The material herein has been obtained from sources believed to be reliable and accurate, however, its accuracy and completeness cannot be guaranteed. Our firm, employees, and customers may effect transactions, including transactions contrary to any recommendation herein, or have positions in the securities mentioned herein or options with respect thereto. Any recommendation contained in this report may not be suitable for all investors and it is not to be deemed an offer or solicitation on our part with respect to the purchase or sale of any securities. |
|
 |
Biotech Index Jumps Higher, and Retail, Financial, Defensive Groups Rose
Kenneth J. Gruneisen - Passed the CAN SLIM® Master's Exam
The Retail Index ($RLX +0.95%), Broker/Dealer Index ($XBD +1.18%) and Bank Index ($BKX +1.52%) helped underpin the major averages' gains on Friday. The Networking Index ($NWX -0.08%) finished flat while the Internet Index ($IIX +0.51%), Semiconductor Index ($SOX +0.75%) posted small gains. Defensive groups had a positive bias as the Gold & Silver Index ($XAU +1.16%) and the Healthcare Index ($HMO +1.28%) posted gains. Energy-related shares were mixed as the Oil Services Index ($OSX -0.47%) ended modestly lower while the Integrated Oil Index ($XOI +0.24%) edged higher.
Charts courtesy www.stockcharts.com
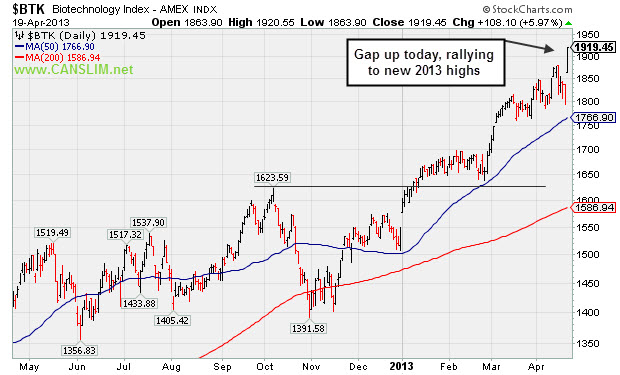
PICTURED: The Biotechnology Index ($BTK +5.97%) was a standout gainer on Friday, gapping up and rallying to new 2013 highs.
| Oil Services |
$OSX |
236.20 |
-1.11 |
-0.47% |
+7.29% |
| Healthcare |
$HMO |
2,873.19 |
+36.31 |
+1.28% |
+14.28% |
| Integrated Oil |
$XOI |
1,283.89 |
+3.09 |
+0.24% |
+3.39% |
| Semiconductor |
$SOX |
416.97 |
+3.09 |
+0.75% |
+8.57% |
| Networking |
$NWX |
215.54 |
-0.18 |
-0.08% |
-4.86% |
| Internet |
$IIX |
349.96 |
+1.79 |
+0.51% |
+7.02% |
| Broker/Dealer |
$XBD |
108.38 |
+1.26 |
+1.18% |
+14.90% |
| Retail |
$RLX |
734.94 |
+6.95 |
+0.95% |
+12.54% |
| Gold & Silver |
$XAU |
102.89 |
+1.18 |
+1.16% |
-37.87% |
| Bank |
$BKX |
54.85 |
+0.82 |
+1.52% |
+6.96% |
| Biotech |
$BTK |
1,919.45 |
+108.10 |
+5.97% |
+24.07% |
|
|
|
 |
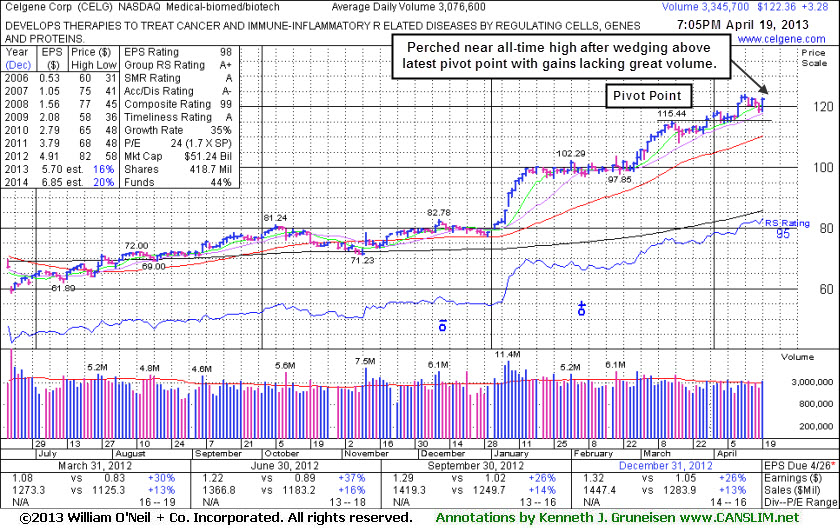
Perched Near All-Time High After Recent Gains Lacked Great Volume
Kenneth J. Gruneisen - Passed the CAN SLIM® Master's Exam
Celgene Corp (CELG +$3.28 or +2.75% to $122.36) is consolidating above its "max buy" level, holding its ground after wedging to new highs from an advanced "3-weeks tight" base with only average volume behind its recent gains. Its 50-day moving average (DMA) line defines important near-term support to watch. Its last appearance in this FSU section on 3/28/13 with an annotated graph under the headline, "Gains Lacked Volume While Wedging From Advanced "3-Weeks Tight" Pattern". Disciplined investors know that volume-driven gains above the pivot point are necessary to trigger a proper technical buy signal, and the minimum volume required behind a gain is +40% above average. The volume requirement is important because the market's best winners really had the look of institutional accumulation, the kind of heavy buying demand that can lead to a sustained and meaningful advance in share prices. While it may go on to produce more climactic gains, keep in mind that after its considerable rally in prior months, it may also be fair to consider it a riskier "late-stage" base.
CELG has maintained a strong earnings history (C and A criteria), and it recently reported earnings +26% on +13% sales revenues for the Dec '12 quarter. The number of top-rated funds owning its shares rose from 1,623 in Dec '11 to 1,791 in Mar '13, a reassuring trend concerning the I criteria. However, the company is already well-known by the institutional crowd. Its 50-day moving average (DMA) line defines important support to watch on pullbacks. It has not tested that short-term averages since finding support there in late December before embarking on a considerable winning streak.
|
|
|
Color Codes Explained :
Y - Better candidates highlighted by our
staff of experts.
G - Previously featured
in past reports as yellow but may no longer be buyable under the
guidelines.
***Last / Change / Volume data in this table is the closing quote data***
Symbol/Exchange
Company Name
Industry Group |
PRICE |
CHANGE
(%Change) |
Day High |
Volume
(% DAV)
(% 50 day avg vol) |
52 Wk Hi
% From Hi |
Featured
Date |
Price
Featured |
Pivot Featured |
|
Max Buy |
CELG
-
NASDAQ
Celgene Corp
DRUGS - Drug Manufacturers - Major
|
$122.36
|
+3.28
2.75% |
$122.88
|
3,345,727
108.37% of 50 DAV
50 DAV is 3,087,200
|
$124.10
-1.40%
|
3/27/2013
|
$113.24
|
PP = $115.54
|
|
MB = $121.32
|
 Most Recent Note - 4/19/2013 7:23:45 PM
G - Consolidating above its "max buy" level, holding its ground after wedging to new highs from an advanced "3-weeks tight" base with only average volume behind its gains. Its 50 DMA line defines important near-term support to watch. See the latest FSU analysis for more details and a new annotated graph.
>>> The latest Featured Stock Update with an annotated graph appeared on 4/19/2013. Click here.
View all notes |
Alert me of new notes |
CANSLIM.net Company Profile |
SEC |
Zacks Reports |
StockTalk |
News |
Chart |
Request a new note
C
A N
S L
I M


|
CFNL
-
NASDAQ
Cardinal Financial Corp
BANKING - Regional - Southeast Banks
|
$15.02
|
-0.66
-4.21% |
$15.60
|
746,501
362.38% of 50 DAV
50 DAV is 206,000
|
$18.40
-18.37%
|
3/22/2013
|
$17.99
|
PP = $18.29
|
|
MB = $19.20
|
Most Recent Note - 4/19/2013 7:25:38 PM
G - Slumped to its 200 DMA line today with another damaging loss on above average volume raising more serious concerns. A rebound above its 50 DMA line is needed to help its outlook improve.
>>> The latest Featured Stock Update with an annotated graph appeared on 4/10/2013. Click here.
View all notes |
Alert me of new notes |
CANSLIM.net Company Profile |
SEC |
Zacks Reports |
StockTalk |
News |
Chart |
Request a new note
C
A N
S L
I M
|
CMCSA
-
NASDAQ
Comcast Corp Cl A
MEDIA - CATV Systems
|
$40.56
|
+0.57
1.43% |
$40.61
|
14,530,570
102.19% of 50 DAV
50 DAV is 14,218,600
|
$42.61
-4.81%
|
12/3/2012
|
$37.08
|
PP = $38.06
|
|
MB = $39.96
|
Most Recent Note - 4/19/2013 12:11:14 PM
G - Rebounding toward its 50 DMA line today after violating that important short-term average with 2 prior losses marked by above average volume. A prompt rebound above its 50 DMA line is needed for its outlook to improve.
>>> The latest Featured Stock Update with an annotated graph appeared on 4/16/2013. Click here.
View all notes |
Alert me of new notes |
CANSLIM.net Company Profile |
SEC |
Zacks Reports |
StockTalk |
News |
Chart |
Request a new note
C
A N
S L
I M
|
EVER
-
NYSE
Everbank Financial Corp
BANKING
|
$14.17
|
-0.02
-0.14% |
$14.32
|
624,575
66.72% of 50 DAV
50 DAV is 936,100
|
$17.29
-18.05%
|
3/4/2013
|
$15.38
|
PP = $15.83
|
|
MB = $16.62
|
Most Recent Note - 4/19/2013 1:10:33 PM
Consolidating near its 200 DMA line and it will be dropped from the Featured Stocks list due to weak action. Its Relative Strength (RS) rating has slumped to 57, below the 80+ minimum guideline for buy candidates.
>>> The latest Featured Stock Update with an annotated graph appeared on 4/2/2013. Click here.
View all notes |
Alert me of new notes |
CANSLIM.net Company Profile |
SEC |
Zacks Reports |
StockTalk |
News |
Chart |
Request a new note
C
A N
S L
I M
|
FLT
-
NYSE
Fleetcor Technologies
DIVERSIFIED SERVICES - Business/Management Services
|
$73.44
|
+1.02
1.41% |
$73.59
|
928,755
110.65% of 50 DAV
50 DAV is 839,400
|
$78.87
-6.88%
|
3/21/2013
|
$71.14
|
PP = $73.00
|
|
MB = $76.65
|
Most Recent Note - 4/19/2013 12:17:32 PM
Y - Managed a "positive reversal" after early weakness today, making a stand near its 50 DMA line ($71.67 now). More damaging losses would raise more serious concerns and trigger a worrisome technical sell signal.
>>> The latest Featured Stock Update with an annotated graph appeared on 4/15/2013. Click here.
View all notes |
Alert me of new notes |
CANSLIM.net Company Profile |
SEC |
Zacks Reports |
StockTalk |
News |
Chart |
Request a new note
C
A N
S L
I M
|
Symbol/Exchange
Company Name
Industry Group |
PRICE |
CHANGE
(%Change) |
Day High |
Volume
(% DAV)
(% 50 day avg vol) |
52 Wk Hi
% From Hi |
Featured
Date |
Price
Featured |
Pivot Featured |
|
Max Buy |
LNKD
-
NYSE
Linkedin Corp Class A
INTERNET - Internet Information Providers
|
$174.95
|
+1.14
0.66% |
$178.74
|
1,523,608
59.65% of 50 DAV
50 DAV is 2,554,100
|
$186.06
-5.97%
|
4/12/2013
|
$182.69
|
PP = $184.25
|
|
MB = $193.46
|
Most Recent Note - 4/16/2013 6:43:53 PM
Y - Traded up today with lighter volume. Color code was changed to yellow with a new pivot point cited based on its 3/14/18 high plus 10 cents while forming a short 5-week flat base pattern. Volume-driven gains above the pivot point may trigger a new (or add-on) technical buy signal. Its 50 DMA line and recent low define important near-term chart support to watch.
>>> The latest Featured Stock Update with an annotated graph appeared on 4/5/2013. Click here.
View all notes |
Alert me of new notes |
CANSLIM.net Company Profile |
SEC |
Zacks Reports |
StockTalk |
News |
Chart |
Request a new note
C
A N
S L
I M
|
MRLN
-
NASDAQ
Marlin Business Services
DIVERSIFIED SERVICES - Rental and Leasing Services
|
$22.93
|
+0.77
3.47% |
$23.74
|
19,020
74.59% of 50 DAV
50 DAV is 25,500
|
$23.98
-4.38%
|
3/15/2013
|
$22.29
|
PP = $23.18
|
|
MB = $24.34
|
Most Recent Note - 4/19/2013 1:14:00 PM
Y - Rallying within close striking distance of its 52-week high today and little resistance remains. Promptly rebounded above its 50 DMA line, an encouraging sign of institutional support on the prior session. Subsequent deterioration below the recent low ($20.10) or its 200 DMA line would raise more serious concerns and trigger additional sell signals.
>>> The latest Featured Stock Update with an annotated graph appeared on 4/9/2013. Click here.
View all notes |
Alert me of new notes |
CANSLIM.net Company Profile |
SEC |
Zacks Reports |
StockTalk |
News |
Chart |
Request a new note
C
A N
S L
I M
|
MWIV
-
NASDAQ
M W I Veterinary Supply
HEALTH SERVICES - Medical Instruments and; Supplies
|
$124.15
|
+2.35
1.93% |
$124.93
|
28,154
49.13% of 50 DAV
50 DAV is 57,300
|
$137.18
-9.50%
|
3/4/2013
|
$130.90
|
PP = $129.45
|
|
MB = $135.92
|
Most Recent Note - 4/19/2013 1:16:09 PM
G - Still sputtering below its 50 DMA line, and its Relative Strength rating has slumped to 79, below the 80+ minimum guideline for buy candidates.
>>> The latest Featured Stock Update with an annotated graph appeared on 4/4/2013. Click here.
View all notes |
Alert me of new notes |
CANSLIM.net Company Profile |
SEC |
Zacks Reports |
StockTalk |
News |
Chart |
Request a new note
C
A N
S L
I M
|
N
-
NYSE
Netsuite Inc
DIVERSIFIED SERVICES - Business/Management Services
|
$79.12
|
+1.09
1.40% |
$79.87
|
212,563
59.78% of 50 DAV
50 DAV is 355,600
|
$80.33
-1.51%
|
12/12/2012
|
$64.75
|
PP = $67.12
|
|
MB = $70.48
|
Most Recent Note - 4/16/2013 6:47:10 PM
G - Hovering near its all-time high, extended after a recent streak of 7 consecutive weekly gains. Its 50 DMA line ($73.58 now) defines important near-term support to watch.
>>> The latest Featured Stock Update with an annotated graph appeared on 4/1/2013. Click here.
View all notes |
Alert me of new notes |
CANSLIM.net Company Profile |
SEC |
Zacks Reports |
StockTalk |
News |
Chart |
Request a new note
C
A N
S L
I M
|
RRTS
-
NYSE
Roadrunner Trans Systems
TRANSPORTATION - Air Delivery and Freight Service
|
$22.15
|
+0.31
1.42% |
$22.22
|
73,881
36.59% of 50 DAV
50 DAV is 201,900
|
$23.88
-7.24%
|
4/3/2013
|
$22.77
|
PP = $23.75
|
|
MB = $24.94
|
Most Recent Note - 4/17/2013 11:39:46 AM
G - Color code is changed to green after violating the recent low and its 50 DMA line triggering technical sell signals. Only a prompt rebound above that important short-term average would help its outlook improve.
>>> The latest Featured Stock Update with an annotated graph appeared on 4/3/2013. Click here.
View all notes |
Alert me of new notes |
CANSLIM.net Company Profile |
SEC |
Zacks Reports |
StockTalk |
News |
Chart |
Request a new note
C
A N
S L
I M
|
Symbol/Exchange
Company Name
Industry Group |
PRICE |
CHANGE
(%Change) |
Day High |
Volume
(% DAV)
(% 50 day avg vol) |
52 Wk Hi
% From Hi |
Featured
Date |
Price
Featured |
Pivot Featured |
|
Max Buy |
VRX
-
NYSE
Valeant Pharmaceuticals
DRUGS - Drug Manufacturers - Other
|
$75.52
|
+2.71
3.72% |
$75.61
|
1,188,202
88.94% of 50 DAV
50 DAV is 1,336,000
|
$76.56
-1.36%
|
12/20/2012
|
$60.24
|
PP = $61.21
|
|
MB = $64.27
|
Most Recent Note - 4/19/2013 1:18:34 PM
G - Finding recent support well above its 50 DMA line defining important near-term support.
>>> The latest Featured Stock Update with an annotated graph appeared on 4/8/2013. Click here.
View all notes |
Alert me of new notes |
CANSLIM.net Company Profile |
SEC |
Zacks Reports |
StockTalk |
News |
Chart |
Request a new note
C
A N
S L
I M
|
|
|
|
THESE ARE NOT BUY RECOMMENDATIONS!
Comments contained in the body of this report are technical
opinions only. The material herein has been obtained
from sources believed to be reliable and accurate, however,
its accuracy and completeness cannot be guaranteed.
This site is not an investment advisor, hence it does
not endorse or recommend any securities or other investments.
Any recommendation contained in this report may not
be suitable for all investors and it is not to be deemed
an offer or solicitation on our part with respect to
the purchase or sale of any securities. All trademarks,
service marks and trade names appearing in this report
are the property of their respective owners, and are
likewise used for identification purposes only.
This report is a service available
only to active Paid Premium Members.
You may opt-out of receiving report notifications
at any time. Questions or comments may be submitted
by writing to Premium Membership Services 665 S.E. 10 Street, Suite 201 Deerfield Beach, FL 33441-5634 or by calling 1-800-965-8307
or 954-785-1121.
|
|
|

