You are not logged in.
This means you
CAN ONLY VIEW reports that were published prior to Monday, April 14, 2025.
You
MUST UPGRADE YOUR MEMBERSHIP if you want to see any current reports.
AFTER MARKET UPDATE - TUESDAY, APRIL 19TH, 2011
Previous After Market Report Next After Market Report >>>
|
|
|
|
DOW |
+65.16 |
12,266.75 |
+0.53% |
|
Volume |
844,544,410 |
-19% |
|
Volume |
1,630,788,360 |
-7% |
|
NASDAQ |
+9.59 |
2,744.97 |
+0.35% |
|
Advancers |
1,979 |
63% |
|
Advancers |
1,308 |
48% |
|
S&P 500 |
+7.48 |
1,312.62 |
+0.57% |
|
Decliners |
1,030 |
33% |
|
Decliners |
1,288 |
47% |
|
Russell 2000 |
+1.50 |
823.01 |
+0.18% |
|
52 Wk Highs |
57 |
|
|
52 Wk Highs |
66 |
|
|
S&P 600 |
+0.60 |
435.96 |
+0.14% |
|
52 Wk Lows |
25 |
|
|
52 Wk Lows |
32 |
|
|
 |
Earnings and Economic Data Fail To Inspire New Institutional Buying
Kenneth J. Gruneisen - Passed the CAN SLIM® Master's Exam
Lighter volume totals on both major exchanges left questions as to the level of buying conviction from institutional investors on Tuesday while the major averages recovered a small part of the prior session's losses. Advancing issues beat decliners by about 2-1 on the NYSE and by a narrower 13-12 margin on the Nasdaq exchange. New 52-week highs outnumbered new 52-week lows on the NYSE and on the Nasdaq exchange. There were 33 high-ranked companies from the CANSLIM.net Leaders List that made new 52-week highs and appeared on the CANSLIM.net BreakOuts Page, up from the total of 17 on the prior session. On the Featured Stocks Page there were gains from 13 of the 21 high-ranked market leaders currently listed. The current market environment has been described as an "uptrend under pressure" after last Tuesday's damaging losses.
As the markets waded through a heavy earnings calendar, Johnson & Johnson (JNJ +3.69%) was the biggest gainer in the Dow Jones Industrial Average. The company reported better-than-expected earnings and raised its forecast for the fiscal year. Harley-Davidson Inc (HOG -5.29%) and Goldman Sachs Group Inc (GS -1.25%) both fell after results disappointed investors. Zions Bancorporation (ZION +3.88%) rose after reporting its first quarterly profit since the start of the financial crisis.
Freeport McMoran Copper and Gold (FCX +2.19%) rose as gold touched $1,500 an ounce for the first time. Steel Dynamics Inc (STLD +5.73%) also rose after results topped estimates.
The Commerce Department reported that in March, builders broke ground on the most homes in six months. New home construction rose 7.2% from February to 549,000. Homebuilders including PulteGroup Inc (PHM +5.10%) rose. In M&A news, Seagate Technology (STX +0.50%) agreed to buy Samsung's computer hard-disk drive business in a deal worth $1.38 billion in cash.
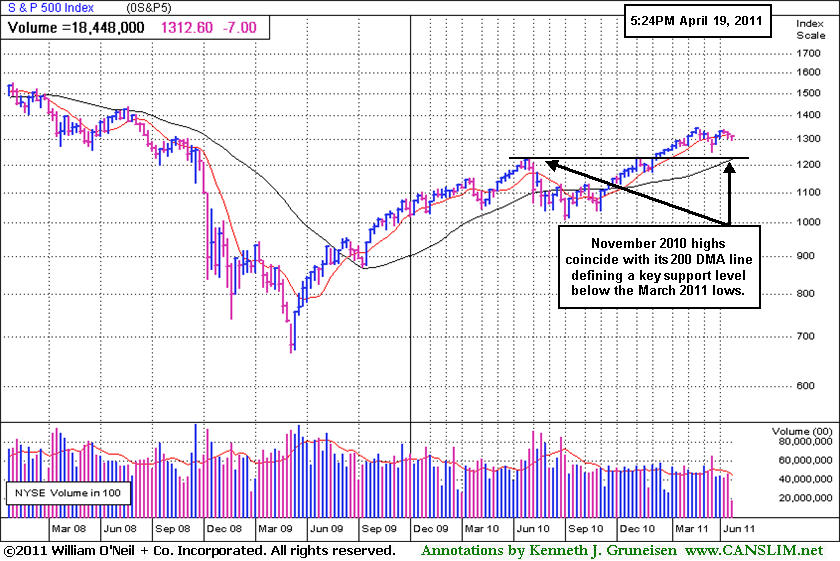
PICTURED: The S&P 500 Index's weekly chart above shows the benchmark index now perched -2.3% off its February 18th, 2011 high. Its November 2010 high coincides with its longer-term 200-day moving average line, defining a key support area in the event of a more substantial correction. Gains on its most recent rebound effort clearly lacked great volume conviction.
|
 Kenneth J. Gruneisen started out as a licensed stockbroker in August 1987, a couple of months prior to the historic stock market crash that took the Dow Jones Industrial Average down -22.6% in a single day. He has published daily fact-based fundamental and technical analysis on high-ranked stocks online for two decades. Through FACTBASEDINVESTING.COM, Kenneth provides educational articles, news, market commentary, and other information regarding proven investment systems that work in good times and bad.
Comments contained in the body of this report are technical opinions only and are not necessarily those of Gruneisen Growth Corp. The material herein has been obtained from sources believed to be reliable and accurate, however, its accuracy and completeness cannot be guaranteed. Our firm, employees, and customers may effect transactions, including transactions contrary to any recommendation herein, or have positions in the securities mentioned herein or options with respect thereto. Any recommendation contained in this report may not be suitable for all investors and it is not to be deemed an offer or solicitation on our part with respect to the purchase or sale of any securities. |
|
 |
Weak Broker/Dealer Group Hurting Broader Market Outlook
Kenneth J. Gruneisen - Passed the CAN SLIM® Master's Exam
Defensive groups were standout gainers on Tuesday as the Gold & Silver Index ($XAU +1.73%) and Healthcare Index ($HMO +1.26%) rose. Strength in energy-related issues gave the Integrated Oil Index ($XOI +1.03%) and Oil Services Index ($OSX +1.52%) both a boost. Meanwhile, the Broker/Dealer Index ($XBD -0.83%) was a laggard group and the Bank Index ($BKX +0.06%) ended flat. The Retail Index ($RLX +0.26%) inched higher while a number of companies in the Apparel industry surged to new highs. The Semiconductor Index ($SOX +0.43%) and Networking Index ($NWX +0.44%) posted modest gains, meanwhile the Internet Index ($IIX +0.08%) barely edged higher, and the Biotechnology Index ($BTK -0.65%) suffered a small loss.
Charts courtesy www.stockcharts.com
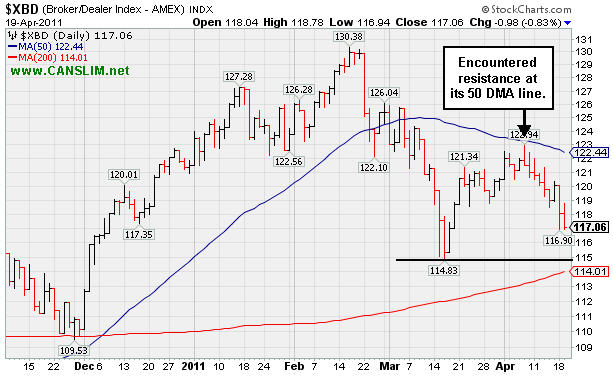
PICTURED: The Broker/Dealer Index ($XBD -0.83%) encountered resistance at its 50-day moving average (DMA) line and has been slumping toward its 2011 lows and its 200 DMA line. Longtime readers of CANSLIM.net reports know that the major averages have a history of being prone to more damaging losses whenever financial groups are weak. The latest slump in financial shares has been noted as cause for concern because, as an important "leading indicator", the deterioration in financial stocks does not bode well for the broader market outlook.
| Oil Services |
$OSX |
284.92 |
+4.26 |
+1.52% |
+16.24% |
| Healthcare |
$HMO |
2,133.44 |
+26.46 |
+1.26% |
+26.09% |
| Integrated Oil |
$XOI |
1,325.64 |
+13.55 |
+1.03% |
+9.27% |
| Semiconductor |
$SOX |
425.26 |
+1.82 |
+0.43% |
+3.26% |
| Networking |
$NWX |
322.97 |
+1.42 |
+0.44% |
+15.12% |
| Internet |
$IIX |
314.52 |
+0.24 |
+0.08% |
+2.21% |
| Broker/Dealer |
$XBD |
117.06 |
-0.97 |
-0.83% |
-3.66% |
| Retail |
$RLX |
525.44 |
+1.38 |
+0.26% |
+3.36% |
| Gold & Silver |
$XAU |
220.47 |
+3.75 |
+1.73% |
-2.70% |
| Bank |
$BKX |
50.50 |
+0.03 |
+0.06% |
-3.28% |
| Biotech |
$BTK |
1,397.42 |
-9.12 |
-0.65% |
+7.69% |
|
|
|
 |
Damaging Distributional Action Negated Recent Breakout
Kenneth J. Gruneisen - Passed the CAN SLIM® Master's Exam
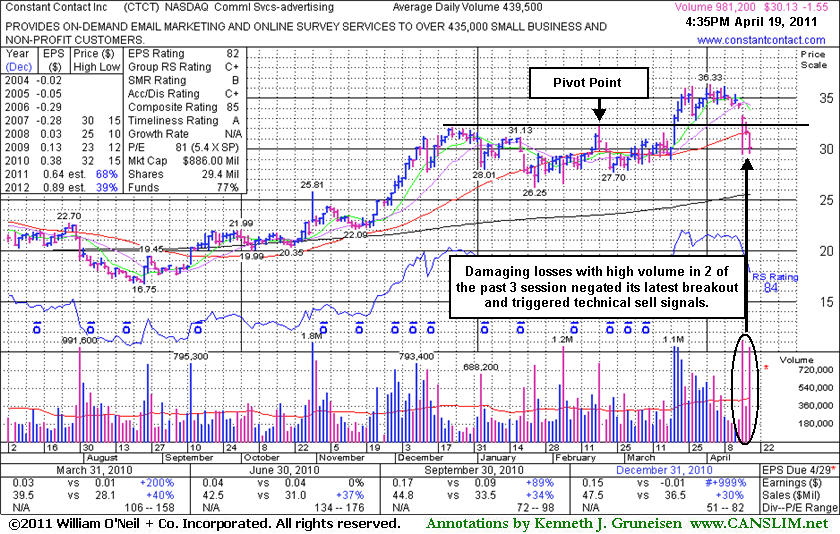
Constant Contact Inc (CTCT -$1.55 or -4.89% to $30.13) was down considerably today with its 2nd damaging loss with heavy volume in the span of 3 sessions. It slumped below its 50-day moving average (DMA) line again and finished near the session low, raising concerns and triggering worrisome technical sell signals. A gap down and damaging loss on Friday raised concerns, however its resilient finish near the session high suggested that prompt support (buying) was coming from the institutional crowd. The quiet loss on Monday, however, was followed by yet another damaging distribution day as it closed today's session decisively below its 50 DMA line. The distributional pressure has completely negated its breakout from a choppy 13-week base, hurting its near-term chances of going on for much greater gains.
CTCT is due to report earnings after the close on Thursday, April 28th. Volume and volatility often increase near earnings announcements. After its last appearance in this FSU section with an annotated graph on 3/22/11 under the headline, "Big Volume Accompanied Breakout This Week", it went on and hit new all-time highs. As previously noted, sales revenues increases show steady sequential deceleration from +55%, +49%, +47%, +43%, +40%, +37%, +34%, to +30% from the Mar '09 through the latest Dec '10 quarterly comparison(s) versus the respective year(s) earlier. It has shown good annual earnings increases since FY '08 and (A criteria) and great earning improvement in recent quarterly comparisons. Increasing ownership by top-rated funds is a reassuring sign (I criteria), rising from 241 in Mar '10 to 307 in Mar '11. As always, losses should be limited by selling if ever any stock falls more than -7% from your purchase price. That is Rule #1 in the fact-based investment system CANSLIM.net supports.
|
|
|
Color Codes Explained :
Y - Better candidates highlighted by our
staff of experts.
G - Previously featured
in past reports as yellow but may no longer be buyable under the
guidelines.
***Last / Change / Volume data in this table is the closing quote data***
Symbol/Exchange
Company Name
Industry Group |
PRICE |
CHANGE
(%Change) |
Day High |
Volume
(% DAV)
(% 50 day avg vol) |
52 Wk Hi
% From Hi |
Featured
Date |
Price
Featured |
Pivot Featured |
|
Max Buy |
AIXG
-
NASDAQ
Aixtron Se
ELECTRONICS - Semiconductor Equipment andamp; Mate
|
$40.00
|
+0.40
1.01% |
$40.12
|
312,836
121.82% of 50 DAV
50 DAV is 256,800
|
$44.96
-11.03%
|
4/5/2011
|
$44.14
|
PP = $44.64
|
|
MB = $46.87
|
Most Recent Note - 4/18/2011 10:48:44 AM
G - Gapped down today, diving toward prior lows in the $38 area previously noted as the next support after a violation of its 50 DMA last week raised concerns. A rebound above its 50 DMA would help its outlook, otherwise the path of least resistance could lead to an eventual test of its 200 DMA line. As previously noted - "Disciplined investors watch for proof of institutional buying demand and avoid the urge to get in 'early'".
>>> The latest Featured Stock Update with an annotated graph appeared on 4/5/2011. Click here.
View all notes |
Alert me of new notes |
CANSLIM.net Company Profile |
SEC |
Zacks Reports |
StockTalk |
News |
Chart |
Request a new note
C
A N
S L
I M


|
BIDU
-
NASDAQ
Baidu Inc Ads
INTERNET - Internet Information Providers
|
$149.90
|
+4.01
2.75% |
$150.00
|
9,659,408
139.61% of 50 DAV
50 DAV is 6,918,900
|
$148.92
0.66%
|
3/17/2011
|
$121.97
|
PP = $131.73
|
|
MB = $138.32
|
 Most Recent Note - 4/19/2011 11:54:13 AM
G - Touched another new all-time high today. It is extended from its latest base, and the prior high near $131 defines initial chart support to watch near its rising 50 DMA line. The market's recent uptrend was noted as "under pressure" in the daily commentary (M criteria calling for caution).
>>> The latest Featured Stock Update with an annotated graph appeared on 4/7/2011. Click here.
View all notes |
Alert me of new notes |
CANSLIM.net Company Profile |
SEC |
Zacks Reports |
StockTalk |
News |
Chart |
Request a new note
C
A N
S L
I M
|
CMG
-
NYSE
Chipotle Mexican Grill
LEISURE - Restaurants
|
$279.85
|
-3.52
-1.24% |
$285.95
|
861,618
77.71% of 50 DAV
50 DAV is 1,108,800
|
$285.97
-2.14%
|
4/1/2011
|
$274.00
|
PP = $275.10
|
|
MB = $288.86
|
Most Recent Note - 4/15/2011 4:07:45 PM
Y - Today's 4th consecutive small gain with below average volume helped it wedge higher for a new all-time high close. The investment system requires a gain above a stock's pivot point with volume +40-50% above average, or preferably much heavier, to trigger a proper technical buy signal. Its 50 DMA line ($258.98 now) defines important chart support to watch.
>>> The latest Featured Stock Update with an annotated graph appeared on 4/13/2011. Click here.
View all notes |
Alert me of new notes |
CANSLIM.net Company Profile |
SEC |
Zacks Reports |
StockTalk |
News |
Chart |
Request a new note
C
A N
S L
I M
|
CTCT
-
NASDAQ
Constant Contact Inc
MEDIA - Advertising Services
|
$30.13
|
-1.55
-4.89% |
$31.64
|
997,415
226.94% of 50 DAV
50 DAV is 439,500
|
$36.33
-17.07%
|
3/22/2011
|
$33.59
|
PP = $32.49
|
|
MB = $34.11
|
Most Recent Note - 4/19/2011 4:55:53 PM
G - Down considerably today with its 2nd damaging loss with heavy volume in the span of 3 sessions, it completely negated its recent breakout, slumping below its 50 DMA line again and triggering worrisome technical sell signals. Due to report earnings after the close on Thursday, April 28th. See the latest FSU analysis for details and a new annotated graph.
>>> The latest Featured Stock Update with an annotated graph appeared on 4/19/2011. Click here.
View all notes |
Alert me of new notes |
CANSLIM.net Company Profile |
SEC |
Zacks Reports |
StockTalk |
News |
Chart |
Request a new note
C
A N
S L
I M
|
CTSH
-
NASDAQ
Cognizant Tech Sol Cl A
COMPUTER SOFTWARE and SERVICES - Business Software and Services
|
$79.28
|
+1.31
1.68% |
$79.31
|
1,682,028
74.43% of 50 DAV
50 DAV is 2,259,800
|
$82.86
-4.32%
|
2/7/2011
|
$75.09
|
PP = $76.46
|
|
MB = $80.28
|
Most Recent Note - 4/19/2011 3:57:41 PM
G - Up today with light volume following damaging losses with higher volume testing prior highs in the $77-78 area previously noted as chart support to watch above its 50 DMA line. See the latest FSU analysis for more details and a new annotated graph.
>>> The latest Featured Stock Update with an annotated graph appeared on 4/15/2011. Click here.
View all notes |
Alert me of new notes |
CANSLIM.net Company Profile |
SEC |
Zacks Reports |
StockTalk |
News |
Chart |
Request a new note
C
A N
S L
I M
|
Symbol/Exchange
Company Name
Industry Group |
PRICE |
CHANGE
(%Change) |
Day High |
Volume
(% DAV)
(% 50 day avg vol) |
52 Wk Hi
% From Hi |
Featured
Date |
Price
Featured |
Pivot Featured |
|
Max Buy |
DECK
-
NASDAQ
Deckers Outdoor Corp
CONSUMER NON-DURABLES - Textile - Apparel Footwear
|
$93.12
|
+0.91
0.99% |
$94.38
|
773,544
56.90% of 50 DAV
50 DAV is 1,359,500
|
$95.49
-2.48%
|
2/3/2011
|
$79.61
|
PP = $82.67
|
|
MB = $86.80
|
Most Recent Note - 4/19/2011 3:58:56 PM
G - Quietly holding its ground this week after last week's noted rally for a new all-time high from a shorter than minimum length "cup-with-handle" type consolidation. Its 50 DMA line defines initial chart support to watch.
>>> The latest Featured Stock Update with an annotated graph appeared on 4/6/2011. Click here.
View all notes |
Alert me of new notes |
CANSLIM.net Company Profile |
SEC |
Zacks Reports |
StockTalk |
News |
Chart |
Request a new note
C
A N
S L
I M
|
EZPW
-
NASDAQ
Ezcorp Inc Cl A
SPECIALTY RETAIL - Specialty Retail, Other
|
$28.99
|
+0.69
2.44% |
$29.01
|
475,651
137.43% of 50 DAV
50 DAV is 346,100
|
$33.08
-12.36%
|
2/18/2011
|
$27.94
|
PP = $30.04
|
|
MB = $31.54
|
Most Recent Note - 4/19/2011 4:01:00 PM
G - Gain with above average volume today, rising back to its 50 DMA line. Recently slumped under prior highs in the $29-30 area previously noted as important support to watch.
>>> The latest Featured Stock Update with an annotated graph appeared on 4/11/2011. Click here.
View all notes |
Alert me of new notes |
CANSLIM.net Company Profile |
SEC |
Zacks Reports |
StockTalk |
News |
Chart |
Request a new note
C
A N
S L
I M
|
FOSL
-
NASDAQ
Fossil Inc
CONSUMER DURABLES - Recreational Goods, Other
|
$92.40
|
+0.56
0.61% |
$93.38
|
579,372
57.87% of 50 DAV
50 DAV is 1,001,100
|
$95.39
-3.13%
|
2/1/2011
|
$73.30
|
PP = $74.44
|
|
MB = $78.16
|
Most Recent Note - 4/18/2011 10:52:21 AM
G - Gapped down today, pulling back amid widespread market weakness. It rallied more than +108% higher in 8 months since first featured in yellow in the 8/10/10 mid-day report (read here). It could produce more climactic gains, but recently it has been noted - "Extended from any sound base. Prior highs in the $83-85 area define chart support to watch above its 50 DMA line."
>>> The latest Featured Stock Update with an annotated graph appeared on 3/30/2011. Click here.
View all notes |
Alert me of new notes |
CANSLIM.net Company Profile |
SEC |
Zacks Reports |
StockTalk |
News |
Chart |
Request a new note
C
A N
S L
I M
|
HMSY
-
NASDAQ
H M S Holdings Corp
COMPUTER SOFTWARE and SERVICES - Healthcare Information Service
|
$80.40
|
-0.14
-0.17% |
$81.63
|
221,817
136.92% of 50 DAV
50 DAV is 162,000
|
$84.82
-5.21%
|
11/19/2010
|
$61.89
|
PP = $63.01
|
|
MB = $66.16
|
Most Recent Note - 4/14/2011 5:16:42 PM
G - Perched -4.0% below its all-time high with volume totals cooling in recent weeks. It is extended from any sound base pattern. Its 50 DMA line ($77.12 now) defines support to watch on pullbacks.
>>> The latest Featured Stock Update with an annotated graph appeared on 3/25/2011. Click here.
View all notes |
Alert me of new notes |
CANSLIM.net Company Profile |
SEC |
Zacks Reports |
StockTalk |
News |
Chart |
Request a new note
C
A N
S L
I M
|
HS
-
NYSE
Healthspring Inc
HEALTH SERVICES - Health Care Plans
|
$38.25
|
+0.42
1.11% |
$38.32
|
560,699
65.24% of 50 DAV
50 DAV is 859,400
|
$40.78
-6.20%
|
3/22/2011
|
$38.29
|
PP = $38.85
|
|
MB = $40.79
|
Most Recent Note - 4/18/2011 6:25:15 PM
Y - Small gap down today for loss on slightly higher volume was a sign of distributional pressure. Its pullback below its pivot point last week technically negated its 4/01/11 breakout. Its nearby 50 DMA line ($36.74 now) defines important support above recent lows in the $35.50 area.
>>> The latest Featured Stock Update with an annotated graph appeared on 3/23/2011. Click here.
View all notes |
Alert me of new notes |
CANSLIM.net Company Profile |
SEC |
Zacks Reports |
StockTalk |
News |
Chart |
Request a new note
C
A N
S L
I M
|
Symbol/Exchange
Company Name
Industry Group |
PRICE |
CHANGE
(%Change) |
Day High |
Volume
(% DAV)
(% 50 day avg vol) |
52 Wk Hi
% From Hi |
Featured
Date |
Price
Featured |
Pivot Featured |
|
Max Buy |
INFA
-
NASDAQ
Informatica Corp
COMPUTER SOFTWARE and SERVICES - Business Software and Services
|
$51.49
|
-0.07
-0.14% |
$51.97
|
1,449,343
164.57% of 50 DAV
50 DAV is 880,700
|
$53.95
-4.56%
|
3/24/2011
|
$50.04
|
PP = $49.86
|
|
MB = $52.35
|
Most Recent Note - 4/18/2011 11:01:34 AM
G - Gapped down today, slumping below its "max buy" level amid widespread market weakness. Prior highs in the $49 area define support to watch coinciding with its 50 DMA line. Subsequent violations would raise concerns and may trigger technical sell signals. The market's recent uptrend was noted as "under pressure" in the daily commentary (M criteria calling for caution).
>>> The latest Featured Stock Update with an annotated graph appeared on 3/28/2011. Click here.
View all notes |
Alert me of new notes |
CANSLIM.net Company Profile |
SEC |
Zacks Reports |
StockTalk |
News |
Chart |
Request a new note
C
A N
S L
I M
|
LULU
-
NASDAQ
Lululemon Athletica
MANUFACTURING - Textile Manufacturing
|
$100.26
|
+3.40
3.51% |
$101.40
|
4,317,304
188.90% of 50 DAV
50 DAV is 2,285,500
|
$97.00
3.36%
|
3/28/2011
|
$68.11
|
PP = $85.38
|
|
MB = $89.65
|
Most Recent Note - 4/19/2011 12:28:05 PM
G - Considerable back-to-back gains with above average volume have this high-ranked Retail-Apparel firm extended from any sound base pattern and hitting new all-time highs. Prior highs in the $85 area define initial chart support to watch.
>>> The latest Featured Stock Update with an annotated graph appeared on 3/31/2011. Click here.
View all notes |
Alert me of new notes |
CANSLIM.net Company Profile |
SEC |
Zacks Reports |
StockTalk |
News |
Chart |
Request a new note
C
A N
S L
I M
|
MG
-
NYSE
Mistras Group Inc
DIVERSIFIED SERVICES - Bulding and Faci;ity Management Services
|
$17.90
|
+0.00
0.00% |
$18.25
|
127,433
100.03% of 50 DAV
50 DAV is 127,400
|
$18.22
-1.76%
|
3/15/2011
|
$15.48
|
PP = $15.90
|
|
MB = $16.70
|
Most Recent Note - 4/15/2011 1:05:51 PM
G - Holding its ground today following a considerable gap up gain on 4/14/11 for a new all-time high. It is extended from any sound base pattern, meanwhile its 50 DMA line and prior highs define important support to watch. Recently reported earnings +200% on +23% sales revenues for the quarter ended February 28, 2011 versus the year-ago period.
>>> The latest Featured Stock Update with an annotated graph appeared on 4/12/2011. Click here.
View all notes |
Alert me of new notes |
CANSLIM.net Company Profile |
SEC |
Zacks Reports |
StockTalk |
News |
Chart |
Request a new note
C
A N
S L
I M
|
MWIV
-
NASDAQ
M W I Veterinary Supply
HEALTH SERVICES - Medical Instruments and; Supplies
|
$80.60
|
+0.22
0.27% |
$80.79
|
75,434
78.09% of 50 DAV
50 DAV is 96,600
|
$81.63
-1.26%
|
11/4/2010
|
$61.79
|
PP = $59.60
|
|
MB = $62.58
|
Most Recent Note - 4/18/2011 12:46:51 PM
G - Pulling back today from its all-time high hit on the prior session. Its 50 DMA line defines important support to watch. It has been repeatedly noted - "Extended from any sound base pattern."
>>> The latest Featured Stock Update with an annotated graph appeared on 4/8/2011. Click here.
View all notes |
Alert me of new notes |
CANSLIM.net Company Profile |
SEC |
Zacks Reports |
StockTalk |
News |
Chart |
Request a new note
C
A N
S L
I M
|
OPEN
-
NASDAQ
Opentable Inc
INTERNET - Internet Software and Services
|
$106.40
|
-1.22
-1.13% |
$109.36
|
1,560,189
118.47% of 50 DAV
50 DAV is 1,317,000
|
$112.78
-5.66%
|
3/17/2011
|
$90.71
|
PP = $96.07
|
|
MB = $100.87
|
Most Recent Note - 4/18/2011 6:23:09 PM
G - After a small gap down it managed a positive reversal and closed near the session high with a gain on slightly above average volume. Repeatedly noted - "Extended from its latest base. Prior highs near $96 and its 50 DMA line define support to watch on pullbacks.
>>> The latest Featured Stock Update with an annotated graph appeared on 3/24/2011. Click here.
View all notes |
Alert me of new notes |
CANSLIM.net Company Profile |
SEC |
Zacks Reports |
StockTalk |
News |
Chart |
Request a new note
C
A N
S L
I M
|
Symbol/Exchange
Company Name
Industry Group |
PRICE |
CHANGE
(%Change) |
Day High |
Volume
(% DAV)
(% 50 day avg vol) |
52 Wk Hi
% From Hi |
Featured
Date |
Price
Featured |
Pivot Featured |
|
Max Buy |
PAY
-
NYSE
Verifone Systems Inc
COMPUTER HARDWARE - Transaction Automation Systems
|
$52.25
|
+0.18
0.35% |
$52.64
|
2,068,302
86.15% of 50 DAV
50 DAV is 2,400,900
|
$58.88
-11.26%
|
1/27/2011
|
$41.77
|
PP = $44.97
|
|
MB = $47.22
|
Most Recent Note - 4/18/2011 11:49:26 AM
G - Small gap down today amid widespread market weakness, consolidating above its 50 DMA line ($50.29 now) defining important chart support to watch.
>>> The latest Featured Stock Update with an annotated graph appeared on 4/4/2011. Click here.
View all notes |
Alert me of new notes |
CANSLIM.net Company Profile |
SEC |
Zacks Reports |
StockTalk |
News |
Chart |
Request a new note
C
A N
S L
I M
|
PCLN
-
NASDAQ
Priceline.Com Inc
INTERNET - Internet Software and Services
|
$525.53
|
+8.75
1.69% |
$525.57
|
821,194
68.42% of 50 DAV
50 DAV is 1,200,300
|
$522.00
0.68%
|
1/3/2011
|
$399.55
|
PP = $428.20
|
|
MB = $449.61
|
Most Recent Note - 4/14/2011 3:43:37 PM
G - It recently stalled after wedging to new 52-week highs without great volume conviction. It as been repeatedly noted - "Extended from any sound base pattern. Its 50 DMA line has defined support throughout its advance."
>>> The latest Featured Stock Update with an annotated graph appeared on 3/21/2011. Click here.
View all notes |
Alert me of new notes |
CANSLIM.net Company Profile |
SEC |
Zacks Reports |
StockTalk |
News |
Chart |
Request a new note
C
A N
S L
I M
|
RAX
-
NYSE
Rackspace Hosting Inc
INTERNET - Internet Software and; Services
|
$42.18
|
+0.03
0.07% |
$42.77
|
1,114,257
64.20% of 50 DAV
50 DAV is 1,735,700
|
$44.19
-4.55%
|
3/16/2011
|
$36.28
|
PP = $40.72
|
|
MB = $42.76
|
Most Recent Note - 4/18/2011 6:19:22 PM
G - Hovering near its all-time highs following latest breakout. Prior highs near $40 define support above its 50 DMA line. See the latest FSU analysis for additional details and a new annotated graph.
>>> The latest Featured Stock Update with an annotated graph appeared on 4/18/2011. Click here.
View all notes |
Alert me of new notes |
CANSLIM.net Company Profile |
SEC |
Zacks Reports |
StockTalk |
News |
Chart |
Request a new note
C
A N
S L
I M
|
TIBX
-
NASDAQ
Tibco Software Inc
COMPUTER SOFTWARE and SERVICES - Business Software and Services
|
$28.56
|
-0.35
-1.21% |
$29.09
|
1,989,374
82.70% of 50 DAV
50 DAV is 2,405,600
|
$29.85
-4.32%
|
3/18/2011
|
$23.88
|
PP = $26.04
|
|
MB = $27.34
|
Most Recent Note - 4/18/2011 11:11:46 AM
G - Small gap down today amid widespread market weakness. It is extended from a sound base after a spurt of volume-driven gains. As previously noted, support is defined by prior highs in the $25-26 area and its 50 DMA line. See the latest FSU analysis for more details and a new annotated graph.
>>> The latest Featured Stock Update with an annotated graph appeared on 4/14/2011. Click here.
View all notes |
Alert me of new notes |
CANSLIM.net Company Profile |
SEC |
Zacks Reports |
StockTalk |
News |
Chart |
Request a new note
C
A N
S L
I M
|
UA
-
NYSE
Under Armour Inc Cl A
CONSUMER NON-DURABLES - Textile - Apparel Clothing
|
$77.80
|
+3.69
4.98% |
$77.97
|
1,356,082
178.27% of 50 DAV
50 DAV is 760,700
|
$76.85
1.24%
|
3/31/2011
|
$68.04
|
PP = $70.79
|
|
MB = $74.33
|
Most Recent Note - 4/19/2011 1:30:16 PM
G - Up today on higher volume for a new all-time high, getting extended from its latest sound base pattern. Due to report earnings on the morning of Tuesday, April 26th for the latest quarter ended March 31, 2011. Prior highs in the $70 area define support to watch above its 50 DMA line.
>>> The latest Featured Stock Update with an annotated graph appeared on 4/1/2011. Click here.
View all notes |
Alert me of new notes |
CANSLIM.net Company Profile |
SEC |
Zacks Reports |
StockTalk |
News |
Chart |
Request a new note
C
A N
S L
I M
|
Symbol/Exchange
Company Name
Industry Group |
PRICE |
CHANGE
(%Change) |
Day High |
Volume
(% DAV)
(% 50 day avg vol) |
52 Wk Hi
% From Hi |
Featured
Date |
Price
Featured |
Pivot Featured |
|
Max Buy |
ULTA
-
NASDAQ
Ulta Salon Cosm & Frag
SPECIALTY RETAIL - Specialty Retail, Other
|
$49.78
|
-0.34
-0.68% |
$50.45
|
336,401
55.27% of 50 DAV
50 DAV is 608,700
|
$51.82
-3.94%
|
1/6/2011
|
$36.12
|
PP = $37.34
|
|
MB = $39.21
|
Most Recent Note - 4/14/2011 5:14:32 PM
G - Quietly consolidating just -4.3% off its all-time high today. It is extended from any sound base. Prior highs and its 50 DMA line define chart support to watch near the $44 level on pullbacks.
>>> The latest Featured Stock Update with an annotated graph appeared on 3/29/2011. Click here.
View all notes |
Alert me of new notes |
CANSLIM.net Company Profile |
SEC |
Zacks Reports |
StockTalk |
News |
Chart |
Request a new note
C
A N
S L
I M
|
|
|
|
THESE ARE NOT BUY RECOMMENDATIONS!
Comments contained in the body of this report are technical
opinions only. The material herein has been obtained
from sources believed to be reliable and accurate, however,
its accuracy and completeness cannot be guaranteed.
This site is not an investment advisor, hence it does
not endorse or recommend any securities or other investments.
Any recommendation contained in this report may not
be suitable for all investors and it is not to be deemed
an offer or solicitation on our part with respect to
the purchase or sale of any securities. All trademarks,
service marks and trade names appearing in this report
are the property of their respective owners, and are
likewise used for identification purposes only.
This report is a service available
only to active Paid Premium Members.
You may opt-out of receiving report notifications
at any time. Questions or comments may be submitted
by writing to Premium Membership Services 665 S.E. 10 Street, Suite 201 Deerfield Beach, FL 33441-5634 or by calling 1-800-965-8307
or 954-785-1121.
|
|
|

