***Last / Change / Volume quote data in this table corresponds with the timestamp on the note***
Symbol/Exchange
Company Name
Industry Group |
Last |
Chg. |
Vol
% DAV |
Date Featured |
Price Featured |
Latest Pivot Point
Featured |
Status |
| Latest Max Buy Price |
ARUN
- NASDAQ
Aruba Networks Inc
COMPUTER HARDWARE - Networking & Communication Dev
|
$13.06
|
-0.11
|
1,604,393
99% DAV
1,628,100
|
2/19/2010
(Date
Featured) |
$12.71
(Price
Featured) |
PP = $11.94 |
G |
| MB = $12.54 |
Most Recent Note - 4/19/2010 4:07:05 PM
G - Closed in the upper third of its intra-day range today, a sign of prompt support after early lows near previously noted support levels to watch - its 50 DMA line and recent chart low $12.21 on 3/19/10.
>>> The latest Featured Stock Update with an annotated graph appeared on 3/31/2010. click here.
|
|
C
A
S
I |
News |
Chart |
SEC
View all notes Alert
me of new notes
Company
Profile
|
BIDU
- NASDAQ
Baidu Inc Ads
INTERNET - Internet Information Providers
|
$613.50
|
-18.87
|
1,965,007
122% DAV
1,613,100
|
1/13/2010
(Date
Featured) |
$431.25
(Price
Featured) |
PP = $426.75 |
G |
| MB = $448.09 |
Most Recent Note - 4/19/2010 4:10:38 PM
G - Pulled back today for a considerable loss, with slightly higher volume indicative of distribution. It has been repeatedly noted as extended from any sound base after 10 consecutive weekly gains, however it could produce more climactic gains, especially due to the small supply (S criteria) of shares outstanding.
>>> The latest Featured Stock Update with an annotated graph appeared on 3/24/2010. click here.
|
|
C
A
S
I |
News |
Chart |
SEC
View all notes Alert
me of new notes
Company
Profile
|
BPI
- NYSE
Bridgepoint Education
DIVERSIFIED SERVICES - Education &; Training Services
|
$26.31
|
+0.88
|
386,184
92% DAV
417,800
|
4/13/2010
(Date
Featured) |
$25.59
(Price
Featured) |
PP = $25.76 |
Y |
| MB = $27.05 |
Most Recent Note - 4/19/2010 4:12:29 PM
Y- Gain today on near average volume after a light volume pullback above its prior high close ($25.40 on 3/24/10). Consolidating near its 52 week high since appearing in yellow in the 4/13/10 mid-day report (read here), when it triggered a new technical buy signal as it rose from a cup-with-high-handle
>>> The latest Featured Stock Update with an annotated graph appeared on 4/13/2010. click here.
|
|
C
A
S
I |
News |
Chart |
SEC
View all notes Alert
me of new notes
Company
Profile
|
BRLI
- NASDAQ
Bio Reference Labs Inc
HEALTH SERVICES - Medical Laboratories & Researc
|
$47.28
|
+0.52
|
150,036
152% DAV
99,000
|
2/12/2010
(Date
Featured) |
$39.02
(Price
Featured) |
PP = $40.97 |
G |
| MB = $43.02 |
Most Recent Note - 4/19/2010 4:17:37 PM
G - Perched at its all-time high today after wedging higher for a streak of 9 consecutive small gains without great volume conviction. Its recent chart low ($42.54 on 3/26/10) is an initial support level to watch near its short-term average.
>>> The latest Featured Stock Update with an annotated graph appeared on 4/16/2010. click here.
|
|
C
A
S
I |
News |
Chart |
SEC
View all notes Alert
me of new notes
Company
Profile
|
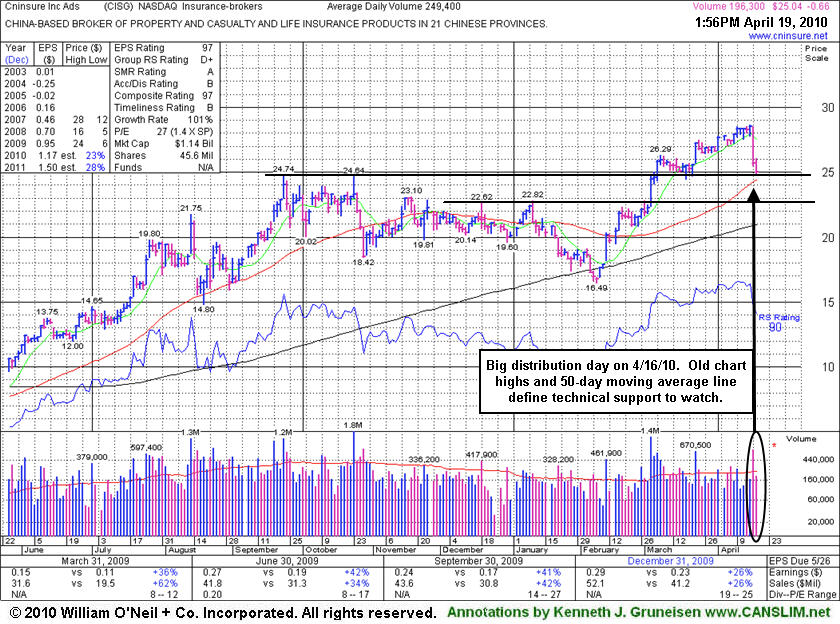
CISG
- NASDAQ
Cninsure Inc Ads
INSURANCE - Insurance Brokers
|
$25.47
|
-0.23
|
341,051
137% DAV
249,400
|
3/3/2010
(Date
Featured) |
$24.38
(Price
Featured) |
PP = $23.10 |
G |
| MB = $24.26 |
Most Recent Note - 4/19/2010 4:19:42 PM
G - Small loss today on above average volume after a big loss on 4/16/10 with 3 times average volume indicative of heavy distributional pressure. Pulled back near prior chart highs and its 50 DMA line in the $24 area which define an important support level. It traded up as much as +17.4% since featured in yellow in the 3/03/10 mid-day report (read here).
>>> The latest Featured Stock Update with an annotated graph appeared on 4/19/2010. click here.
|
|
C
A
S
I |
News |
Chart |
SEC
View all notes Alert
me of new notes
Company
Profile
|
CRM
- NYSE
Salesforce.com Inc
INTERNET - Internet Software & Services
|
$82.65
|
-0.83
|
1,784,814
99% DAV
1,806,600
|
3/5/2010
(Date
Featured) |
$72.28
(Price
Featured) |
PP = $75.53 |
G |
| MB = $79.31 |
Most Recent Note - 4/19/2010 4:31:14 PM
G - Consolidating near all-time highs, extended from prior chart highs and well above its "max buy" level. Volume totals were below the investment system guidelines as it rallied above its latest pivot point.
>>> The latest Featured Stock Update with an annotated graph appeared on 3/25/2010. click here.
|
|
C
A
S
I |
News |
Chart |
SEC
View all notes Alert
me of new notes
Company
Profile
|
CTRP
- NASDAQ
Ctrip.com Intl Ltd Adr
LEISURE - Resorts & Casinos
|
$37.12
|
-1.96
|
3,816,117
194% DAV
1,968,500
|
3/25/2010
(Date
Featured) |
$40.74
(Price
Featured) |
PP = $39.40 |
G |
| MB = $41.37 |
Most Recent Note - 4/19/2010 4:33:16 PM
G - Down considerably today with above average volume after a gap down, closing just under its 50 DMA line. Its color code was changed to green based on weakness under its pivot point. Encountered distributional pressure since 3/25/10 when a detailed Stock Bulletin with annotated graph and expert analysis was published (read here).
>>> The latest Featured Stock Update with an annotated graph appeared on 4/12/2010. click here.
|
|
C
A
S
I |
News |
Chart |
SEC
View all notes Alert
me of new notes
Company
Profile
|
EZPW
- NASDAQ
Ezcorp Inc Cl A
SPECIALTY RETAIL - Specialty Retail, Other
|
$21.95
|
+0.56
|
476,242
93% DAV
509,900
|
4/14/2010
(Date
Featured) |
$21.80
(Price
Featured) |
PP = $22.29 |
Y |
| MB = $23.40 |
Most Recent Note - 4/19/2010 4:40:03 PM
Y - Today's gain leaves it perched on the right side of a better than 5-week flat base with no overhead supply to act as resistance. Last week its color code was changed to yellow with new pivot point noted. Its 50 DMA line and its recent chart low ($19.73 on 3/16/10) define near-term support for this high-ranked Finance - Consumer/Commercial Loans firm.
>>> The latest Featured Stock Update with an annotated graph appeared on 3/29/2010. click here.
|
|
C
A
S
I |
News |
Chart |
SEC
View all notes Alert
me of new notes
Company
Profile
|
GMCR
- NASDAQ
Green Mtn Coffee Roastrs
FOOD & BEVERAGE - Processed & Packaged Goods
|
$90.69
|
-3.66
|
1,642,543
161% DAV
1,022,900
|
2/26/2010
(Date
Featured) |
$84.39
(Price
Featured) |
PP = $88.75 |
G |
| MB = $93.19 |
Most Recent Note - 4/19/2010 4:43:12 PM
G - Gapped down today with heavier volume behind its 6th consecutive loss. Testing support at its 50-day moving average (DMA) line now, this high-ranked leader may build a late-stage base after already rallying more than 6-fold from its November '08 low.
>>> The latest Featured Stock Update with an annotated graph appeared on 4/5/2010. click here.
|
|
C
A
S
I |
News |
Chart |
SEC
View all notes Alert
me of new notes
Company
Profile
|
ISRG
- NASDAQ
Intuitive Surgical Inc
HEALTH SERVICES - Medical Appliances & Equipment
|
$361.98
|
+1.59
|
1,028,366
186% DAV
554,100
|
4/13/2010
(Date
Featured) |
$363.46
(Price
Featured) |
PP = $367.10 |
G |
| MB = $385.46 |
Most Recent Note - 4/19/2010 4:47:37 PM
G - Held its ground today. Considerable loss with 4 times average volume on 4/16/10 after reporting earnings negated its latest breakout with a close below its old high close. Color code was changed to green. ISRG was featured again in the 4/13/10 mid-day report (read here) with new pivot point cited based on its 3/03/10 high.
>>> The latest Featured Stock Update with an annotated graph appeared on 4/7/2010. click here.
|
|
C
A
S
I |
News |
Chart |
SEC
View all notes Alert
me of new notes
Company
Profile
|
LOPE
- NASDAQ
Grand Canyon Education
DIVERSIFIED SERVICES - Education &; Training Services
|
$26.99
|
+0.03
|
267,442
79% DAV
337,800
|
4/13/2010
(Date
Featured) |
$27.71
(Price
Featured) |
PP = $27.33 |
Y |
| MB = $28.70 |
Most Recent Note - 4/19/2010 4:51:40 PM
Y - Small gain today, but it ended near the session low. Recently consolidating below its pivot point, any subsequent weakness leading to a close below its old high close ($26.64 on 3/25/10) would raise concerns. Featured in the 4/13/10 mid-day report (read here), its gain triggered a technical buy after an advanced "3-weeks tight" type pattern.
>>> The latest Featured Stock Update with an annotated graph appeared on 4/14/2010. click here.
|
|
C
A
S
I |
News |
Chart |
SEC
View all notes Alert
me of new notes
Company
Profile
|
PCLN
- NASDAQ
Priceline.com Inc
INTERNET - Internet Software & Services
|
$399.55
|
-4.72
|
584,812
N/A
|
11/1/2002
(Date
Featured) |
$399.55
(Price
Featured) |
PP = $428.20 |
Y |
| MB = $449.61 |
Most Recent Note - 1/2/2011
Y - Returns to Featured Stocks list with its appearance in the January 2011 CANSLIM.net News including detailed analysis and annotated daily and weekly graphs.
>>> The latest Featured Stock Update with an annotated graph appeared on 3/30/2010. click here.
|
|
C
A
S
I |
News |
Chart |
SEC
View all notes Alert
me of new notes
Company
Profile
|
PEGA
- NASDAQ
Pegasystems Inc
COMPUTER SOFTWARE & SERVICES - Business Software & Services
|
$37.82
|
-0.19
|
131,421
73% DAV
179,400
|
2/26/2010
(Date
Featured) |
$36.00
(Price
Featured) |
PP = $38.55 |
Y |
| MB = $40.48 |
Most Recent Note - 4/19/2010 4:56:18 PM
Y - Ended in the upper third of its intra-day range today with a small loss on below average volume. A violation of its 50 DMA line or its recent low ($36.42 on 4/12/10) would raise concerns and trigger technical sell signals. Volume totals have been quiet while consolidating since 3/15/10, staying in a tight trading range near support.
>>> The latest Featured Stock Update with an annotated graph appeared on 4/6/2010. click here.
|
|
C
A
S
I |
News |
Chart |
SEC
View all notes Alert
me of new notes
Company
Profile
|
ROVI
- NASDAQ
Rovi Corp
COMPUTER SOFTWARE & SERVICES - Security Software & Services
|
$36.87
|
-0.73
|
622,404
47% DAV
1,334,700
|
2/25/2010
(Date
Featured) |
$33.54
(Price
Featured) |
PP = $34.87 |
G |
| MB = $36.61 |
Most Recent Note - 4/19/2010 4:58:38 PM
G - Quietly consolidating today only -4.2% off its 52-week high, perched above prior chart highs and its 50 DMA line coinciding in the $34 area which define an important support level to watch.
>>> The latest Featured Stock Update with an annotated graph appeared on 4/8/2010. click here.
|
|
C
A
S
I |
News |
Chart |
SEC
View all notes Alert
me of new notes
Company
Profile
|
SIRO
- NASDAQ
Sirona Dental Systems
HEALTH SERVICES - Medical Instruments & Supplies
|
$38.94
|
+0.13
|
572,617
97% DAV
589,300
|
2/16/2010
(Date
Featured) |
$36.43
(Price
Featured) |
PP = $36.15 |
G |
| MB = $37.96 |
Most Recent Note - 4/19/2010 5:04:05 PM
G - Held its ground today, continuing to hover near its 52-week high. Prior chart highs and its 50 DMA line in the $36 area define an initial support level to watch.
>>> The latest Featured Stock Update with an annotated graph appeared on 3/26/2010. click here.
|
|
C
A
S
I |
News |
Chart |
SEC
View all notes Alert
me of new notes
Company
Profile
|
ULTA
- NASDAQ
Ulta Salon Cosm & Frag
SPECIALTY RETAIL - Specialty Retail, Other
|
$22.17
|
-1.44
|
431,919
110% DAV
391,900
|
3/12/2010
(Date
Featured) |
$22.81
(Price
Featured) |
PP = $21.72 |
G |
| MB = $22.81 |
Most Recent Note - 4/19/2010 5:07:16 PM
G - Considerable loss today with slightly above average volume, sinking toward prior chart highs and its 50 DMA line which define support to watch in the $21 area. It made very little progress since the detailed Stock Bulletin and 3/12/10 mid-day report appearance.
>>> The latest Featured Stock Update with an annotated graph appeared on 4/1/2010. click here.
|
|
C
A
S
I |
News |
Chart |
SEC
View all notes Alert
me of new notes
Company
Profile
|
VIT
-
|
$24.15
|
-0.15
|
655,344
101% DAV
650,300
|
4/9/2010
(Date
Featured) |
$23.79
(Price
Featured) |
PP = $23.95 |
Y |
| MB = $25.15 |
Most Recent Note - 4/19/2010 5:09:26 PM
Y - Consolidating near its 52-week high, but it has faced some distributional pressure. On 4/09/10 it triggered a technical buy signal as a solid gain with heavy volume more than 4 times average helped it trade above its pivot point after a 5-week consolidation. Color code was yellow with new pivot point noted in the 4/09/10 mid-day report (read here).
>>> The latest Featured Stock Update with an annotated graph appeared on 4/9/2010. click here.
|
|
C
A
S
I |
News |
Chart |
SEC
View all notes Alert
me of new notes
Company
Profile
|
VPRT
- NASDAQ
Vistaprint Nv
DIVERSIFIED SERVICES - Business/Management Services
|
$59.44
|
+0.21
|
414,272
111% DAV
372,400
|
3/1/2010
(Date
Featured) |
$57.72
(Price
Featured) |
PP = $59.70 |
G |
| MB = $62.69 |
Most Recent Note - 4/19/2010 5:10:21 PM
G - Held its ground again today, and it has recently found impressive support near its 50 DMA line. A subsequent violation of the short-term average or recent chart low ($55.45) would raise concerns and trigger technical sell signals. It did not trigger a new technical buy signal since it was featured in the March 2010 CANSLIM.net News monthly newsletter (read here).
>>> The latest Featured Stock Update with an annotated graph appeared on 4/15/2010. click here.
|
|
C
A
S
I |
News |
Chart |
SEC
View all notes Alert
me of new notes
Company
Profile
|