You are not logged in.
This means you
CAN ONLY VIEW reports that were published prior to Monday, April 14, 2025.
You
MUST UPGRADE YOUR MEMBERSHIP if you want to see any current reports.
AFTER MARKET UPDATE - THURSDAY, APRIL 18TH, 2013
Previous After Market Report Next After Market Report >>>
|
|
|
|
DOW |
-81.45 |
14,537.14 |
-0.56% |
|
Volume |
797,796,230 |
-8% |
|
Volume |
1,715,262,960 |
-7% |
|
NASDAQ |
-38.31 |
3,166.36 |
-1.20% |
|
Advancers |
1,320 |
42% |
|
Advancers |
927 |
37% |
|
S&P 500 |
-10.40 |
1,541.61 |
-0.67% |
|
Decliners |
1,653 |
53% |
|
Decliners |
1,475 |
58% |
|
Russell 2000 |
-5.29 |
901.51 |
-0.58% |
|
52 Wk Highs |
68 |
|
|
52 Wk Highs |
33 |
|
|
S&P 600 |
-3.35 |
504.70 |
-0.66% |
|
52 Wk Lows |
59 |
|
|
52 Wk Lows |
67 |
|
|
 |
Major Averages Slump Again With Less Volume Behind Losses
Kenneth J. Gruneisen - Passed the CAN SLIM® Master's Exam
Thursday was another down session for the major averages as the "correction" continued. The volume totals on the exchanges were reported lighter than the prior session totals on the NYSE and on the Nasdaq exchange. Breadth was negative as decliners led advancers by a 5-4 margin on the NYSE and by 3-2 on the Nasdaq exchange. New 52-week highs outnumbered new 52-week lows on the NYSE, but new 52-week lows outnumbered new 52-week highs on the Nasdaq exchange. There were 10 high-ranked companies from the CANSLIM.net Leaders List making new 52-week highs and appearing on the CANSLIM.net BreakOuts Page, up a notch from the prior session total of 9 stocks. There were gains for only 2 of the 15 high-ranked companies currently included on the Featured Stocks Page.
Thursday’s session saw losses for the major averages for second day following a round of disappointing economic data. Before the open, weekly initial jobless claims rose 4,000 to 352,000, slightly above the consensus estimate of 350,000. Additional reports revealed manufacturing activity in the Philadelphia region slowed in April while the leading indicators index declined -0.1% in March.
A mixed bag of earnings reports weighed on the market. EBay Inc (EBAY -5.9%) fell as quarterly results fell short of consensus expectations. United Health Corp (UNH -3.8%) sank after lowering its full-year sales guidance. Pepsi Co (PEP +3.0%) and Verizon Communication Ins (VZ +2.8%) rose after posting earnings above analyst projections. Technology was the worst performing sector on the session. Google Inc (GOOG -2.1%), International Business Machines Inc (IBM -2.5%) and Microsoft Corp (MSFT -0.1%) traded with a mostly negative bias ahead of their scheduled earnings releases after the close. Apple Inc (APPL -2.7%) fell amid concerns over second-quarter iPad mini shipments and a supplier reporting an inventory glut.
Treasuries advanced with the 10-year note up 1/16 of a point to yield 1.69%.
The market's (M criteria) quick evaporation of leadership (stocks hitting new 52-week highs) and decisive pullback on higher volume is a sign of more worrisome distributional pressure. The damaging action of late has arguably ended the latest rally. Investors should be watchful for technical sell signals and be ready to reduce market exposure until broader strength returns and is noted. The most noteworthy and actionable leaders are listed on the Featured Stocks page.
Watch for an announcement via email concerning the next WEBCAST. The webcast will also be available via an updated link highlighted at the top of the Premium Member Homepage.
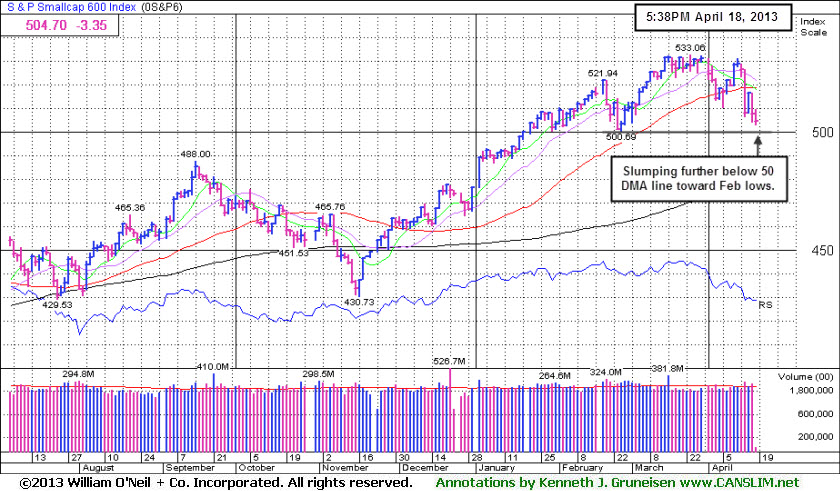
PICTURED: The S&P Small-Cap 600 Index slumped further below its 50-day moving average (DMA) line, sinking toward its February lows.
|
 Kenneth J. Gruneisen started out as a licensed stockbroker in August 1987, a couple of months prior to the historic stock market crash that took the Dow Jones Industrial Average down -22.6% in a single day. He has published daily fact-based fundamental and technical analysis on high-ranked stocks online for two decades. Through FACTBASEDINVESTING.COM, Kenneth provides educational articles, news, market commentary, and other information regarding proven investment systems that work in good times and bad.
Comments contained in the body of this report are technical opinions only and are not necessarily those of Gruneisen Growth Corp. The material herein has been obtained from sources believed to be reliable and accurate, however, its accuracy and completeness cannot be guaranteed. Our firm, employees, and customers may effect transactions, including transactions contrary to any recommendation herein, or have positions in the securities mentioned herein or options with respect thereto. Any recommendation contained in this report may not be suitable for all investors and it is not to be deemed an offer or solicitation on our part with respect to the purchase or sale of any securities. |
|
 |
Commodity-Linked Groups Rallied Against Broader Declines
Kenneth J. Gruneisen - Passed the CAN SLIM® Master's Exam
Commodity-linked groups rose on Thursday. Energy-related shares had a positive bias as the Integrated Oil Index ($XOI +0.45%) and Oil Services Index ($OSX +1.16%) posted small gains. The Gold & Silver Index ($XAU +2.89%) was a standout gainer as it bounced back from recent losses. The Healthcare Index ($HMO -2.26%) was among Thursday's worst laggards. The tech sector saw unanimous losses from the Networking Index ($NWX -1.89%), Internet Index ($IIX -1.72%), Biotechnology Index ($BTK -1.41%), and the Semiconductor Index ($SOX -0.90%). The Retail Index ($RLX -1.19%) fell, and financial indexes also added to the market's negative bias as the Broker/Dealer Index ($XBD -1.39%) and the Bank Index ($BKX -0.90%) both lost ground.
Charts courtesy www.stockcharts.com
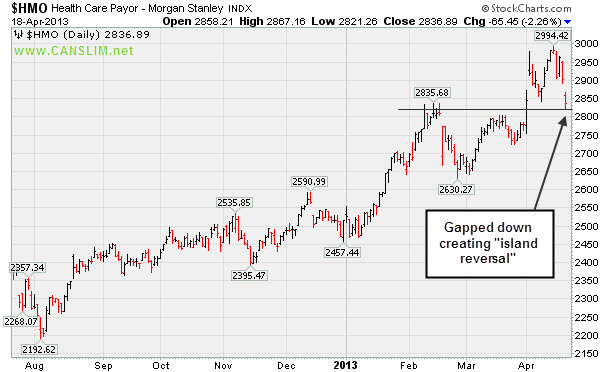
PICTURED: The Healthcare Index ($HMO -2.26%) gapped down, creating an "island reversal" after the strong start to April, which began with a gap up.
| Oil Services |
$OSX |
237.31 |
+2.71 |
+1.16% |
+7.79% |
| Healthcare |
$HMO |
2,836.89 |
-65.45 |
-2.26% |
+12.84% |
| Integrated Oil |
$XOI |
1,280.81 |
+5.73 |
+0.45% |
+3.14% |
| Semiconductor |
$SOX |
413.88 |
-3.77 |
-0.90% |
+7.76% |
| Networking |
$NWX |
215.71 |
-4.15 |
-1.89% |
-4.78% |
| Internet |
$IIX |
348.17 |
-6.10 |
-1.72% |
+6.47% |
| Broker/Dealer |
$XBD |
107.12 |
-1.51 |
-1.39% |
+13.56% |
| Retail |
$RLX |
727.99 |
-8.78 |
-1.19% |
+11.47% |
| Gold & Silver |
$XAU |
101.71 |
+2.86 |
+2.89% |
-38.58% |
| Bank |
$BKX |
54.03 |
-0.49 |
-0.90% |
+5.36% |
| Biotech |
$BTK |
1,811.35 |
-25.86 |
-1.41% |
+17.09% |
|
|
|
 |
Fundamental And Recent Technical Action Lackluster
Kenneth J. Gruneisen - Passed the CAN SLIM® Master's Exam
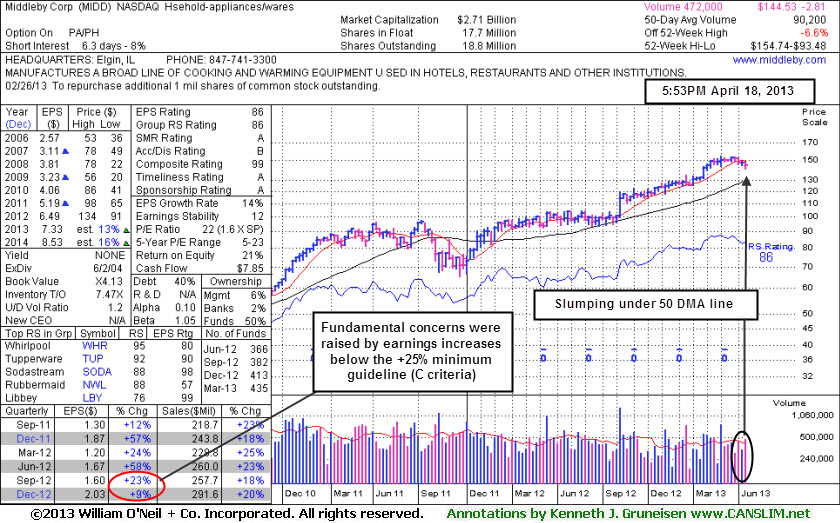
Middleby Corp (MIDD +$1.51 or +1.06% to $144.53) is still lingering below its 50-day moving average (DMA) line, and it recently slumped under prior lows in the $144 area raising greater concerns. Technically, a rebound above its 50 DMA line is needed for its outlook to improve. It Relative Strength rating is 86 and it is only -6.6% off its 52-week high. Fundamental concerns were repeatedly noted since its last appearance in this FSU section on 3/25/13 with an annotated graph under the headline, "Resilient Leader Still Near Highs After Fundamental Flaws Raised Concerns". Prior reports noted - "Disciplined investors may watch closely for sell signals if holding it and giving it a chance to produce more climactic gains."
Earnings +9% on +20% sales for the Dec '12 quarter marked its 2nd consecutive quarterly comparison with an earnings increase below the +25% minimum earnings guideline (C criteria), raising more concerns. The number of top-rated funds owning its shares rose from 351 in Dec '11 to 435 in Mar '13, a reassuring sign concerning the I criteria. Its small supply (S criteria) of only 17.1 million shares in the public float can contribute to greater price volatility in the event of institutional buying or selling. Based on its recent fundamental and technical weakness it will be dropped from the Featured Stocks list tonight.
|
|
|
Color Codes Explained :
Y - Better candidates highlighted by our
staff of experts.
G - Previously featured
in past reports as yellow but may no longer be buyable under the
guidelines.
***Last / Change / Volume data in this table is the closing quote data***
Symbol/Exchange
Company Name
Industry Group |
PRICE |
CHANGE
(%Change) |
Day High |
Volume
(% DAV)
(% 50 day avg vol) |
52 Wk Hi
% From Hi |
Featured
Date |
Price
Featured |
Pivot Featured |
|
Max Buy |
AMBA
-
NASDAQ
Ambarella Inc
ELECTRONICS - Semiconductor - Specialized
|
$12.42
|
-0.58
-4.46% |
$13.15
|
475,997
130.16% of 50 DAV
50 DAV is 365,700
|
$16.00
-22.38%
|
3/26/2013
|
$15.31
|
PP = $14.83
|
|
MB = $15.57
|
 Most Recent Note - 4/18/2013 6:13:50 PM
Down again on above average volume, trading near its 50 DMA line. It may find support near that important short-term average, but based on recent distributional action it will be dropped from the Featured Stocks list tonight.
>>> The latest Featured Stock Update with an annotated graph appeared on 4/17/2013. Click here.
View all notes |
Alert me of new notes |
CANSLIM.net Company Profile |
SEC |
Zacks Reports |
StockTalk |
News |
Chart |
Request a new note
C
A N
S L
I M


|
CELG
-
NASDAQ
Celgene Corp
DRUGS - Drug Manufacturers - Major
|
$119.08
|
-2.26
-1.86% |
$121.34
|
2,192,768
71.03% of 50 DAV
50 DAV is 3,087,200
|
$124.10
-4.05%
|
3/27/2013
|
$113.24
|
PP = $115.54
|
|
MB = $121.32
|
Most Recent Note - 4/12/2013 3:09:14 PM
G - Color code is changed to green as it is now extended from any sound base pattern after wedging to new highs from an advanced "3-weeks tight" base with only average volume behind its gains
>>> The latest Featured Stock Update with an annotated graph appeared on 3/28/2013. Click here.
View all notes |
Alert me of new notes |
CANSLIM.net Company Profile |
SEC |
Zacks Reports |
StockTalk |
News |
Chart |
Request a new note
C
A N
S L
I M
|
CFNL
-
NASDAQ
Cardinal Financial Corp
BANKING - Regional - Southeast Banks
|
$15.68
|
-0.69
-4.22% |
$16.40
|
511,949
248.52% of 50 DAV
50 DAV is 206,000
|
$18.40
-14.78%
|
3/22/2013
|
$17.99
|
PP = $18.29
|
|
MB = $19.20
|
Most Recent Note - 4/18/2013 6:24:16 PM
G - Slumped further below its 50 DMA line today with another damaging loss on above average volume raising more serious concerns. Only a prompt rebound above that important short-term average would help its outlook improve.
>>> The latest Featured Stock Update with an annotated graph appeared on 4/10/2013. Click here.
View all notes |
Alert me of new notes |
CANSLIM.net Company Profile |
SEC |
Zacks Reports |
StockTalk |
News |
Chart |
Request a new note
C
A N
S L
I M
|
CMCSA
-
NASDAQ
Comcast Corp Cl A
MEDIA - CATV Systems
|
$39.99
|
-0.63
-1.54% |
$40.76
|
16,178,145
113.78% of 50 DAV
50 DAV is 14,218,600
|
$42.61
-6.15%
|
12/3/2012
|
$37.08
|
PP = $38.06
|
|
MB = $39.96
|
Most Recent Note - 4/16/2013 6:41:09 PM
G - Hovering near its 52-week high after finding recent support and rallying from its 50 DMA line. See the latest FSU analysis for more details and a new annotated graph.
>>> The latest Featured Stock Update with an annotated graph appeared on 4/16/2013. Click here.
View all notes |
Alert me of new notes |
CANSLIM.net Company Profile |
SEC |
Zacks Reports |
StockTalk |
News |
Chart |
Request a new note
C
A N
S L
I M
|
EVER
-
NYSE
Everbank Financial Corp
BANKING
|
$14.19
|
-0.09
-0.63% |
$14.41
|
325,052
34.72% of 50 DAV
50 DAV is 936,100
|
$17.29
-17.93%
|
3/4/2013
|
$15.38
|
PP = $15.83
|
|
MB = $16.62
|
Most Recent Note - 4/12/2013 3:14:16 PM
G - Still holding its ground near its 50 DMA line ($15.15 now). That important short-term average has acted as support since damaging losses violated prior highs in the $16 area raising concerns while completely negating its prior technical breakout. Its Relative Strength (RS) rating has slumped to 70, below the 80+ minimum guideline for buy candidates.
>>> The latest Featured Stock Update with an annotated graph appeared on 4/2/2013. Click here.
View all notes |
Alert me of new notes |
CANSLIM.net Company Profile |
SEC |
Zacks Reports |
StockTalk |
News |
Chart |
Request a new note
C
A N
S L
I M
|
Symbol/Exchange
Company Name
Industry Group |
PRICE |
CHANGE
(%Change) |
Day High |
Volume
(% DAV)
(% 50 day avg vol) |
52 Wk Hi
% From Hi |
Featured
Date |
Price
Featured |
Pivot Featured |
|
Max Buy |
FLT
-
NYSE
Fleetcor Technologies
DIVERSIFIED SERVICES - Business/Management Services
|
$72.42
|
-1.68
-2.27% |
$74.30
|
660,223
78.65% of 50 DAV
50 DAV is 839,400
|
$78.87
-8.18%
|
3/21/2013
|
$71.14
|
PP = $73.00
|
|
MB = $76.65
|
Most Recent Note - 4/15/2013 7:56:38 PM
Y - Enduring mild distributional pressure above prior highs in the $72 area defining near-term support above its 50 DMA line. See the latest FSU analysis for more details and a new annotated graph.
>>> The latest Featured Stock Update with an annotated graph appeared on 4/15/2013. Click here.
View all notes |
Alert me of new notes |
CANSLIM.net Company Profile |
SEC |
Zacks Reports |
StockTalk |
News |
Chart |
Request a new note
C
A N
S L
I M
|
LNKD
-
NYSE
Linkedin Corp Class A
INTERNET - Internet Information Providers
|
$173.81
|
-6.16
-3.42% |
$180.45
|
1,987,492
77.82% of 50 DAV
50 DAV is 2,554,100
|
$186.06
-6.58%
|
4/12/2013
|
$182.69
|
PP = $184.25
|
|
MB = $193.46
|
Most Recent Note - 4/16/2013 6:43:53 PM
Y - Traded up today with lighter volume. Color code was changed to yellow with a new pivot point cited based on its 3/14/18 high plus 10 cents while forming a short 5-week flat base pattern. Volume-driven gains above the pivot point may trigger a new (or add-on) technical buy signal. Its 50 DMA line and recent low define important near-term chart support to watch.
>>> The latest Featured Stock Update with an annotated graph appeared on 4/5/2013. Click here.
View all notes |
Alert me of new notes |
CANSLIM.net Company Profile |
SEC |
Zacks Reports |
StockTalk |
News |
Chart |
Request a new note
C
A N
S L
I M
|
MIDD
-
NASDAQ
Middleby Corp
MANUFACTURING - Diversified Machinery
|
$144.53
|
+1.51
1.06% |
$145.89
|
136,427
151.25% of 50 DAV
50 DAV is 90,200
|
$154.74
-6.60%
|
10/8/2012
|
$118.46
|
PP = $122.67
|
|
MB = $128.80
|
Most Recent Note - 4/18/2013 6:16:22 PM
Based on lackluster price/volume action and fundamental concerns previously noted it will be dropped from the Featured Stocks list tonight. See the latest FSU analysis for more details and a new annotated graph.
>>> The latest Featured Stock Update with an annotated graph appeared on 4/18/2013. Click here.
View all notes |
Alert me of new notes |
CANSLIM.net Company Profile |
SEC |
Zacks Reports |
StockTalk |
News |
Chart |
Request a new note
C
A N
S L
I M
|
MNTX
-
NASDAQ
Manitex International
MANUFACTURING - Diversified Machinery
|
$10.02
|
-0.27
-2.62% |
$10.27
|
190,795
94.50% of 50 DAV
50 DAV is 201,900
|
$13.14
-23.74%
|
3/20/2013
|
$11.29
|
PP = $12.05
|
|
MB = $12.65
|
Most Recent Note - 4/18/2013 6:17:47 PM
Slumped further below its 50 DMA line today on average volume. A rally above that important short-term average is needed for its outlook to improve. Based on weak action it will be dropped from the Featured Stocks list tonight.
>>> The latest Featured Stock Update with an annotated graph appeared on 4/12/2013. Click here.
View all notes |
Alert me of new notes |
CANSLIM.net Company Profile |
SEC |
Zacks Reports |
StockTalk |
News |
Chart |
Request a new note
C
A N
S L
I M
|
MRLN
-
NASDAQ
Marlin Business Services
DIVERSIFIED SERVICES - Rental and Leasing Services
|
$22.16
|
+1.53
7.42% |
$22.41
|
40,347
158.22% of 50 DAV
50 DAV is 25,500
|
$23.98
-7.59%
|
3/15/2013
|
$22.29
|
PP = $23.18
|
|
MB = $24.34
|
Most Recent Note - 4/18/2013 6:19:09 PM
Y - Color code is changed back to yellow as it promptly rebounded above its 50 DMA line with a gain today backed by higher volume, an encouraging sign of institutional support. Subsequent deterioration below the recent low ($20.10)or its 200 DMA line would raise more serious concerns and trigger additional sell signals.
>>> The latest Featured Stock Update with an annotated graph appeared on 4/9/2013. Click here.
View all notes |
Alert me of new notes |
CANSLIM.net Company Profile |
SEC |
Zacks Reports |
StockTalk |
News |
Chart |
Request a new note
C
A N
S L
I M
|
Symbol/Exchange
Company Name
Industry Group |
PRICE |
CHANGE
(%Change) |
Day High |
Volume
(% DAV)
(% 50 day avg vol) |
52 Wk Hi
% From Hi |
Featured
Date |
Price
Featured |
Pivot Featured |
|
Max Buy |
MWIV
-
NASDAQ
M W I Veterinary Supply
HEALTH SERVICES - Medical Instruments and; Supplies
|
$121.80
|
-0.43
-0.35% |
$122.84
|
47,109
82.21% of 50 DAV
50 DAV is 57,300
|
$137.18
-11.21%
|
3/4/2013
|
$130.90
|
PP = $129.45
|
|
MB = $135.92
|
Most Recent Note - 4/15/2013 8:01:13 PM
G - Color code is changed to green after today's loss violated its 50 DMA line triggering a technical sell signal. Only a prompt rebound above that important short-term average would help its outlook improve.
>>> The latest Featured Stock Update with an annotated graph appeared on 4/4/2013. Click here.
View all notes |
Alert me of new notes |
CANSLIM.net Company Profile |
SEC |
Zacks Reports |
StockTalk |
News |
Chart |
Request a new note
C
A N
S L
I M
|
N
-
NYSE
Netsuite Inc
DIVERSIFIED SERVICES - Business/Management Services
|
$78.03
|
-0.87
-1.10% |
$79.29
|
224,048
63.01% of 50 DAV
50 DAV is 355,600
|
$80.33
-2.86%
|
12/12/2012
|
$64.75
|
PP = $67.12
|
|
MB = $70.48
|
Most Recent Note - 4/16/2013 6:47:10 PM
G - Hovering near its all-time high, extended after a recent streak of 7 consecutive weekly gains. Its 50 DMA line ($73.58 now) defines important near-term support to watch.
>>> The latest Featured Stock Update with an annotated graph appeared on 4/1/2013. Click here.
View all notes |
Alert me of new notes |
CANSLIM.net Company Profile |
SEC |
Zacks Reports |
StockTalk |
News |
Chart |
Request a new note
C
A N
S L
I M
|
PRLB
-
NYSE
Proto Labs Inc
MANUFACTURING - Small Tools and Accessories
|
$44.80
|
-2.21
-4.70% |
$47.37
|
790,128
137.87% of 50 DAV
50 DAV is 573,100
|
$55.23
-18.88%
|
4/10/2013
|
$49.97
|
PP = $54.01
|
|
MB = $56.71
|
Most Recent Note - 4/18/2013 6:21:49 PM
Slumped further below its 50 DMA line today with its 4th loss with above average volume in the span of 5 sessions. A rebound above its short-term average is needed for its outlook to improve. Due to weak action it will be dropped from the Featured Stocks list tonight.
>>> The latest Featured Stock Update with an annotated graph appeared on 4/11/2013. Click here.
View all notes |
Alert me of new notes |
CANSLIM.net Company Profile |
SEC |
Zacks Reports |
StockTalk |
News |
Chart |
Request a new note
C
A N
S L
I M
|
RRTS
-
NYSE
Roadrunner Trans Systems
TRANSPORTATION - Air Delivery and Freight Service
|
$21.84
|
-0.04
-0.18% |
$22.00
|
101,609
50.33% of 50 DAV
50 DAV is 201,900
|
$23.88
-8.54%
|
4/3/2013
|
$22.77
|
PP = $23.75
|
|
MB = $24.94
|
Most Recent Note - 4/17/2013 11:39:46 AM
G - Color code is changed to green after violating the recent low and its 50 DMA line triggering technical sell signals. Only a prompt rebound above that important short-term average would help its outlook improve.
>>> The latest Featured Stock Update with an annotated graph appeared on 4/3/2013. Click here.
View all notes |
Alert me of new notes |
CANSLIM.net Company Profile |
SEC |
Zacks Reports |
StockTalk |
News |
Chart |
Request a new note
C
A N
S L
I M
|
VRX
-
NYSE
Valeant Pharmaceuticals
DRUGS - Drug Manufacturers - Other
|
$72.81
|
-0.05
-0.07% |
$73.00
|
811,423
60.74% of 50 DAV
50 DAV is 1,336,000
|
$76.56
-4.90%
|
12/20/2012
|
$60.24
|
PP = $61.21
|
|
MB = $64.27
|
Most Recent Note - 4/15/2013 11:47:27 AM
G - Still consolidating above its 50 DMA line ($69.84 now) defining important near-term support.
>>> The latest Featured Stock Update with an annotated graph appeared on 4/8/2013. Click here.
View all notes |
Alert me of new notes |
CANSLIM.net Company Profile |
SEC |
Zacks Reports |
StockTalk |
News |
Chart |
Request a new note
C
A N
S L
I M
|
Symbol/Exchange
Company Name
Industry Group |
PRICE |
CHANGE
(%Change) |
Day High |
Volume
(% DAV)
(% 50 day avg vol) |
52 Wk Hi
% From Hi |
Featured
Date |
Price
Featured |
Pivot Featured |
|
Max Buy |
|
|
|
THESE ARE NOT BUY RECOMMENDATIONS!
Comments contained in the body of this report are technical
opinions only. The material herein has been obtained
from sources believed to be reliable and accurate, however,
its accuracy and completeness cannot be guaranteed.
This site is not an investment advisor, hence it does
not endorse or recommend any securities or other investments.
Any recommendation contained in this report may not
be suitable for all investors and it is not to be deemed
an offer or solicitation on our part with respect to
the purchase or sale of any securities. All trademarks,
service marks and trade names appearing in this report
are the property of their respective owners, and are
likewise used for identification purposes only.
This report is a service available
only to active Paid Premium Members.
You may opt-out of receiving report notifications
at any time. Questions or comments may be submitted
by writing to Premium Membership Services 665 S.E. 10 Street, Suite 201 Deerfield Beach, FL 33441-5634 or by calling 1-800-965-8307
or 954-785-1121.
|
|
|

