***Last / Change / Volume data in this table is the closing quote data***
Symbol/Exchange
Company Name
Industry Group |
PRICE |
CHANGE
(%Change) |
Day High |
Volume
(% DAV)
(% 50 day avg vol) |
52 Wk Hi
% From Hi |
Featured
Date |
Price
Featured |
Pivot Featured |
|
Max Buy |
AIXG
-
NASDAQ
Aixtron Se
ELECTRONICS - Semiconductor Equipment andamp; Mate
|
$39.60
|
-1.79
-4.32% |
$40.01
|
384,238
153.33% of 50 DAV
50 DAV is 250,600
|
$44.96
-11.92%
|
4/5/2011
|
$44.14
|
PP = $44.64
|
|
MB = $46.87
|
 Most Recent Note - 4/18/2011 10:48:44 AM
G - Gapped down today, diving toward prior lows in the $38 area previously noted as the next support after a violation of its 50 DMA last week raised concerns. A rebound above its 50 DMA would help its outlook, otherwise the path of least resistance could lead to an eventual test of its 200 DMA line. As previously noted - "Disciplined investors watch for proof of institutional buying demand and avoid the urge to get in 'early'".
>>> The latest Featured Stock Update with an annotated graph appeared on 4/5/2011. Click here.
View all notes |
Alert me of new notes |
CANSLIM.net Company Profile |
SEC |
Zacks Reports |
StockTalk |
News |
Chart |
Request a new note
C
A N
S L
I M


|
BIDU
-
NASDAQ
Baidu Inc Ads
INTERNET - Internet Information Providers
|
$145.89
|
-0.92
-0.63% |
$145.95
|
8,010,200
116.85% of 50 DAV
50 DAV is 6,855,200
|
$148.92
-2.03%
|
3/17/2011
|
$121.97
|
PP = $131.73
|
|
MB = $138.32
|
Most Recent Note - 4/18/2011 11:57:43 AM
G - Gapped down today amid widespread market weakness, yet it is up from the session's earlier lows. It is extended from its latest base, and the prior high near $131 defines initial chart support to watch near its rising 50 DMA line. The market's recent uptrend was noted as "under pressure" in the daily commentary (M criteria calling for caution).
>>> The latest Featured Stock Update with an annotated graph appeared on 4/7/2011. Click here.
View all notes |
Alert me of new notes |
CANSLIM.net Company Profile |
SEC |
Zacks Reports |
StockTalk |
News |
Chart |
Request a new note
C
A N
S L
I M
|
CMG
-
NYSE
Chipotle Mexican Grill
LEISURE - Restaurants
|
$283.37
|
-1.76
-0.62% |
$285.08
|
787,065
69.82% of 50 DAV
50 DAV is 1,127,300
|
$285.97
-0.91%
|
4/1/2011
|
$274.00
|
PP = $275.10
|
|
MB = $288.86
|
Most Recent Note - 4/15/2011 4:07:45 PM
Y - Today's 4th consecutive small gain with below average volume helped it wedge higher for a new all-time high close. The investment system requires a gain above a stock's pivot point with volume +40-50% above average, or preferably much heavier, to trigger a proper technical buy signal. Its 50 DMA line ($258.98 now) defines important chart support to watch.
>>> The latest Featured Stock Update with an annotated graph appeared on 4/13/2011. Click here.
View all notes |
Alert me of new notes |
CANSLIM.net Company Profile |
SEC |
Zacks Reports |
StockTalk |
News |
Chart |
Request a new note
C
A N
S L
I M
|
CTCT
-
NASDAQ
Constant Contact Inc
MEDIA - Advertising Services
|
$31.68
|
-1.32
-4.00% |
$32.67
|
362,863
79.45% of 50 DAV
50 DAV is 456,700
|
$36.33
-12.80%
|
3/22/2011
|
$33.59
|
PP = $32.49
|
|
MB = $34.11
|
Most Recent Note - 4/18/2011 11:43:27 AM
G - Gapped down today amid widespread market weakness, testing its 50 DMA line and prior highs near $32. Following an analyst downgrade Friday it gapped down and violated prior highs and its 50 DMA line, trading -13.9% before rebounding to close near the session high. Due to report earnings after the close on Thursday, April 28th.
>>> The latest Featured Stock Update with an annotated graph appeared on 3/22/2011. Click here.
View all notes |
Alert me of new notes |
CANSLIM.net Company Profile |
SEC |
Zacks Reports |
StockTalk |
News |
Chart |
Request a new note
C
A N
S L
I M
|
CTSH
-
NASDAQ
Cognizant Tech Sol Cl A
COMPUTER SOFTWARE and SERVICES - Business Software and Services
|
$77.97
|
-0.75
-0.95% |
$78.02
|
2,573,335
113.04% of 50 DAV
50 DAV is 2,276,500
|
$82.86
-5.90%
|
2/7/2011
|
$75.09
|
PP = $76.46
|
|
MB = $80.28
|
Most Recent Note - 4/18/2011 11:45:51 AM
G - Gapped down today amid widespread market weakness following a damaging loss on 4/15/11 with high volume. Trading near prior highs in the $77-78 area previously noted as chart support to watch above its 50 DMA line. See the latest FSU analysis for more details and a new annotated graph.
>>> The latest Featured Stock Update with an annotated graph appeared on 4/15/2011. Click here.
View all notes |
Alert me of new notes |
CANSLIM.net Company Profile |
SEC |
Zacks Reports |
StockTalk |
News |
Chart |
Request a new note
C
A N
S L
I M
|
Symbol/Exchange
Company Name
Industry Group |
PRICE |
CHANGE
(%Change) |
Day High |
Volume
(% DAV)
(% 50 day avg vol) |
52 Wk Hi
% From Hi |
Featured
Date |
Price
Featured |
Pivot Featured |
|
Max Buy |
DECK
-
NASDAQ
Deckers Outdoor Corp
CONSUMER NON-DURABLES - Textile - Apparel Footwear
|
$92.21
|
-2.06
-2.19% |
$93.33
|
1,004,493
73.67% of 50 DAV
50 DAV is 1,363,500
|
$95.49
-3.43%
|
2/3/2011
|
$79.61
|
PP = $82.67
|
|
MB = $86.80
|
Most Recent Note - 4/18/2011 11:09:00 AM
G - Gapped down today amid widespread market weakness. Last week it rallied for a new all-time high from a shorter than minimum length "cup-with-handle" type consolidation previously noted. Its 50 DMA line defines initial chart support to watch.
>>> The latest Featured Stock Update with an annotated graph appeared on 4/6/2011. Click here.
View all notes |
Alert me of new notes |
CANSLIM.net Company Profile |
SEC |
Zacks Reports |
StockTalk |
News |
Chart |
Request a new note
C
A N
S L
I M
|
EZPW
-
NASDAQ
Ezcorp Inc Cl A
SPECIALTY RETAIL - Specialty Retail, Other
|
$28.30
|
-0.61
-2.11% |
$28.71
|
317,957
92.48% of 50 DAV
50 DAV is 343,800
|
$33.08
-14.45%
|
2/18/2011
|
$27.94
|
PP = $30.04
|
|
MB = $31.54
|
Most Recent Note - 4/18/2011 11:37:28 AM
G - Small gap down today amid widespread market weakness. Trading below its 50 DMA line and under prior highs in the $29-30 area previously noted as important support to watch. Gains have lacked volume conviction since damaging losses triggered technical sell signals.
>>> The latest Featured Stock Update with an annotated graph appeared on 4/11/2011. Click here.
View all notes |
Alert me of new notes |
CANSLIM.net Company Profile |
SEC |
Zacks Reports |
StockTalk |
News |
Chart |
Request a new note
C
A N
S L
I M
|
FOSL
-
NASDAQ
Fossil Inc
CONSUMER DURABLES - Recreational Goods, Other
|
$91.84
|
-2.64
-2.79% |
$93.25
|
760,861
76.18% of 50 DAV
50 DAV is 998,800
|
$95.39
-3.72%
|
2/1/2011
|
$73.30
|
PP = $74.44
|
|
MB = $78.16
|
Most Recent Note - 4/18/2011 10:52:21 AM
G - Gapped down today, pulling back amid widespread market weakness. It rallied more than +108% higher in 8 months since first featured in yellow in the 8/10/10 mid-day report (read here). It could produce more climactic gains, but recently it has been noted - "Extended from any sound base. Prior highs in the $83-85 area define chart support to watch above its 50 DMA line."
>>> The latest Featured Stock Update with an annotated graph appeared on 3/30/2011. Click here.
View all notes |
Alert me of new notes |
CANSLIM.net Company Profile |
SEC |
Zacks Reports |
StockTalk |
News |
Chart |
Request a new note
C
A N
S L
I M
|
HMSY
-
NASDAQ
H M S Holdings Corp
COMPUTER SOFTWARE and SERVICES - Healthcare Information Service
|
$80.54
|
-1.54
-1.88% |
$81.77
|
201,255
125.31% of 50 DAV
50 DAV is 160,600
|
$84.82
-5.05%
|
11/19/2010
|
$61.89
|
PP = $63.01
|
|
MB = $66.16
|
Most Recent Note - 4/14/2011 5:16:42 PM
G - Perched -4.0% below its all-time high with volume totals cooling in recent weeks. It is extended from any sound base pattern. Its 50 DMA line ($77.12 now) defines support to watch on pullbacks.
>>> The latest Featured Stock Update with an annotated graph appeared on 3/25/2011. Click here.
View all notes |
Alert me of new notes |
CANSLIM.net Company Profile |
SEC |
Zacks Reports |
StockTalk |
News |
Chart |
Request a new note
C
A N
S L
I M
|
HS
-
NYSE
Healthspring Inc
HEALTH SERVICES - Health Care Plans
|
$37.83
|
-0.71
-1.84% |
$38.15
|
963,179
113.06% of 50 DAV
50 DAV is 851,900
|
$40.78
-7.23%
|
3/22/2011
|
$38.29
|
PP = $38.85
|
|
MB = $40.79
|
Most Recent Note - 4/18/2011 6:25:15 PM
Y - Small gap down today for loss on slightly higher volume was a sign of distributional pressure. Its pullback below its pivot point last week technically negated its 4/01/11 breakout. Its nearby 50 DMA line ($36.74 now) defines important support above recent lows in the $35.50 area.
>>> The latest Featured Stock Update with an annotated graph appeared on 3/23/2011. Click here.
View all notes |
Alert me of new notes |
CANSLIM.net Company Profile |
SEC |
Zacks Reports |
StockTalk |
News |
Chart |
Request a new note
C
A N
S L
I M
|
Symbol/Exchange
Company Name
Industry Group |
PRICE |
CHANGE
(%Change) |
Day High |
Volume
(% DAV)
(% 50 day avg vol) |
52 Wk Hi
% From Hi |
Featured
Date |
Price
Featured |
Pivot Featured |
|
Max Buy |
INFA
-
NASDAQ
Informatica Corp
COMPUTER SOFTWARE and SERVICES - Business Software and Services
|
$51.56
|
-1.53
-2.88% |
$52.58
|
1,871,051
218.99% of 50 DAV
50 DAV is 854,400
|
$53.95
-4.43%
|
3/24/2011
|
$50.04
|
PP = $49.86
|
|
MB = $52.35
|
Most Recent Note - 4/18/2011 11:01:34 AM
G - Gapped down today, slumping below its "max buy" level amid widespread market weakness. Prior highs in the $49 area define support to watch coinciding with its 50 DMA line. Subsequent violations would raise concerns and may trigger technical sell signals. The market's recent uptrend was noted as "under pressure" in the daily commentary (M criteria calling for caution).
>>> The latest Featured Stock Update with an annotated graph appeared on 3/28/2011. Click here.
View all notes |
Alert me of new notes |
CANSLIM.net Company Profile |
SEC |
Zacks Reports |
StockTalk |
News |
Chart |
Request a new note
C
A N
S L
I M
|
LULU
-
NASDAQ
Lululemon Athletica
MANUFACTURING - Textile Manufacturing
|
$96.86
|
+3.58
3.84% |
$97.00
|
3,083,040
133.51% of 50 DAV
50 DAV is 2,309,300
|
$94.98
1.98%
|
3/28/2011
|
$68.11
|
PP = $85.38
|
|
MB = $89.65
|
Most Recent Note - 4/18/2011 6:21:15 PM
G - Considerable gain today with above average volume for a new all-time high, bucking the mostly negative market environment. Prior highs in the $85 area define initial chart support to watch.
>>> The latest Featured Stock Update with an annotated graph appeared on 3/31/2011. Click here.
View all notes |
Alert me of new notes |
CANSLIM.net Company Profile |
SEC |
Zacks Reports |
StockTalk |
News |
Chart |
Request a new note
C
A N
S L
I M
|
MG
-
NYSE
Mistras Group Inc
DIVERSIFIED SERVICES - Bulding and Faci;ity Management Services
|
$17.90
|
+0.02
0.11% |
$18.00
|
98,272
77.81% of 50 DAV
50 DAV is 126,300
|
$18.22
-1.76%
|
3/15/2011
|
$15.48
|
PP = $15.90
|
|
MB = $16.70
|
Most Recent Note - 4/15/2011 1:05:51 PM
G - Holding its ground today following a considerable gap up gain on 4/14/11 for a new all-time high. It is extended from any sound base pattern, meanwhile its 50 DMA line and prior highs define important support to watch. Recently reported earnings +200% on +23% sales revenues for the quarter ended February 28, 2011 versus the year-ago period.
>>> The latest Featured Stock Update with an annotated graph appeared on 4/12/2011. Click here.
View all notes |
Alert me of new notes |
CANSLIM.net Company Profile |
SEC |
Zacks Reports |
StockTalk |
News |
Chart |
Request a new note
C
A N
S L
I M
|
MWIV
-
NASDAQ
M W I Veterinary Supply
HEALTH SERVICES - Medical Instruments and; Supplies
|
$80.38
|
-0.65
-0.80% |
$81.31
|
140,716
147.81% of 50 DAV
50 DAV is 95,200
|
$81.63
-1.53%
|
11/4/2010
|
$61.79
|
PP = $59.60
|
|
MB = $62.58
|
Most Recent Note - 4/18/2011 12:46:51 PM
G - Pulling back today from its all-time high hit on the prior session. Its 50 DMA line defines important support to watch. It has been repeatedly noted - "Extended from any sound base pattern."
>>> The latest Featured Stock Update with an annotated graph appeared on 4/8/2011. Click here.
View all notes |
Alert me of new notes |
CANSLIM.net Company Profile |
SEC |
Zacks Reports |
StockTalk |
News |
Chart |
Request a new note
C
A N
S L
I M
|
OPEN
-
NASDAQ
Opentable Inc
INTERNET - Internet Software and Services
|
$107.62
|
+2.62
2.50% |
$107.90
|
1,508,133
115.23% of 50 DAV
50 DAV is 1,308,800
|
$112.78
-4.58%
|
3/17/2011
|
$90.71
|
PP = $96.07
|
|
MB = $100.87
|
Most Recent Note - 4/18/2011 6:23:09 PM
G - After a small gap down it managed a positive reversal and closed near the session high with a gain on slightly above average volume. Repeatedly noted - "Extended from its latest base. Prior highs near $96 and its 50 DMA line define support to watch on pullbacks.
>>> The latest Featured Stock Update with an annotated graph appeared on 3/24/2011. Click here.
View all notes |
Alert me of new notes |
CANSLIM.net Company Profile |
SEC |
Zacks Reports |
StockTalk |
News |
Chart |
Request a new note
C
A N
S L
I M
|
Symbol/Exchange
Company Name
Industry Group |
PRICE |
CHANGE
(%Change) |
Day High |
Volume
(% DAV)
(% 50 day avg vol) |
52 Wk Hi
% From Hi |
Featured
Date |
Price
Featured |
Pivot Featured |
|
Max Buy |
PAY
-
NYSE
Verifone Systems Inc
COMPUTER HARDWARE - Transaction Automation Systems
|
$52.07
|
-1.70
-3.16% |
$53.20
|
3,334,392
141.97% of 50 DAV
50 DAV is 2,348,700
|
$58.88
-11.57%
|
1/27/2011
|
$41.77
|
PP = $44.97
|
|
MB = $47.22
|
Most Recent Note - 4/18/2011 11:49:26 AM
G - Small gap down today amid widespread market weakness, consolidating above its 50 DMA line ($50.29 now) defining important chart support to watch.
>>> The latest Featured Stock Update with an annotated graph appeared on 4/4/2011. Click here.
View all notes |
Alert me of new notes |
CANSLIM.net Company Profile |
SEC |
Zacks Reports |
StockTalk |
News |
Chart |
Request a new note
C
A N
S L
I M
|
PCLN
-
NASDAQ
Priceline.Com Inc
INTERNET - Internet Software and Services
|
$516.78
|
-3.29
-0.63% |
$517.85
|
1,016,645
84.56% of 50 DAV
50 DAV is 1,202,300
|
$522.00
-1.00%
|
1/3/2011
|
$399.55
|
PP = $428.20
|
|
MB = $449.61
|
Most Recent Note - 4/14/2011 3:43:37 PM
G - It recently stalled after wedging to new 52-week highs without great volume conviction. It as been repeatedly noted - "Extended from any sound base pattern. Its 50 DMA line has defined support throughout its advance."
>>> The latest Featured Stock Update with an annotated graph appeared on 3/21/2011. Click here.
View all notes |
Alert me of new notes |
CANSLIM.net Company Profile |
SEC |
Zacks Reports |
StockTalk |
News |
Chart |
Request a new note
C
A N
S L
I M
|
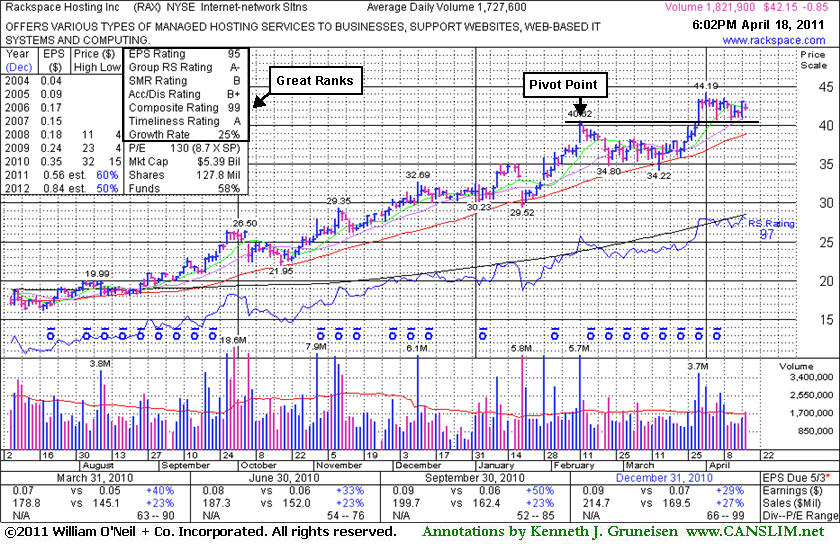
RAX
-
NYSE
Rackspace Hosting Inc
INTERNET - Internet Software and; Services
|
$42.15
|
-0.85
-1.98% |
$42.79
|
1,826,798
105.74% of 50 DAV
50 DAV is 1,727,600
|
$44.19
-4.62%
|
3/16/2011
|
$36.28
|
PP = $40.72
|
|
MB = $42.76
|
Most Recent Note - 4/18/2011 6:19:22 PM
G - Hovering near its all-time highs following latest breakout. Prior highs near $40 define support above its 50 DMA line. See the latest FSU analysis for additional details and a new annotated graph.
>>> The latest Featured Stock Update with an annotated graph appeared on 4/18/2011. Click here.
View all notes |
Alert me of new notes |
CANSLIM.net Company Profile |
SEC |
Zacks Reports |
StockTalk |
News |
Chart |
Request a new note
C
A N
S L
I M
|
TIBX
-
NASDAQ
Tibco Software Inc
COMPUTER SOFTWARE and SERVICES - Business Software and Services
|
$28.91
|
-0.61
-2.07% |
$29.09
|
3,299,424
138.78% of 50 DAV
50 DAV is 2,377,500
|
$29.85
-3.15%
|
3/18/2011
|
$23.88
|
PP = $26.04
|
|
MB = $27.34
|
Most Recent Note - 4/18/2011 11:11:46 AM
G - Small gap down today amid widespread market weakness. It is extended from a sound base after a spurt of volume-driven gains. As previously noted, support is defined by prior highs in the $25-26 area and its 50 DMA line. See the latest FSU analysis for more details and a new annotated graph.
>>> The latest Featured Stock Update with an annotated graph appeared on 4/14/2011. Click here.
View all notes |
Alert me of new notes |
CANSLIM.net Company Profile |
SEC |
Zacks Reports |
StockTalk |
News |
Chart |
Request a new note
C
A N
S L
I M
|
UA
-
NYSE
Under Armour Inc Cl A
CONSUMER NON-DURABLES - Textile - Apparel Clothing
|
$74.11
|
+0.24
0.32% |
$74.60
|
643,680
82.69% of 50 DAV
50 DAV is 778,400
|
$76.85
-3.57%
|
3/31/2011
|
$68.04
|
PP = $70.79
|
|
MB = $74.33
|
Most Recent Note - 4/14/2011 5:12:10 PM
G - Small loss today with lighter than average volume, consolidating below its "max buy" level. The investment system permits investors to accumulate shares on light volume pullbacks, but research has proven that odds are best for a successful trade when buying is done as a stock is moving up in price rather than pulling back No overhead supply remaining to act as resistance. Following its 4/01/11 technical breakout, its prior highs in the $70 area define support to watch.
>>> The latest Featured Stock Update with an annotated graph appeared on 4/1/2011. Click here.
View all notes |
Alert me of new notes |
CANSLIM.net Company Profile |
SEC |
Zacks Reports |
StockTalk |
News |
Chart |
Request a new note
C
A N
S L
I M
|
Symbol/Exchange
Company Name
Industry Group |
PRICE |
CHANGE
(%Change) |
Day High |
Volume
(% DAV)
(% 50 day avg vol) |
52 Wk Hi
% From Hi |
Featured
Date |
Price
Featured |
Pivot Featured |
|
Max Buy |
ULTA
-
NASDAQ
Ulta Salon Cosm & Frag
SPECIALTY RETAIL - Specialty Retail, Other
|
$50.12
|
+0.05
0.10% |
$50.41
|
430,763
69.99% of 50 DAV
50 DAV is 615,500
|
$51.82
-3.28%
|
1/6/2011
|
$36.12
|
PP = $37.34
|
|
MB = $39.21
|
Most Recent Note - 4/14/2011 5:14:32 PM
G - Quietly consolidating just -4.3% off its all-time high today. It is extended from any sound base. Prior highs and its 50 DMA line define chart support to watch near the $44 level on pullbacks.
>>> The latest Featured Stock Update with an annotated graph appeared on 3/29/2011. Click here.
View all notes |
Alert me of new notes |
CANSLIM.net Company Profile |
SEC |
Zacks Reports |
StockTalk |
News |
Chart |
Request a new note
C
A N
S L
I M
|