You are not logged in.
This means you
CAN ONLY VIEW reports that were published prior to Monday, April 21, 2025.
You
MUST UPGRADE YOUR MEMBERSHIP if you want to see any current reports.
AFTER MARKET UPDATE - WEDNESDAY, APRIL 17TH, 2013
Previous After Market Report Next After Market Report >>>
|
|
|
|
DOW |
-138.19 |
14,618.59 |
-0.94% |
|
Volume |
866,011,780 |
+16% |
|
Volume |
1,838,011,050 |
+26% |
|
NASDAQ |
-59.96 |
3,204.67 |
-1.84% |
|
Advancers |
685 |
22% |
|
Advancers |
474 |
19% |
|
S&P 500 |
-22.56 |
1,552.01 |
-1.43% |
|
Decliners |
2,373 |
75% |
|
Decliners |
2,009 |
78% |
|
Russell 2000 |
-16.50 |
906.80 |
-1.79% |
|
52 Wk Highs |
60 |
|
|
52 Wk Highs |
37 |
|
|
S&P 600 |
-8.61 |
508.05 |
-1.67% |
|
52 Wk Lows |
100 |
|
|
52 Wk Lows |
79 |
|
|
 |
Major Averages Slump Into Correction; Leadership Wanes With Damaging Losses on Higher Volume
Kenneth J. Gruneisen - Passed the CAN SLIM® Master's Exam
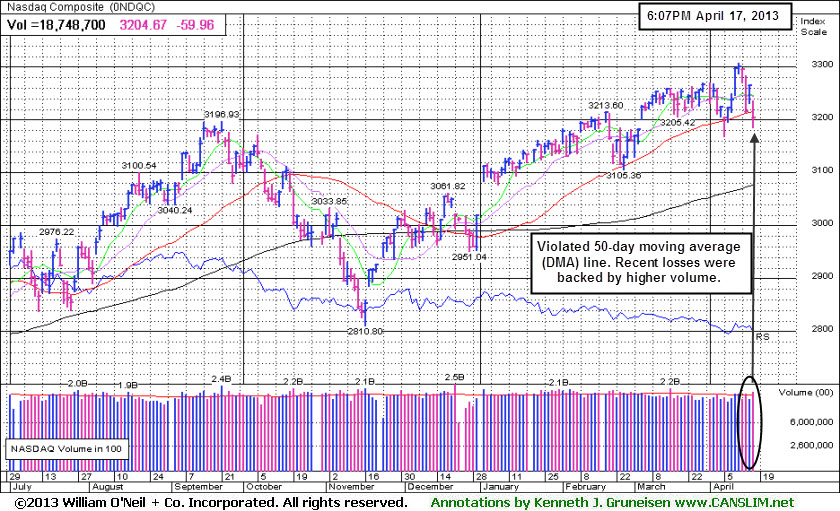
The major averages finished lower on Wednesday, albeit off of their worst levels. The volume totals on the exchanges were reported higher than the prior session totals on the NYSE and on the Nasdaq exchange, action indicating more institutional selling pressure. Breadth was negative as decliners led advancers by more than a 3 to 1 ratio on the NYSE and by more than 4-1 on the Nasdaq exchange. New 52-week lows outnumbered new 52-week highs on the NYSE and on the Nasdaq exchange. There were 9 high-ranked companies from the CANSLIM.net Leaders List making new 52-week highs and appearing on the CANSLIM.net BreakOuts Page, down from the prior session total of 22 stocks. There were losses for all of the 15 high-ranked companies currently included on the Featured Stocks Page.
Stocks were under pressure from the opening bell as investors responded to some disappointing corporate earnings reports and the IMF lowered its global growth forecast. The major averages managed to climb from their lows helped by the Fed's Beige Book survey which showed that the economy continues to grow at a moderate pace.
All 10 sectors on the S&P ended lower led by declines in energy stocks. Shares of Chevron Corp (CVX -1.9%) fell as crude oil prices slipped -2.2% to $86.75 per barrel. On the earnings front, Bank of America Corp (BAC -4.7%) shares sank after the company posted a weaker-than-expected profit tally. Also on the downside, Yahoo Inc (YHOO -0.4%) fell following their disappointing earnings.
Turning to fixed income markets, treasuries were higher along the curve with the benchmark 10-year note up 1/4 of a point to yield 1.70%.
The market's (M criteria) quick evaporation of leadership (stocks hitting new 52-week highs) and decisive pullback on higher volume is a sign of more worrisome distributional pressure. The damaging action of late has arguably ended the latest rally. Investors should be watchful for technical sell signals and be ready to reduce market exposure until broader strength returns and is noted. The most noteworthy and actionable leaders are listed on the Featured Stocks page.
Watch for an announcement via email concerning the next WEBCAST. The webcast will also be available via an updated link highlighted at the top of the Premium Member Homepage.
PICTURED: The Nasdaq Composite Index violated its 50-day moving average (DMA) line. Recent losses were backed by higher volume, action indicative of more worrisome distributional pressure or selling from the institutional crowd.
|
 Kenneth J. Gruneisen started out as a licensed stockbroker in August 1987, a couple of months prior to the historic stock market crash that took the Dow Jones Industrial Average down -22.6% in a single day. He has published daily fact-based fundamental and technical analysis on high-ranked stocks online for two decades. Through FACTBASEDINVESTING.COM, Kenneth provides educational articles, news, market commentary, and other information regarding proven investment systems that work in good times and bad.
Comments contained in the body of this report are technical opinions only and are not necessarily those of Gruneisen Growth Corp. The material herein has been obtained from sources believed to be reliable and accurate, however, its accuracy and completeness cannot be guaranteed. Our firm, employees, and customers may effect transactions, including transactions contrary to any recommendation herein, or have positions in the securities mentioned herein or options with respect thereto. Any recommendation contained in this report may not be suitable for all investors and it is not to be deemed an offer or solicitation on our part with respect to the purchase or sale of any securities. |
|
 |
Commodity-Linked Groups Weakest Amid Broad Declines
Kenneth J. Gruneisen - Passed the CAN SLIM® Master's Exam
The Gold & Silver Index ($XAU -5.42%) was a standout decliner among the groups regularly followed in this commentary, suffering yet another big loss. The Semiconductor Index ($SOX -3.29%) led the tech sector lower while the Networking Index ($NWX -2.92%), Internet Index ($IIX -1.53%), and Biotechnology Index ($BTK -0.95%) finished with unanimous losses. Energy-related shares were also very weak as the Oil Services Index ($OSX -3.19%) and the Integrated Oil Index ($XOI -2.14%) fell. The Healthcare Index ($HMO -2.03%) suffered a setback, meanwhile, the Retail Index ($RLX -0.79%) did a better job of holding its ground. The financial sector also declined as the Bank Index ($BKX -2.01%) and Broker/Dealer Index ($XBD -1.63%) rounded out Wednesday's solidly negative session.
Charts courtesy www.stockcharts.com
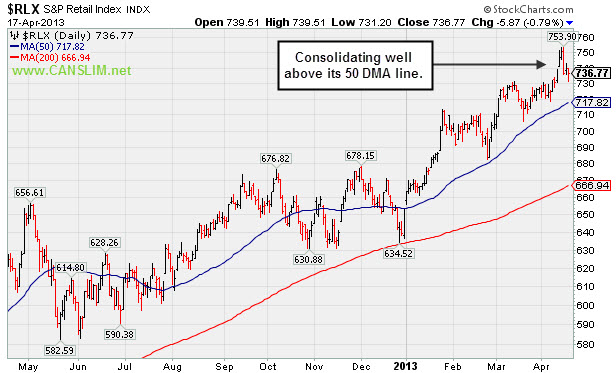
PICTURED: The Retail Index ($RLX -0.79%) is consolidating well above its 50-day moving average (DMA) line, in technically strong shape.
| Oil Services |
$OSX |
234.60 |
-7.73 |
-3.19% |
+6.56% |
| Healthcare |
$HMO |
2,902.34 |
-60.11 |
-2.03% |
+15.44% |
| Integrated Oil |
$XOI |
1,275.08 |
-27.82 |
-2.14% |
+2.68% |
| Semiconductor |
$SOX |
417.65 |
-14.20 |
-3.29% |
+8.75% |
| Networking |
$NWX |
219.86 |
-6.61 |
-2.92% |
-2.95% |
| Internet |
$IIX |
354.27 |
-5.52 |
-1.53% |
+8.34% |
| Broker/Dealer |
$XBD |
108.63 |
-1.80 |
-1.63% |
+15.16% |
| Retail |
$RLX |
736.77 |
-5.87 |
-0.79% |
+12.82% |
| Gold & Silver |
$XAU |
98.85 |
-5.67 |
-5.42% |
-40.31% |
| Bank |
$BKX |
54.52 |
-1.12 |
-2.01% |
+6.32% |
| Biotech |
$BTK |
1,837.21 |
-17.61 |
-0.95% |
+18.76% |
|
|
|
 |
Encountering Distributional Pressure in Recent Weeks
Kenneth J. Gruneisen - Passed the CAN SLIM® Master's Exam
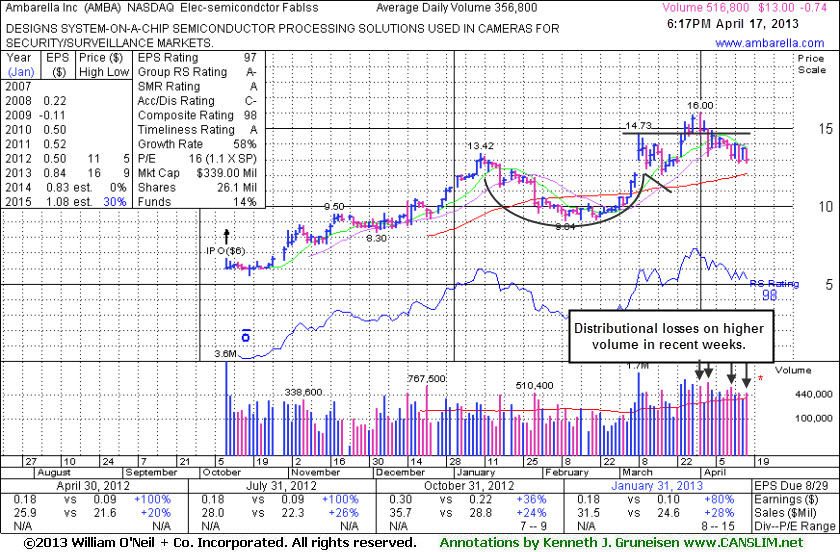
Ambarella Corporation (AMBA -$0.74 or -5.39% to $13.00) has been encountering distributional pressure in recent weeks and it is slumping toward near-term support at its 50-day moving average (DMA) line. Disciplined investors always limit losses by selling if any stock falls more than -7% from their purchase price. It was last shown in this FSU section with an annotated graph on 3/26/13 under the headline, "Volume-Driven Gain From Cup-With-High-Handle to New 52-Week High", while rallying for considerable gains with heavy volume from a cup-with-high-handle base, triggering a technical buy signal.
The high-ranked Electronics - Semiconductor firm reported earnings +80% on +28% sales revenues for the Jan '13 quarter. Its strong quarterly earnings comparisons versus the year ago periods satisfy the C criteria with increases above the +25% minimum guideline. It also has a good annual earnings (A criteria), however it has a limited history since its IPO at $6 on 10/10/12. The number of top-rated funds owning its shares rose from 51 in Dec '12 to 68 in Mar '13, a reassuring indication concerning the I criteria. Its current Up/Down Volume Ratio of 1.3 is also an unbiased indication that its shares have been under accumulation over the past 50 days. Its small supply (S criteria) of only 13.3 million shares in the public float can contribute to great price volatility in the event of institutional buying or selling.
|
|
|
Color Codes Explained :
Y - Better candidates highlighted by our
staff of experts.
G - Previously featured
in past reports as yellow but may no longer be buyable under the
guidelines.
***Last / Change / Volume data in this table is the closing quote data***
Symbol/Exchange
Company Name
Industry Group |
PRICE |
CHANGE
(%Change) |
Day High |
Volume
(% DAV)
(% 50 day avg vol) |
52 Wk Hi
% From Hi |
Featured
Date |
Price
Featured |
Pivot Featured |
|
Max Buy |
AMBA
-
NASDAQ
Ambarella Inc
ELECTRONICS - Semiconductor - Specialized
|
$13.00
|
-0.74
-5.39% |
$13.70
|
516,863
144.86% of 50 DAV
50 DAV is 356,800
|
$16.00
-18.75%
|
3/26/2013
|
$15.31
|
PP = $14.83
|
|
MB = $15.57
|
 Most Recent Note - 4/17/2013 6:40:58 PM
Y - Slumping toward near-term support at its 50 DMA line. Disciplined investors always limit losses by selling if any stock falls more than -7% from their purchase price. See latest FSU analysis for more details and a new annotated graph.
>>> The latest Featured Stock Update with an annotated graph appeared on 4/17/2013. Click here.
View all notes |
Alert me of new notes |
CANSLIM.net Company Profile |
SEC |
Zacks Reports |
StockTalk |
News |
Chart |
Request a new note
C
A N
S L
I M


|
CELG
-
NASDAQ
Celgene Corp
DRUGS - Drug Manufacturers - Major
|
$121.34
|
-1.16
-0.95% |
$122.57
|
3,012,389
97.17% of 50 DAV
50 DAV is 3,100,000
|
$124.10
-2.22%
|
3/27/2013
|
$113.24
|
PP = $115.54
|
|
MB = $121.32
|
Most Recent Note - 4/12/2013 3:09:14 PM
G - Color code is changed to green as it is now extended from any sound base pattern after wedging to new highs from an advanced "3-weeks tight" base with only average volume behind its gains
>>> The latest Featured Stock Update with an annotated graph appeared on 3/28/2013. Click here.
View all notes |
Alert me of new notes |
CANSLIM.net Company Profile |
SEC |
Zacks Reports |
StockTalk |
News |
Chart |
Request a new note
C
A N
S L
I M
|
CFNL
-
NASDAQ
Cardinal Financial Corp
BANKING - Regional - Southeast Banks
|
$16.37
|
-0.16
-0.97% |
$16.59
|
179,816
87.46% of 50 DAV
50 DAV is 205,600
|
$18.40
-11.03%
|
3/22/2013
|
$17.99
|
PP = $18.29
|
|
MB = $19.20
|
Most Recent Note - 4/15/2013 8:03:11 PM
G - Color code is changed to green after today's 50 DMA line violation with a loss on above average volume triggered a technical sell signal
>>> The latest Featured Stock Update with an annotated graph appeared on 4/10/2013. Click here.
View all notes |
Alert me of new notes |
CANSLIM.net Company Profile |
SEC |
Zacks Reports |
StockTalk |
News |
Chart |
Request a new note
C
A N
S L
I M
|
CMCSA
-
NASDAQ
Comcast Corp Cl A
MEDIA - CATV Systems
|
$40.62
|
-0.80
-1.92% |
$41.28
|
18,027,762
127.12% of 50 DAV
50 DAV is 14,181,500
|
$42.61
-4.68%
|
12/3/2012
|
$37.08
|
PP = $38.06
|
|
MB = $39.96
|
Most Recent Note - 4/16/2013 6:41:09 PM
G - Hovering near its 52-week high after finding recent support and rallying from its 50 DMA line. See the latest FSU analysis for more details and a new annotated graph.
>>> The latest Featured Stock Update with an annotated graph appeared on 4/16/2013. Click here.
View all notes |
Alert me of new notes |
CANSLIM.net Company Profile |
SEC |
Zacks Reports |
StockTalk |
News |
Chart |
Request a new note
C
A N
S L
I M
|
EVER
-
NYSE
Everbank Financial Corp
BANKING
|
$14.28
|
-0.27
-1.86% |
$14.72
|
649,527
69.45% of 50 DAV
50 DAV is 935,300
|
$17.29
-17.41%
|
3/4/2013
|
$15.38
|
PP = $15.83
|
|
MB = $16.62
|
Most Recent Note - 4/12/2013 3:14:16 PM
G - Still holding its ground near its 50 DMA line ($15.15 now). That important short-term average has acted as support since damaging losses violated prior highs in the $16 area raising concerns while completely negating its prior technical breakout. Its Relative Strength (RS) rating has slumped to 70, below the 80+ minimum guideline for buy candidates.
>>> The latest Featured Stock Update with an annotated graph appeared on 4/2/2013. Click here.
View all notes |
Alert me of new notes |
CANSLIM.net Company Profile |
SEC |
Zacks Reports |
StockTalk |
News |
Chart |
Request a new note
C
A N
S L
I M
|
Symbol/Exchange
Company Name
Industry Group |
PRICE |
CHANGE
(%Change) |
Day High |
Volume
(% DAV)
(% 50 day avg vol) |
52 Wk Hi
% From Hi |
Featured
Date |
Price
Featured |
Pivot Featured |
|
Max Buy |
FLT
-
NYSE
Fleetcor Technologies
DIVERSIFIED SERVICES - Business/Management Services
|
$74.10
|
-0.95
-1.27% |
$74.89
|
636,360
76.14% of 50 DAV
50 DAV is 835,800
|
$78.87
-6.05%
|
3/21/2013
|
$71.14
|
PP = $73.00
|
|
MB = $76.65
|
Most Recent Note - 4/15/2013 7:56:38 PM
Y - Enduring mild distributional pressure above prior highs in the $72 area defining near-term support above its 50 DMA line. See the latest FSU analysis for more details and a new annotated graph.
>>> The latest Featured Stock Update with an annotated graph appeared on 4/15/2013. Click here.
View all notes |
Alert me of new notes |
CANSLIM.net Company Profile |
SEC |
Zacks Reports |
StockTalk |
News |
Chart |
Request a new note
C
A N
S L
I M
|
LNKD
-
NYSE
Linkedin Corp Class A
INTERNET - Internet Information Providers
|
$179.97
|
-2.50
-1.37% |
$183.48
|
2,168,378
85.51% of 50 DAV
50 DAV is 2,535,700
|
$186.06
-3.27%
|
4/12/2013
|
$182.69
|
PP = $184.25
|
|
MB = $193.46
|
Most Recent Note - 4/16/2013 6:43:53 PM
Y - Traded up today with lighter volume. Color code was changed to yellow with a new pivot point cited based on its 3/14/18 high plus 10 cents while forming a short 5-week flat base pattern. Volume-driven gains above the pivot point may trigger a new (or add-on) technical buy signal. Its 50 DMA line and recent low define important near-term chart support to watch.
>>> The latest Featured Stock Update with an annotated graph appeared on 4/5/2013. Click here.
View all notes |
Alert me of new notes |
CANSLIM.net Company Profile |
SEC |
Zacks Reports |
StockTalk |
News |
Chart |
Request a new note
C
A N
S L
I M
|
MIDD
-
NASDAQ
Middleby Corp
MANUFACTURING - Diversified Machinery
|
$143.02
|
-2.59
-1.78% |
$146.25
|
115,174
128.69% of 50 DAV
50 DAV is 89,500
|
$154.74
-7.57%
|
10/8/2012
|
$118.46
|
PP = $122.67
|
|
MB = $128.80
|
Most Recent Note - 4/17/2013 12:14:36 PM
G - Its Relative Strength rating is 85 today, but the longer a stock lingers below its 50 DMA line the worse its outlook gets. Its also slumped under recent lows in the $144 area raising greater concerns. Fundamental concerns were recently noted.
>>> The latest Featured Stock Update with an annotated graph appeared on 3/25/2013. Click here.
View all notes |
Alert me of new notes |
CANSLIM.net Company Profile |
SEC |
Zacks Reports |
StockTalk |
News |
Chart |
Request a new note
C
A N
S L
I M
|
MNTX
-
NASDAQ
Manitex International
MANUFACTURING - Diversified Machinery
|
$10.29
|
-0.46
-4.28% |
$10.74
|
80,757
39.72% of 50 DAV
50 DAV is 203,300
|
$13.14
-21.69%
|
3/20/2013
|
$11.29
|
PP = $12.05
|
|
MB = $12.65
|
Most Recent Note - 4/17/2013 6:42:01 PM
G - Slumped further below its 50 DMA line today on lighter volume. A rally above that important short-term average is needed for its outlook to improve.
>>> The latest Featured Stock Update with an annotated graph appeared on 4/12/2013. Click here.
View all notes |
Alert me of new notes |
CANSLIM.net Company Profile |
SEC |
Zacks Reports |
StockTalk |
News |
Chart |
Request a new note
C
A N
S L
I M
|
MRLN
-
NASDAQ
Marlin Business Services
DIVERSIFIED SERVICES - Rental and Leasing Services
|
$20.63
|
-0.95
-4.40% |
$21.78
|
30,380
119.61% of 50 DAV
50 DAV is 25,400
|
$23.98
-13.97%
|
3/15/2013
|
$22.29
|
PP = $23.18
|
|
MB = $24.34
|
Most Recent Note - 4/17/2013 11:43:28 AM
G - Slumping further below its 50 DMA line today. Only a prompt rebound above that important short-term average would help its outlook improve.
>>> The latest Featured Stock Update with an annotated graph appeared on 4/9/2013. Click here.
View all notes |
Alert me of new notes |
CANSLIM.net Company Profile |
SEC |
Zacks Reports |
StockTalk |
News |
Chart |
Request a new note
C
A N
S L
I M
|
Symbol/Exchange
Company Name
Industry Group |
PRICE |
CHANGE
(%Change) |
Day High |
Volume
(% DAV)
(% 50 day avg vol) |
52 Wk Hi
% From Hi |
Featured
Date |
Price
Featured |
Pivot Featured |
|
Max Buy |
MWIV
-
NASDAQ
M W I Veterinary Supply
HEALTH SERVICES - Medical Instruments and; Supplies
|
$122.23
|
-2.83
-2.26% |
$124.80
|
41,440
69.18% of 50 DAV
50 DAV is 59,900
|
$137.18
-10.90%
|
3/4/2013
|
$130.90
|
PP = $129.45
|
|
MB = $135.92
|
Most Recent Note - 4/15/2013 8:01:13 PM
G - Color code is changed to green after today's loss violated its 50 DMA line triggering a technical sell signal. Only a prompt rebound above that important short-term average would help its outlook improve.
>>> The latest Featured Stock Update with an annotated graph appeared on 4/4/2013. Click here.
View all notes |
Alert me of new notes |
CANSLIM.net Company Profile |
SEC |
Zacks Reports |
StockTalk |
News |
Chart |
Request a new note
C
A N
S L
I M
|
N
-
NYSE
Netsuite Inc
DIVERSIFIED SERVICES - Business/Management Services
|
$78.90
|
-0.36
-0.45% |
$79.19
|
283,577
79.06% of 50 DAV
50 DAV is 358,700
|
$80.33
-1.78%
|
12/12/2012
|
$64.75
|
PP = $67.12
|
|
MB = $70.48
|
Most Recent Note - 4/16/2013 6:47:10 PM
G - Hovering near its all-time high, extended after a recent streak of 7 consecutive weekly gains. Its 50 DMA line ($73.58 now) defines important near-term support to watch.
>>> The latest Featured Stock Update with an annotated graph appeared on 4/1/2013. Click here.
View all notes |
Alert me of new notes |
CANSLIM.net Company Profile |
SEC |
Zacks Reports |
StockTalk |
News |
Chart |
Request a new note
C
A N
S L
I M
|
PRLB
-
NYSE
Proto Labs Inc
MANUFACTURING - Small Tools and Accessories
|
$47.01
|
-1.17
-2.43% |
$47.89
|
888,841
158.89% of 50 DAV
50 DAV is 559,400
|
$55.23
-14.88%
|
4/10/2013
|
$49.97
|
PP = $54.01
|
|
MB = $56.71
|
Most Recent Note - 4/17/2013 11:45:49 AM
G - Slumping below its 50 DMA line today and its color code is changed to green. The latest FSU analysis includes more details and an annotated graph under the headline, "Encountered Distributional Pressure After Trading Above Pivot Point"
>>> The latest Featured Stock Update with an annotated graph appeared on 4/11/2013. Click here.
View all notes |
Alert me of new notes |
CANSLIM.net Company Profile |
SEC |
Zacks Reports |
StockTalk |
News |
Chart |
Request a new note
C
A N
S L
I M
|
RRTS
-
NYSE
Roadrunner Trans Systems
TRANSPORTATION - Air Delivery and Freight Service
|
$21.88
|
-1.17
-5.08% |
$22.96
|
182,969
91.81% of 50 DAV
50 DAV is 199,300
|
$23.88
-8.38%
|
4/3/2013
|
$22.77
|
PP = $23.75
|
|
MB = $24.94
|
Most Recent Note - 4/17/2013 11:39:46 AM
G - Color code is changed to green after violating the recent low and its 50 DMA line triggering technical sell signals. Only a prompt rebound above that important short-term average would help its outlook improve.
>>> The latest Featured Stock Update with an annotated graph appeared on 4/3/2013. Click here.
View all notes |
Alert me of new notes |
CANSLIM.net Company Profile |
SEC |
Zacks Reports |
StockTalk |
News |
Chart |
Request a new note
C
A N
S L
I M
|
VRX
-
NYSE
Valeant Pharmaceuticals
DRUGS - Drug Manufacturers - Other
|
$72.86
|
-0.23
-0.31% |
$72.95
|
879,951
65.16% of 50 DAV
50 DAV is 1,350,500
|
$76.56
-4.83%
|
12/20/2012
|
$60.24
|
PP = $61.21
|
|
MB = $64.27
|
Most Recent Note - 4/15/2013 11:47:27 AM
G - Still consolidating above its 50 DMA line ($69.84 now) defining important near-term support.
>>> The latest Featured Stock Update with an annotated graph appeared on 4/8/2013. Click here.
View all notes |
Alert me of new notes |
CANSLIM.net Company Profile |
SEC |
Zacks Reports |
StockTalk |
News |
Chart |
Request a new note
C
A N
S L
I M
|
Symbol/Exchange
Company Name
Industry Group |
PRICE |
CHANGE
(%Change) |
Day High |
Volume
(% DAV)
(% 50 day avg vol) |
52 Wk Hi
% From Hi |
Featured
Date |
Price
Featured |
Pivot Featured |
|
Max Buy |
|
|
|
THESE ARE NOT BUY RECOMMENDATIONS!
Comments contained in the body of this report are technical
opinions only. The material herein has been obtained
from sources believed to be reliable and accurate, however,
its accuracy and completeness cannot be guaranteed.
This site is not an investment advisor, hence it does
not endorse or recommend any securities or other investments.
Any recommendation contained in this report may not
be suitable for all investors and it is not to be deemed
an offer or solicitation on our part with respect to
the purchase or sale of any securities. All trademarks,
service marks and trade names appearing in this report
are the property of their respective owners, and are
likewise used for identification purposes only.
This report is a service available
only to active Paid Premium Members.
You may opt-out of receiving report notifications
at any time. Questions or comments may be submitted
by writing to Premium Membership Services 665 S.E. 10 Street, Suite 201 Deerfield Beach, FL 33441-5634 or by calling 1-800-965-8307
or 954-785-1121.
|
|
|

