***Last / Change / Volume data in this table is the closing quote data***
Symbol/Exchange
Company Name
Industry Group |
PRICE |
CHANGE
(%Change) |
Day High |
Volume
(% DAV)
(% 50 day avg vol) |
52 Wk Hi
% From Hi |
Featured
Date |
Price
Featured |
Pivot Featured |
|
Max Buy |
ACN
-
NYSE
Accenture Plc
DIVERSIFIED SERVICES - Business/Management Services
|
$61.88
|
-0.67
-1.07% |
$62.86
|
4,144,923
129.78% of 50 DAV
50 DAV is 3,193,800
|
$65.89
-6.09%
|
3/23/2012
|
$64.13
|
PP = $63.76
|
|
MB = $66.95
|
Most Recent Note - 4/13/2012 12:03:02 PM
Y - Gapped down today, and it has been sputtering since triggering a technical buy signal on 3/23/12 with a volume-driven gain. Prior highs in the $62-63 area define initial support to watch above its 50 DMA line.
>>> The latest Featured Stock Update with an annotated graph appeared on 3/23/2012. Click here.
View all notes |
Alert me of new notes |
CANSLIM.net Company Profile |
SEC |
Zacks Reports |
StockTalk |
News |
Chart |
Request a new note
C
A N
S L
I M


|
ADS
-
NYSE
Alliance Data Sys Corp
COMPUTER SOFTWARE and SERVICES - Information and Delivery Service
|
$125.55
|
+1.23
0.99% |
$126.81
|
709,793
112.08% of 50 DAV
50 DAV is 633,300
|
$127.71
-1.69%
|
1/17/2012
|
$108.24
|
PP = $107.43
|
|
MB = $112.80
|
 Most Recent Note - 4/16/2012 2:59:19 PM
G - Rallying near its all-time high today after a brief consolidation above its 50 DMA line. Fundamental concerns were raised by earnings reported +9%, well below the +25% minimum guideline, for the latest quarter ended December 31, 2011 versus the year-ago period.
>>> The latest Featured Stock Update with an annotated graph appeared on 2/29/2012. Click here.
View all notes |
Alert me of new notes |
CANSLIM.net Company Profile |
SEC |
Zacks Reports |
StockTalk |
News |
Chart |
Request a new note
C
A N
S L
I M
|
ALLT
-
NASDAQ
Allot Communications Ltd
COMPUTER SOFTWARE andamp; SERVICES - Technical andamp; System Software
|
$23.71
|
-0.02
-0.08% |
$24.47
|
148,277
30.90% of 50 DAV
50 DAV is 479,900
|
$24.96
-5.01%
|
3/13/2012
|
$19.72
|
PP = $18.91
|
|
MB = $19.86
|
Most Recent Note - 4/11/2012 12:35:13 PM
G - Up today, and perched near its 52-week high, extended from its prior base. Prior highs near $18-19 define initial support to watch on pullbacks.
>>> The latest Featured Stock Update with an annotated graph appeared on 3/19/2012. Click here.
View all notes |
Alert me of new notes |
CANSLIM.net Company Profile |
SEC |
Zacks Reports |
StockTalk |
News |
Chart |
Request a new note
C
A N
S L
I M
|
ALXN
-
NASDAQ
Alexion Pharmaceuticals
DRUGS - Drug Manufacturers - Other
|
$88.67
|
-0.35
-0.39% |
$89.60
|
1,257,798
97.37% of 50 DAV
50 DAV is 1,291,800
|
$95.01
-6.67%
|
3/12/2012
|
$87.87
|
PP = $87.73
|
|
MB = $92.12
|
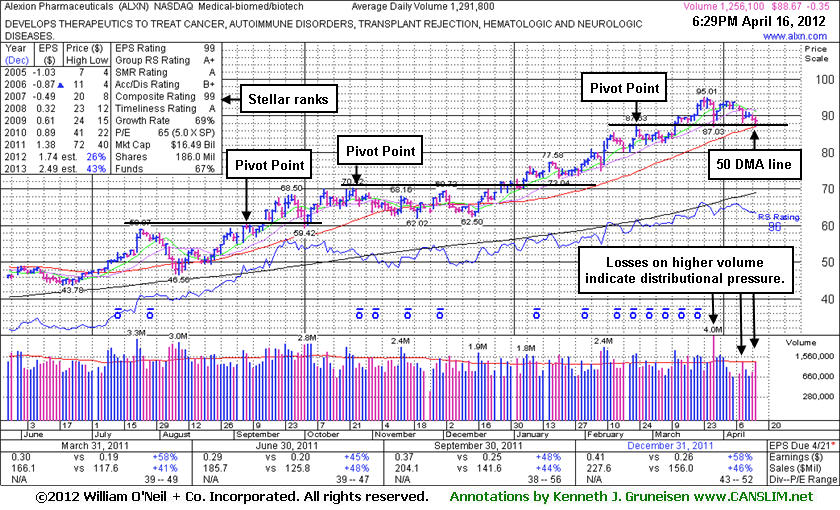
Most Recent Note - 4/16/2012 7:02:56 PM
G - Testing support at its 50 DMA line today, which nearly coincides with its latest pivot point cited, after encountering recent distributional pressure. See the latest FSU analysis for more details and a new annotated graph.
>>> The latest Featured Stock Update with an annotated graph appeared on 4/16/2012. Click here.
View all notes |
Alert me of new notes |
CANSLIM.net Company Profile |
SEC |
Zacks Reports |
StockTalk |
News |
Chart |
Request a new note
C
A N
S L
I M
|
BODY
-
NASDAQ
Body Central Corp
RETAIL - Catalog andamp; Mail Order Houses
|
$27.65
|
+0.01
0.04% |
$27.89
|
104,822
50.42% of 50 DAV
50 DAV is 207,900
|
$29.49
-6.24%
|
1/27/2012
|
$26.69
|
PP = $25.46
|
|
MB = $26.73
|
Most Recent Note - 4/11/2012 4:58:11 PM
G - Promptly rebounded and closed near its 50 DMA line today, an encouraging sign that it was finding support near that important short-term average. Subsequent damaging losses below its recent lows would raise more serious concerns and trigger additional sell signals.
>>> The latest Featured Stock Update with an annotated graph appeared on 3/13/2012. Click here.
View all notes |
Alert me of new notes |
CANSLIM.net Company Profile |
SEC |
Zacks Reports |
StockTalk |
News |
Chart |
Request a new note
C
A N
S L
I M
|
Symbol/Exchange
Company Name
Industry Group |
PRICE |
CHANGE
(%Change) |
Day High |
Volume
(% DAV)
(% 50 day avg vol) |
52 Wk Hi
% From Hi |
Featured
Date |
Price
Featured |
Pivot Featured |
|
Max Buy |
CDNS
-
NASDAQ
Cadence Design Systems
COMPUTER SOFTWARE and SERVICES - Technical and System Software
|
$11.49
|
-0.02
-0.17% |
$11.74
|
2,152,613
67.31% of 50 DAV
50 DAV is 3,198,100
|
$12.60
-8.81%
|
2/3/2012
|
$11.66
|
PP = $11.15
|
|
MB = $11.71
|
Most Recent Note - 4/16/2012 5:57:53 PM
G - Only -8.8% off its 52-week high after today's small loss on light volume, but the longer it lingers below its 50 DMA line the worse its outlook gets. Last week's low ($11.20 on 4/10/12) defines the only near-term support level above its 200 DMA line.
>>> The latest Featured Stock Update with an annotated graph appeared on 3/28/2012. Click here.
View all notes |
Alert me of new notes |
CANSLIM.net Company Profile |
SEC |
Zacks Reports |
StockTalk |
News |
Chart |
Request a new note
C
A N
S L
I M
|
CELG
-
NASDAQ
Celgene Corp
DRUGS - Drug Manufacturers - Major
|
$78.16
|
-0.16
-0.20% |
$79.11
|
1,943,172
71.68% of 50 DAV
50 DAV is 2,710,900
|
$80.42
-2.81%
|
2/2/2012
|
$74.16
|
PP = $75.21
|
|
MB = $78.97
|
Most Recent Note - 4/11/2012 12:27:37 PM
G - Stubbornly holding its ground after rallying above its "max buy" level. Its 50 DMA line defines support to watch.
>>> The latest Featured Stock Update with an annotated graph appeared on 3/26/2012. Click here.
View all notes |
Alert me of new notes |
CANSLIM.net Company Profile |
SEC |
Zacks Reports |
StockTalk |
News |
Chart |
Request a new note
C
A N
S L
I M
|
COO
-
NYSE
Cooper Companies Inc
HEALTH SERVICES - Medical Instruments and Supplies
|
$82.54
|
-0.43
-0.52% |
$83.71
|
277,017
65.78% of 50 DAV
50 DAV is 421,100
|
$84.20
-1.97%
|
3/9/2012
|
$83.05
|
PP = $81.02
|
|
MB = $85.07
|
Most Recent Note - 4/12/2012 4:27:18 PM
Y - Up today on slightly higher volume, challenging its 52-week high and rising above its pivot point with no resistance remaining. While trading sideways in recent weeks its Relative Strength rating slumped, and now at a mediocre 77, that rating is below the 80+ guideline for buy candidates.
>>> The latest Featured Stock Update with an annotated graph appeared on 3/9/2012. Click here.
View all notes |
Alert me of new notes |
CANSLIM.net Company Profile |
SEC |
Zacks Reports |
StockTalk |
News |
Chart |
Request a new note
C
A N
S L
I M
|
DISH
-
NASDAQ
Dish Network Corp Cl A
CONSUMER DURABLES - Electronic Equipment
|
$31.44
|
-0.25
-0.79% |
$31.86
|
1,420,544
57.34% of 50 DAV
50 DAV is 2,477,400
|
$35.64
-11.78%
|
3/7/2012
|
$30.83
|
PP = $30.10
|
|
MB = $31.61
|
Most Recent Note - 4/10/2012 6:14:18 PM
Y - Down today on below average volume. Color code is changed to yellow while consolidating under its "max buy" level and above prior highs in the $30 area defining initial support to watch on pullbacks.
>>> The latest Featured Stock Update with an annotated graph appeared on 3/14/2012. Click here.
View all notes |
Alert me of new notes |
CANSLIM.net Company Profile |
SEC |
Zacks Reports |
StockTalk |
News |
Chart |
Request a new note
C
A N
S L
I M
|
FEIC
-
NASDAQ
F E I Co
ELECTRONICS - Diversified Electronics
|
$47.18
|
+0.06
0.13% |
$47.61
|
276,651
87.60% of 50 DAV
50 DAV is 315,800
|
$49.92
-5.49%
|
12/7/2011
|
$41.41
|
PP = $42.35
|
|
MB = $44.47
|
Most Recent Note - 4/13/2012 4:22:09 PM
G - Consolidating above its 50 DMA line, down today with higher (but below average) volume. The latest quarterly report showed +21% earnings for the Dec '11 quarter, below the +25% minimum guideline for earnings growth.
>>> The latest Featured Stock Update with an annotated graph appeared on 3/12/2012. Click here.
View all notes |
Alert me of new notes |
CANSLIM.net Company Profile |
SEC |
Zacks Reports |
StockTalk |
News |
Chart |
Request a new note
C
A N
S L
I M
|
Symbol/Exchange
Company Name
Industry Group |
PRICE |
CHANGE
(%Change) |
Day High |
Volume
(% DAV)
(% 50 day avg vol) |
52 Wk Hi
% From Hi |
Featured
Date |
Price
Featured |
Pivot Featured |
|
Max Buy |
GNC
-
NYSE
G N C Holdings Inc
RETAIL - Drug Stores
|
$33.45
|
-0.47
-1.39% |
$34.34
|
1,194,913
76.14% of 50 DAV
50 DAV is 1,569,400
|
$36.10
-7.34%
|
1/19/2012
|
$28.99
|
PP = $29.60
|
|
MB = $31.08
|
Most Recent Note - 4/13/2012 4:23:46 PM
G - Extended from its prior base and consolidating above its 50 DMA line, important support to watch on pullbacks. It completed Secondary Offerings on 10/25/11 and 3/13/12 after making steady progress following its 4/01/11 IPO.
>>> The latest Featured Stock Update with an annotated graph appeared on 3/5/2012. Click here.
View all notes |
Alert me of new notes |
CANSLIM.net Company Profile |
SEC |
Zacks Reports |
StockTalk |
News |
Chart |
Request a new note
C
A N
S L
I M
|
HLF
-
NYSE
Herbalife Ltd
DRUGS - Nutrition and Weight Management
|
$68.26
|
-0.66
-0.96% |
$69.16
|
1,163,478
85.91% of 50 DAV
50 DAV is 1,354,300
|
$72.11
-5.34%
|
2/22/2012
|
$65.90
|
PP = $63.50
|
|
MB = $66.68
|
Most Recent Note - 4/13/2012 7:43:39 PM
G - Hovering only -4.4% off its all-time high today. Its 50 DMA line defines important support to watch on pullbacks. Color code remains green, however a secondary buy point is discussed in the latest FSU analysis with an annotated weekly graph.
>>> The latest Featured Stock Update with an annotated graph appeared on 4/13/2012. Click here.
View all notes |
Alert me of new notes |
CANSLIM.net Company Profile |
SEC |
Zacks Reports |
StockTalk |
News |
Chart |
Request a new note
C
A N
S L
I M
|
ISRG
-
NASDAQ
Intuitive Surgical Inc
HEALTH SERVICES - Medical Appliances and Equipment
|
$541.09
|
-5.47
-1.00% |
$551.99
|
324,497
115.19% of 50 DAV
50 DAV is 281,700
|
$554.13
-2.35%
|
12/20/2011
|
$442.43
|
PP = $449.16
|
|
MB = $471.62
|
Most Recent Note - 4/11/2012 12:33:30 PM
G - Enduring mild distributional pressure but holding its ground following 8 consecutive weekly gains. Extended from any sound base pattern. Previously noted - "The December '11 quarterly earnings increased by just below the borderline +25% minimum guideline for ideal buy candidates."
>>> The latest Featured Stock Update with an annotated graph appeared on 3/1/2012. Click here.
View all notes |
Alert me of new notes |
CANSLIM.net Company Profile |
SEC |
Zacks Reports |
StockTalk |
News |
Chart |
Request a new note
C
A N
S L
I M
|
LULU
-
NASDAQ
Lululemon Athletica
MANUFACTURING - Textile Manufacturing
|
$73.40
|
-0.11
-0.15% |
$75.25
|
2,224,979
113.73% of 50 DAV
50 DAV is 1,956,400
|
$77.13
-4.84%
|
1/10/2012
|
$60.97
|
PP = $59.46
|
|
MB = $62.43
|
Most Recent Note - 4/16/2012 12:16:07 PM
G - Holding its ground since a damaging loss on 4/10/12 violated a previously noted upward trendline connecting January-March lows. Its 50 DMA line defines the next important support level to watch. See the latest FSU analysis for more details and an annotated graph.
>>> The latest Featured Stock Update with an annotated graph appeared on 4/12/2012. Click here.
View all notes |
Alert me of new notes |
CANSLIM.net Company Profile |
SEC |
Zacks Reports |
StockTalk |
News |
Chart |
Request a new note
C
A N
S L
I M
|
MA
-
NYSE
Mastercard Inc Cl A
DIVERSIFIED SERVICES - Business/Management Services
|
$432.66
|
-7.80
-1.77% |
$441.47
|
768,609
82.89% of 50 DAV
50 DAV is 927,300
|
$443.80
-2.51%
|
3/12/2012
|
$419.86
|
PP = $428.67
|
|
MB = $450.10
|
Most Recent Note - 4/16/2012 5:48:34 PM
Y - Pulled back with lighter volume today following a prior gain on near average volume, not a fresh sign of institutional buying demand. Its 50 DMA line defines near-term support to watch.
>>> The latest Featured Stock Update with an annotated graph appeared on 4/11/2012. Click here.
View all notes |
Alert me of new notes |
CANSLIM.net Company Profile |
SEC |
Zacks Reports |
StockTalk |
News |
Chart |
Request a new note
C
A N
S L
I M
|
Symbol/Exchange
Company Name
Industry Group |
PRICE |
CHANGE
(%Change) |
Day High |
Volume
(% DAV)
(% 50 day avg vol) |
52 Wk Hi
% From Hi |
Featured
Date |
Price
Featured |
Pivot Featured |
|
Max Buy |
MELI
-
NASDAQ
Mercadolibre Inc
INTERNET - Internet Software and; Services
|
$91.97
|
-4.63
-4.79% |
$97.07
|
437,474
88.81% of 50 DAV
50 DAV is 492,600
|
$104.50
-11.99%
|
2/6/2012
|
$97.09
|
PP = $95.58
|
|
MB = $100.36
|
Most Recent Note - 4/16/2012 1:48:05 PM
G - Color code is changed to green while slumping below its 50 DMA line toward the recent low ($91.38 on 3/06/12) that defines the next important support area to watch.
>>> The latest Featured Stock Update with an annotated graph appeared on 3/29/2012. Click here.
View all notes |
Alert me of new notes |
CANSLIM.net Company Profile |
SEC |
Zacks Reports |
StockTalk |
News |
Chart |
Request a new note
C
A N
S L
I M
|
MG
-
NYSE
Mistras Group Inc
DIVERSIFIED SERVICES - Bulding and Faci;ity Management Services
|
$23.34
|
-0.17
-0.72% |
$23.65
|
66,403
58.87% of 50 DAV
50 DAV is 112,800
|
$26.24
-11.05%
|
3/22/2012
|
$24.96
|
PP = $26.34
|
|
MB = $27.66
|
Most Recent Note - 4/11/2012 12:28:59 PM
G - Finding support near its 50 DMA line. Color code was changed to green, meanwhile gains above its recent chart highs are needed to help its technical stance improve. It has remained below the new pivot point cited in the 3/22/12 mid-day report based on its 52-week high plus 10 cents, not triggering a technical buy signal.
>>> The latest Featured Stock Update with an annotated graph appeared on 4/2/2012. Click here.
View all notes |
Alert me of new notes |
CANSLIM.net Company Profile |
SEC |
Zacks Reports |
StockTalk |
News |
Chart |
Request a new note
C
A N
S L
I M
|
MKTX
-
NASDAQ
Marketaxess Holdings Inc
FINANCIAL SERVICES - Investment Brokerage - Nationa
|
$36.77
|
+1.06
2.97% |
$37.26
|
295,884
94.74% of 50 DAV
50 DAV is 312,300
|
$37.95
-3.11%
|
3/8/2012
|
$35.80
|
PP = $35.52
|
|
MB = $37.30
|
Most Recent Note - 4/16/2012 1:59:56 PM
Y - Gapped up today, rallying within close striking distance of its best-ever close. Color code is changed to yellow based on its impressive resilience after finding prompt support. Rebounded above its 50 DMA line after an intra-day violation on 4/12/12 and loss with heavy volume raised concerns.
>>> The latest Featured Stock Update with an annotated graph appeared on 3/8/2012. Click here.
View all notes |
Alert me of new notes |
CANSLIM.net Company Profile |
SEC |
Zacks Reports |
StockTalk |
News |
Chart |
Request a new note
C
A N
S L
I M
|
NTES
-
NASDAQ
Netease Inc Adr
INTERNET - Internet Information Providers
|
$55.95
|
-1.03
-1.81% |
$57.38
|
399,821
58.37% of 50 DAV
50 DAV is 685,000
|
$60.47
-7.47%
|
3/19/2012
|
$56.18
|
PP = $55.10
|
|
MB = $57.86
|
Most Recent Note - 4/16/2012 5:51:35 PM
Y - Down today on light volume, slumping near last week's low and near its old highs in the $55 area defining chart support to watch. More damaging losses may raise greater concerns.
>>> The latest Featured Stock Update with an annotated graph appeared on 3/27/2012. Click here.
View all notes |
Alert me of new notes |
CANSLIM.net Company Profile |
SEC |
Zacks Reports |
StockTalk |
News |
Chart |
Request a new note
C
A N
S L
I M
|
RAX
-
NYSE
Rackspace Hosting Inc
INTERNET - Internet Software and; Services
|
$55.46
|
-0.77
-1.37% |
$56.88
|
1,127,041
53.87% of 50 DAV
50 DAV is 2,092,300
|
$59.43
-6.68%
|
2/2/2012
|
$46.69
|
PP = $45.55
|
|
MB = $47.83
|
Most Recent Note - 4/16/2012 5:53:38 PM
G - Extended from its prior base, meanwhile consolidating above its 50 DMA line ($54.28) which defines important near-term support to watch.
>>> The latest Featured Stock Update with an annotated graph appeared on 4/10/2012. Click here.
View all notes |
Alert me of new notes |
CANSLIM.net Company Profile |
SEC |
Zacks Reports |
StockTalk |
News |
Chart |
Request a new note
C
A N
S L
I M
|
Symbol/Exchange
Company Name
Industry Group |
PRICE |
CHANGE
(%Change) |
Day High |
Volume
(% DAV)
(% 50 day avg vol) |
52 Wk Hi
% From Hi |
Featured
Date |
Price
Featured |
Pivot Featured |
|
Max Buy |
RGR
-
NYSE
Sturm Ruger & Co Inc
CONSUMER DURABLES - Sporting Goods
|
$49.69
|
-0.06
-0.12% |
$51.09
|
438,276
119.81% of 50 DAV
50 DAV is 365,800
|
$53.29
-6.76%
|
3/22/2012
|
$46.49
|
PP = $46.78
|
|
MB = $49.12
|
Most Recent Note - 4/12/2012 3:27:02 PM
G - Up again today, rising within close striking distance of its best-ever close. Found prompt support after a pullback near its prior high in the $46 area previously noted as support to watch above its 50 DMA line.
>>> The latest Featured Stock Update with an annotated graph appeared on 3/22/2012. Click here.
View all notes |
Alert me of new notes |
CANSLIM.net Company Profile |
SEC |
Zacks Reports |
StockTalk |
News |
Chart |
Request a new note
C
A N
S L
I M
|
RRTS
-
NYSE
Roadrunner Trans Systems
TRANSPORTATION - Air Delivery and Freight Service
|
$17.35
|
+0.02
0.12% |
$17.62
|
54,331
42.35% of 50 DAV
50 DAV is 128,300
|
$18.59
-6.67%
|
2/10/2012
|
$17.40
|
PP = $17.50
|
|
MB = $18.38
|
Most Recent Note - 4/11/2012 4:54:13 PM
G - Its rebound above the 50 DMA today indicated that it was finding prompt support, helping its outlook. Subsequent deterioration below the prior low would raise even greater concerns.
>>> The latest Featured Stock Update with an annotated graph appeared on 4/9/2012. Click here.
View all notes |
Alert me of new notes |
CANSLIM.net Company Profile |
SEC |
Zacks Reports |
StockTalk |
News |
Chart |
Request a new note
C
A N
S L
I M
|
SHFL
-
NASDAQ
Shuffle Master Inc
MANUFACTURING - Diversified Machinery
|
$16.84
|
-0.16
-0.94% |
$17.00
|
457,200
68.68% of 50 DAV
50 DAV is 665,700
|
$18.77
-10.28%
|
3/6/2012
|
$17.07
|
PP = $15.25
|
|
MB = $16.01
|
Most Recent Note - 4/11/2012 11:35:52 AM
G - Rebounding today following a slump near its 50 DMA line with 4 consecutive losses since hitting its 52-week high. It is extended from any sound base pattern.
>>> The latest Featured Stock Update with an annotated graph appeared on 3/15/2012. Click here.
View all notes |
Alert me of new notes |
CANSLIM.net Company Profile |
SEC |
Zacks Reports |
StockTalk |
News |
Chart |
Request a new note
C
A N
S L
I M
|
SXCI
-
NASDAQ
S X C Health Solutions
COMPUTER SOFTWARE and SERVICES - Healthcare Information Service
|
$78.45
|
-0.08
-0.10% |
$79.88
|
334,450
78.25% of 50 DAV
50 DAV is 427,400
|
$79.26
-1.02%
|
2/23/2012
|
$68.24
|
PP = $66.05
|
|
MB = $69.35
|
Most Recent Note - 4/10/2012 6:23:30 PM
G - Pulled back today with near average volume, consolidating from last week's new 52-week high. Extended from its prior base, its 50 DMA line defines support to watch on pullbacks.
>>> The latest Featured Stock Update with an annotated graph appeared on 3/6/2012. Click here.
View all notes |
Alert me of new notes |
CANSLIM.net Company Profile |
SEC |
Zacks Reports |
StockTalk |
News |
Chart |
Request a new note
C
A N
S L
I M
|
TDG
-
NYSE
Transdigm Group Inc
AEROSPACE/DEFENSE - Aerospace/Defense Products and; Services
|
$117.03
|
+0.99
0.85% |
$117.73
|
340,097
80.59% of 50 DAV
50 DAV is 422,000
|
$121.48
-3.66%
|
2/29/2012
|
$120.10
|
PP = $118.93
|
|
MB = $124.88
|
Most Recent Note - 4/12/2012 3:34:03 PM
Y - Gains came with light volume as it rebounded above its 50 DMA line helping its outlook improve, and the color code is changed to yellow again. Volume-driven gains for a new high close would be an encouraging sign of fresh institutional buying demand that could lead to a meaningful advance. Meanwhile, deterioration below prior lows ($110.60 on 3/20/12) would trigger a more worrisome technical sell signal.
>>> The latest Featured Stock Update with an annotated graph appeared on 3/30/2012. Click here.
View all notes |
Alert me of new notes |
CANSLIM.net Company Profile |
SEC |
Zacks Reports |
StockTalk |
News |
Chart |
Request a new note
C
A N
S L
I M
|
Symbol/Exchange
Company Name
Industry Group |
PRICE |
CHANGE
(%Change) |
Day High |
Volume
(% DAV)
(% 50 day avg vol) |
52 Wk Hi
% From Hi |
Featured
Date |
Price
Featured |
Pivot Featured |
|
Max Buy |
TIBX
-
NASDAQ
Tibco Software Inc
COMPUTER SOFTWARE and SERVICES - Business Software and Services
|
$32.68
|
-0.63
-1.89% |
$33.69
|
2,411,423
96.43% of 50 DAV
50 DAV is 2,500,700
|
$33.69
-3.00%
|
3/30/2012
|
$31.01
|
PP = $31.25
|
|
MB = $32.81
|
Most Recent Note - 4/16/2012 5:42:36 PM
Y - Perched near its "max buy" level after trading to new 52-week highs last week. A recent low ($30.03 on 4/02/12) and its 50 DMA line nearly coincide, defining an important support level to watch on pullbacks.
>>> The latest Featured Stock Update with an annotated graph appeared on 4/5/2012. Click here.
View all notes |
Alert me of new notes |
CANSLIM.net Company Profile |
SEC |
Zacks Reports |
StockTalk |
News |
Chart |
Request a new note
C
A N
S L
I M
|
TNGO
-
NASDAQ
Tangoe Inc
COMPUTER SOFTWARE and SERVICES - Technical and System Software
|
$19.05
|
-0.07
-0.37% |
$19.94
|
445,425
71.13% of 50 DAV
50 DAV is 626,200
|
$20.05
-4.99%
|
3/27/2012
|
$19.35
|
PP = $20.00
|
|
MB = $21.00
|
Most Recent Note - 4/16/2012 5:44:08 PM
G - Gapped up today and challenged its 52-week high then reversed into the red for a small loss with below average volume. Found prompt support after recent violations of its 50 DMA line triggered technical sell signals following a 3/20/12 Public Offering.
>>> The latest Featured Stock Update with an annotated graph appeared on 4/3/2012. Click here.
View all notes |
Alert me of new notes |
CANSLIM.net Company Profile |
SEC |
Zacks Reports |
StockTalk |
News |
Chart |
Request a new note
C
A N
S L
I M
|
TSCO
-
NASDAQ
Tractor Supply Co
SPECIALTY RETAIL - Specialty Retail, Other
|
$98.01
|
-0.37
-0.38% |
$99.22
|
1,704,796
228.01% of 50 DAV
50 DAV is 747,700
|
$99.33
-1.33%
|
1/12/2012
|
$79.12
|
PP = $75.58
|
|
MB = $79.36
|
Most Recent Note - 4/16/2012 12:35:39 PM
G - Hovering at its all-time high today following considerable gains with heavy volume after the company raised its guidance last week. It is very extended from its prior base. Its 50 DMA line defines support to watch on pullbacks.
>>> The latest Featured Stock Update with an annotated graph appeared on 2/27/2012. Click here.
View all notes |
Alert me of new notes |
CANSLIM.net Company Profile |
SEC |
Zacks Reports |
StockTalk |
News |
Chart |
Request a new note
C
A N
S L
I M
|
UA
-
NYSE
Under Armour Inc Cl A
CONSUMER NON-DURABLES - Textile - Apparel Clothing
|
$95.08
|
-1.18
-1.23% |
$97.65
|
455,304
48.66% of 50 DAV
50 DAV is 935,700
|
$99.35
-4.30%
|
2/15/2012
|
$85.77
|
PP = $84.86
|
|
MB = $89.10
|
Most Recent Note - 4/10/2012 6:28:11 PM
G - Down today on higher (near average) volume, slumping toward its 50 DMA line. Prior gains above its pivot point did not have volume sufficient to trigger a proper technical buy signal, and recent losses on higher volume (near average, but above prior session totals) indicate distributional pressure while working on a possible new base-on-base pattern.
>>> The latest Featured Stock Update with an annotated graph appeared on 4/4/2012. Click here.
View all notes |
Alert me of new notes |
CANSLIM.net Company Profile |
SEC |
Zacks Reports |
StockTalk |
News |
Chart |
Request a new note
C
A N
S L
I M
|
UBNT
-
NASDAQ
Ubiquiti Networks Inc
TELECOMMUNICATIONS - Diversified Communication Serv
|
$32.97
|
-1.38
-4.02% |
$34.77
|
289,536
82.80% of 50 DAV
50 DAV is 349,700
|
$35.32
-6.65%
|
4/12/2012
|
$33.89
|
PP = $34.07
|
|
MB = $35.77
|
Most Recent Note - 4/16/2012 1:51:18 PM
Y - Pulling back today from high today from an all-time high hit on the prior session. Its color code was changed to yellow with new pivot point cited based on its 3/26/12 high plus 10 cents after forming an advanced "ascending base" pattern marked by 3 pullbacks of 10-20% following its previous breakout. A volume-driven gain did not yet trigger a proper new (or add-on) technical buy signal.

>>> The latest Featured Stock Update with an annotated graph appeared on 3/21/2012. Click here.
View all notes |
Alert me of new notes |
CANSLIM.net Company Profile |
SEC |
Zacks Reports |
StockTalk |
News |
Chart |
Request a new note
C
A N
S L
I M
|
Symbol/Exchange
Company Name
Industry Group |
PRICE |
CHANGE
(%Change) |
Day High |
Volume
(% DAV)
(% 50 day avg vol) |
52 Wk Hi
% From Hi |
Featured
Date |
Price
Featured |
Pivot Featured |
|
Max Buy |
ULTA
-
NASDAQ
Ulta Salon Cosm & Frag
SPECIALTY RETAIL - Specialty Retail, Other
|
$93.15
|
-1.78
-1.88% |
$95.85
|
559,148
82.26% of 50 DAV
50 DAV is 679,700
|
$95.62
-2.58%
|
1/11/2012
|
$71.97
|
PP = $75.80
|
|
MB = $79.59
|
Most Recent Note - 4/16/2012 1:54:07 PM
G - Touched a new high today then reversed into the red. Its 50 DMA line defines support to watch well above its prior highs in the $75 area.
>>> The latest Featured Stock Update with an annotated graph appeared on 2/28/2012. Click here.
View all notes |
Alert me of new notes |
CANSLIM.net Company Profile |
SEC |
Zacks Reports |
StockTalk |
News |
Chart |
Request a new note
C
A N
S L
I M
|
V
-
NYSE
Visa Inc Cl A
DIVERSIFIED SERVICES - Business/Management Services
|
$120.83
|
-2.33
-1.89% |
$123.05
|
4,577,037
126.47% of 50 DAV
50 DAV is 3,619,000
|
$123.68
-2.30%
|
3/12/2012
|
$116.53
|
PP = $119.46
|
|
MB = $125.43
|
Most Recent Note - 4/16/2012 5:39:38 PM
Y - Pulled back today with a loss on above average volume. Friday's gain backed by +49% above average volume technically confirmed a buy signal. Its 50 DMA line defines support to watch well above prior highs in the $103-104 area.
>>> The latest Featured Stock Update with an annotated graph appeared on 3/7/2012. Click here.
View all notes |
Alert me of new notes |
CANSLIM.net Company Profile |
SEC |
Zacks Reports |
StockTalk |
News |
Chart |
Request a new note
C
A N
S L
I M
|