You are not logged in.
This means you
CAN ONLY VIEW reports that were published prior to Monday, April 14, 2025.
You
MUST UPGRADE YOUR MEMBERSHIP if you want to see any current reports.
AFTER MARKET UPDATE - FRIDAY, APRIL 16TH, 2010
Previous After Market Report Next After Market Report >>>
|
|
|
|
DOW |
-125.91 |
11,018.66 |
-1.13% |
|
Volume |
1,752,863,170 |
+46% |
|
Volume |
2,816,776,410 |
+4% |
|
NASDAQ |
-34.43 |
2,481.26 |
-1.37% |
|
Advancers |
572 |
18% |
|
Advancers |
730 |
26% |
|
S&P 500 |
-19.54 |
1,192.13 |
-1.61% |
|
Decliners |
2,482 |
78% |
|
Decliners |
1,973 |
70% |
|
Russell 2000 |
-9.59 |
714.62 |
-1.32% |
|
52 Wk Highs |
217 |
|
|
52 Wk Highs |
198 |
|
|
S&P 600 |
-4.10 |
378.78 |
-1.07% |
|
52 Wk Lows |
9 |
|
|
52 Wk Lows |
13 |
|
|
 |
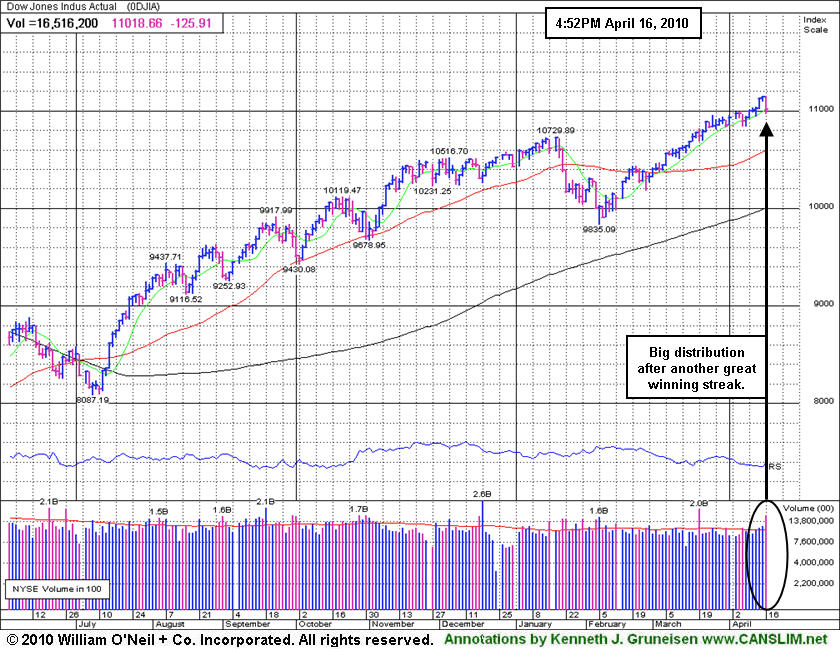
Distributional Pressure Follows Another Great Winning Streak
Adam Sarhan, Contributing Writer,
The major averages rallied during the first half of the week but gave back those gains on Friday's ugly distribution day. Volume jumped on Friday compared to Thursday's levels after the SEC charged investment giant Goldman Sachs (GS -12.79%) with fraud when they sold CDOs in 2007. Decliners trumped advancers by nearly a 4-to-1 ratio on the Nasdaq exchange and by nearly a 3-to-1 ratio on the NYSE. New 52-week highs still easily trumped new lows on both exchanges. There were 37 high-ranked companies from the CANSLIM.net Leaders List that made a new 52-week high and appeared on the CANSLIM.net BreakOuts Page, lower than the 89 issues that appeared on the prior session. A healthy crop of new leaders making new highs bodes well for any market rally. Regular readers know we have repeatedly noted in this commentary -"the recent expansion in leadership has been a welcome improvement."
Stocks edged higher on Monday after Greece received an international aid pledge to help it get through its worst financial crisis since WWII. After Monday's close, Alcoa Inc. (AA -2.80%) kicked off Q1 earnings season and reported a narrower Q1 loss, citing improving demand. Stocks ended higher on Tuesday shrugging off an ominous report that showed small business owners are still pessimistic on the economy.
The major averages jumped above important psychological resistance levels after a slew of stronger than expected earnings and economic data were released. Intel Corp (INTC -1.24%), JP Morgan Chase & Co (JPM -4.73%) and railroad giant CSX Corp. (CSX -1.47%) all topped estimates and reported solid Q1 results. All three stocks gapped up on Wednesday which helped the benchmark S&P 500 and the tech-heavy Nasdaq Composite close above their psychologically important resistance levels for the first time since September 2008 (when Lehman failed). By Friday's close, the Nasdaq (2,500) and S&P 500 (1,200) both closed below their respective resistance levels while the Dow remained above 11,000.
On the economic front, the Consumer Price Index (CPI) was very mild and below expectations which suggests inflation remains tame as the economy continues to recover. Retail sales jumped in March which helped a slew of retailers hit fresh 52-week highs. Elsewhere, the Fed released its Beige Book which showed the economy continues to improve across much of the nation.
Before Thursday's open, the Labor Department said weekly jobless claims unexpectedly climbed to 484,000, which is a two month high. The four-week moving average of initial claims, which smooths out the weekly data, rose to 457,750 last week, from 450,250. Elsewhere, the Federal Reserve said factory production rose +0.9% after rising +0.2% in February which topped analyst estimates.
Stocks were smacked on Friday after several high profile companies released their Q1 results and the SEC charged Goldman Sachs with fraud when they sold CDOs in 2007. The major averages have been steadily rallying since early February and a pullback of some sort should be expected. The prior commentary's observation, "Since the March 1, 2010 follow-though-day (FTD) a handful of distribution days has not been the least bit damaging to the market's confirmed rally" - was immediately followed with the 6th distribution day for the S&P 500 Index, a sign of mounting pressure on this 7-week rally. Trade accordingly.
Professional Money Management Services- Free Portfolio Review:
Our skilled team of portfolio managers knows how to follow the rules of this fact-based investment system. If your portfolio is greater than $100,000 and you would like a free portfolio review, click here to get connected with one of our portfolio managers. ** Serious inquires only, please.
PICTURED: The Dow Jones Industrial Average was smacked with heavy distribution after yet another great winning streak.
|
|
|
 |
Financial Shares Dive As Goldman Sachs Faces SEC Fraud Charge
Kenneth J. Gruneisen - Passed the CAN SLIM® Master's Exam
Losses were widespread on Friday and financial shares were standout decliners as big losses for the Bank Index ($BKX -3.46%) and Broker/Dealer Index ($XBD -3.28%) negatively influenced the major indices and investor sentiment sank. Commodity-linked areas slumped as the Gold & Silver Index ($XAU -2.54%), Oil Services Index ($OSX -2.06%), and Integrated Oil Index ($XOI -1.65%) lost ground. The Retail Index ($RLX -1.42%) suffered a modest loss, and the tech sector saw unanimous losses from the Internet Index ($IIX -1.99%), Networking Index ($NWX -1.44%), Semiconductor Index ($SOX -1.28%), and Biotechnology Index ($BTK -0.95%). The Healthcare Index ($HMO -0.34%) held its ground better than most areas.
Charts courtesy www.stockcharts.com
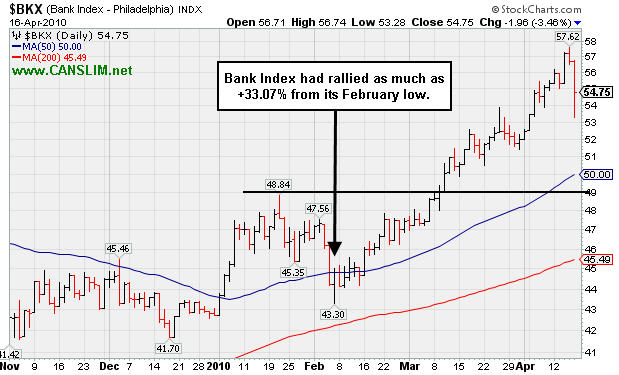
PICTURED: The Bank Index ($BKX -3.46%) was a standout decliner as Goldman Sachs (GS -12.79%) fell sharply in response to SEC fraud charges. The Bank Index had rallied as much as +33.07% from its February low.
| Oil Services |
$OSX |
211.61 |
-4.45 |
-2.06% |
+8.56% |
| Healthcare |
$HMO |
1,512.69 |
-5.22 |
-0.34% |
+2.70% |
| Integrated Oil |
$XOI |
1,111.84 |
-18.63 |
-1.65% |
+4.08% |
| Semiconductor |
$SOX |
393.75 |
-5.11 |
-1.28% |
+9.40% |
| Networking |
$NWX |
270.58 |
-3.97 |
-1.44% |
+17.10% |
| Internet |
$IIX |
255.93 |
-5.21 |
-1.99% |
+9.44% |
| Broker/Dealer |
$XBD |
120.01 |
-4.07 |
-3.28% |
+4.31% |
| Retail |
$RLX |
475.38 |
-6.84 |
-1.42% |
+15.62% |
| Gold & Silver |
$XAU |
168.67 |
-4.39 |
-2.54% |
+0.25% |
| Bank |
$BKX |
54.75 |
-1.96 |
-3.46% |
+28.19% |
| Biotech |
$BTK |
1,226.36 |
-11.82 |
-0.95% |
+30.17% |
|
|
|
 |
Up/Down Volume Ratio Indicates Leader Under Accumulation
Kenneth J. Gruneisen - Passed the CAN SLIM® Master's Exam
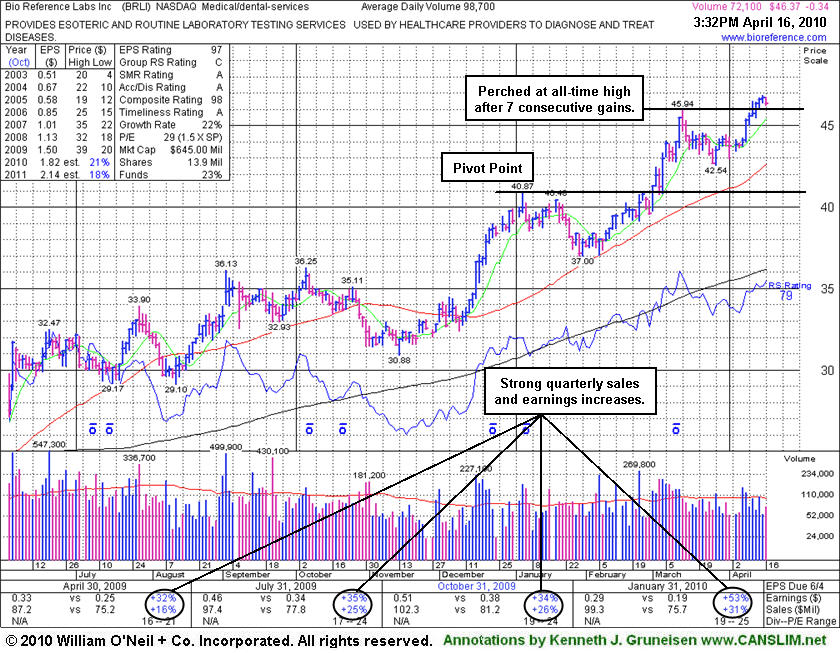
Bio-Reference Laboratories, Inc. (BRLI +$0.05 to $46.76) finished with a small gain and it has posted 8 consecutive gains. Its current Up/Down Volume Ratio of 2.0 is an unbiased indication its shares have been under accumulation recently. However, its latest consolidation for 4 weeks well above its 50-day moving average (DMA) line was considered too short to be a 5-week flat base, and volume behind its latest gains for new highs was not heavy. Its recent chart low ($42.54 on 3/26/10) is an initial support level to watch, and it now coincides with its short-term average.
A gain on 3/04/10 with 2 times average volume lifted it solidly above its previously cited pivot point, confirming a technical buy signal. Its weekly chart is marked by many up weeks with above average volume and few down weeks on volume - very bullish characteristics. No resistance remains due to overhead supply now, which could allow for a significant sprint higher. Earnings growth and sales revenues growth has accelerated, with increases better than the +25% minimum guideline in recent quarters. Fundamentals are favorable with respect to the C and A criteria of the investment system. BRLI has only 13.9 million shares outstanding (S criteria) and has average daily volume under 100,000 shares, which could contribute to greater price volatility in the event of more decisive institutional buying or selling. The number of top-rated funds owning its shares rose from 77 in Mar '09 to 84 in Mar '10 which is somewhat reassuring in regard to the I criteria of the investment system.
|
|
|
Color Codes Explained :
Y - Better candidates highlighted by our
staff of experts.
G - Previously featured
in past reports as yellow but may no longer be buyable under the
guidelines.
***Last / Change / Volume quote data in this table corresponds with the timestamp on the note***
Symbol/Exchange
Company Name
Industry Group |
Last |
Chg. |
Vol
% DAV |
Date Featured |
Price Featured |
Latest Pivot Point
Featured |
Status |
| Latest Max Buy Price |
ARUN
- NASDAQ
Aruba Networks Inc
COMPUTER HARDWARE - Networking & Communication Dev
|
$13.17
|
-0.39
|
1,334,066
82% DAV
1,622,800
|
2/19/2010
(Date
Featured) |
$12.71
(Price
Featured) |
PP = $11.94 |
G |
| MB = $12.54 |
Most Recent Note - 4/16/2010 4:13:10 PM
G - Down today, and gapped down on 4/15/10 after an analyst downgrade, both losses on below average volume. Its 50 DMA line and recent chart low ($12.21 on 3/19/10) are support levels to watch.
>>> The latest Featured Stock Update with an annotated graph appeared on 3/31/2010. click here.
|
|
C
A
S
I |
News |
Chart |
SEC
View all notes Alert
me of new notes
Company
Profile
|
BIDU
- NASDAQ
Baidu Inc Ads
INTERNET - Internet Information Providers
|
$632.37
|
-16.59
|
1,589,110
97% DAV
1,642,200
|
1/13/2010
(Date
Featured) |
$431.25
(Price
Featured) |
PP = $426.75 |
G |
| MB = $448.09 |
Most Recent Note - 4/16/2010 4:14:57 PM
G - Pulled back today after 6 consecutive gains. It has been repeatedly noted as extended from any sound base after 10 consecutive weekly gains, however it could produce more climactic gains, especially due to the small supply (S criteria) of shares outstanding.
>>> The latest Featured Stock Update with an annotated graph appeared on 3/24/2010. click here.
|
|
C
A
S
I |
News |
Chart |
SEC
View all notes Alert
me of new notes
Company
Profile
|
BPI
- NYSE
Bridgepoint Education
DIVERSIFIED SERVICES - Education &; Training Services
|
$25.43
|
-0.85
|
193,614
47% DAV
416,100
|
4/13/2010
(Date
Featured) |
$25.59
(Price
Featured) |
PP = $25.76 |
Y |
| MB = $27.05 |
Most Recent Note - 4/16/2010 5:07:47 PM
Y- Loss today on light volume, closing just above its prior high close ($25.40 on 3/24/10). Pulling back to from its 52 week high since appearing in yellow in the 4/13/10 mid-day report (read here), when it triggered a new technical buy signal as it rose from a cup-with-high-handle
>>> The latest Featured Stock Update with an annotated graph appeared on 4/13/2010. click here.
|
|
C
A
S
I |
News |
Chart |
SEC
View all notes Alert
me of new notes
Company
Profile
|
BRLI
- NASDAQ
Bio Reference Labs Inc
HEALTH SERVICES - Medical Laboratories & Researc
|
$46.76
|
+0.05
|
91,540
93% DAV
98,700
|
2/12/2010
(Date
Featured) |
$39.02
(Price
Featured) |
PP = $40.97 |
G |
| MB = $43.02 |
Most Recent Note - 4/16/2010 5:10:12 PM
G - Perched at its all-time high after a streak of consecutive gains. Its recent chart low ($42.54 on 3/26/10) is an initial support level to watch near its short-term average.
>>> The latest Featured Stock Update with an annotated graph appeared on 4/16/2010. click here.
|
|
C
A
S
I |
News |
Chart |
SEC
View all notes Alert
me of new notes
Company
Profile
|
CISG
- NASDAQ
Cninsure Inc Ads
INSURANCE - Insurance Brokers
|
$25.70
|
-2.79
|
729,232
309% DAV
236,000
|
3/3/2010
(Date
Featured) |
$24.38
(Price
Featured) |
PP = $23.10 |
G |
| MB = $24.26 |
Most Recent Note - 4/16/2010 5:48:43 PM
G - Down considerably today with 3 times average volume, coming under heavy distributional pressure. Prior chart highs and its 50 DMA line in the $24 area define an important support level. It traded up as much as +17.4% since featured in yellow in the 3/03/10 mid-day report (read here).
>>> The latest Featured Stock Update with an annotated graph appeared on 3/23/2010. click here.
|
|
C
A
S
I |
News |
Chart |
SEC
View all notes Alert
me of new notes
Company
Profile
|
CRM
- NYSE
Salesforce.com Inc
INTERNET - Internet Software & Services
|
$83.48
|
-0.25
|
2,485,287
140% DAV
1,780,500
|
3/5/2010
(Date
Featured) |
$72.28
(Price
Featured) |
PP = $75.53 |
G |
| MB = $79.31 |
Most Recent Note - 4/16/2010 5:49:10 PM
G - Holding its ground at all-time highs. Extended from prior chart highs and well above its "max buy" level now, the volume totals were below the investment system guidelines as it rallied above its latest pivot point.
>>> The latest Featured Stock Update with an annotated graph appeared on 3/25/2010. click here.
|
|
C
A
S
I |
News |
Chart |
SEC
View all notes Alert
me of new notes
Company
Profile
|
CTRP
- NASDAQ
Ctrip.com Intl Ltd Adr
LEISURE - Resorts & Casinos
|
$39.08
|
-0.90
|
1,533,361
75% DAV
2,031,700
|
3/25/2010
(Date
Featured) |
$40.74
(Price
Featured) |
PP = $39.40 |
Y |
| MB = $41.37 |
Most Recent Note - 4/16/2010 5:50:09 PM
Y - Slumped back under its pivot point again today. Encountered mild distributional pressure since 3/25/10 when a detailed Stock Bulletin with annotated graph and expert analysis was published (read here).
>>> The latest Featured Stock Update with an annotated graph appeared on 4/12/2010. click here.
|
|
C
A
S
I |
News |
Chart |
SEC
View all notes Alert
me of new notes
Company
Profile
|
EZPW
- NASDAQ
Ezcorp Inc Cl A
SPECIALTY RETAIL - Specialty Retail, Other
|
$21.39
|
-0.67
|
497,475
98% DAV
507,800
|
4/14/2010
(Date
Featured) |
$21.80
(Price
Featured) |
PP = $22.29 |
Y |
| MB = $23.40 |
Most Recent Note - 4/16/2010 5:50:55 PM
Y - Today's loss on average volume followed 4 consecutive gains on lighter volume. It is now on the right side of a 5-week base with no overhead supply to act as resistance. Color code was changed to yellow with new pivot point noted. Its 50 DMA line and its recent chart low ($19.73 on 3/16/10) define near-term support for this high-ranked Finance - Consumer/Commercial Loans firm.
>>> The latest Featured Stock Update with an annotated graph appeared on 3/29/2010. click here.
|
|
C
A
S
I |
News |
Chart |
SEC
View all notes Alert
me of new notes
Company
Profile
|
GMCR
- NASDAQ
Green Mtn Coffee Roastrs
FOOD & BEVERAGE - Processed & Packaged Goods
|
$94.35
|
-0.85
|
1,180,529
117% DAV
1,012,700
|
2/26/2010
(Date
Featured) |
$84.39
(Price
Featured) |
PP = $88.75 |
G |
| MB = $93.19 |
Most Recent Note - 4/16/2010 5:52:15 PM
G - Down today for a 5th consecutive session, yet hovering in a tight trading range, this high-ranked leader may be building a late-stage base after rallying more than 6-fold from its November '08 low. Support to watch on pullbacks is at prior chart highs and its 50-day moving average (DMA) line now coinciding in the $88 area.
>>> The latest Featured Stock Update with an annotated graph appeared on 4/5/2010. click here.
|
|
C
A
S
I |
News |
Chart |
SEC
View all notes Alert
me of new notes
Company
Profile
|
ISRG
- NASDAQ
Intuitive Surgical Inc
HEALTH SERVICES - Medical Appliances & Equipment
|
$360.39
|
-27.62
|
2,466,193
479% DAV
514,900
|
4/13/2010
(Date
Featured) |
$363.46
(Price
Featured) |
PP = $367.10 |
G |
| MB = $385.46 |
Most Recent Note - 4/16/2010 5:55:29 PM
G - Considerable loss today after reporting earnings, slumping under its pivot point and finishing near the session low, negating its latest breakout with a close below its old high close. Color code was changed to green. ISRG was featured again in the 4/13/10 mid-day report (read here) with new pivot point cited based on its 3/03/10 high.
>>> The latest Featured Stock Update with an annotated graph appeared on 4/7/2010. click here.
|
|
C
A
S
I |
News |
Chart |
SEC
View all notes Alert
me of new notes
Company
Profile
|
LOPE
- NASDAQ
Grand Canyon Education
DIVERSIFIED SERVICES - Education &; Training Services
|
$26.96
|
-0.06
|
190,359
56% DAV
341,800
|
4/13/2010
(Date
Featured) |
$27.71
(Price
Featured) |
PP = $27.33 |
Y |
| MB = $28.70 |
Most Recent Note - 4/16/2010 5:56:03 PM
Y - Third consecutive small loss today, closing below its pivot point. Subsequent weakness leading to a close below its old high close ($26.64 on 3/25/10) would raise concerns. Featured in the 4/13/10 mid-day report (read here), its gain triggered a technical buy after an advanced "3-weeks tight" type pattern.
>>> The latest Featured Stock Update with an annotated graph appeared on 4/14/2010. click here.
|
|
C
A
S
I |
News |
Chart |
SEC
View all notes Alert
me of new notes
Company
Profile
|
PCLN
- NASDAQ
Priceline.com Inc
INTERNET - Internet Software & Services
|
$399.55
|
-4.72
|
584,812
N/A
|
11/1/2002
(Date
Featured) |
$399.55
(Price
Featured) |
PP = $428.20 |
Y |
| MB = $449.61 |
Most Recent Note - 1/2/2011
Y - Returns to Featured Stocks list with its appearance in the January 2011 CANSLIM.net News including detailed analysis and annotated daily and weekly graphs.
>>> The latest Featured Stock Update with an annotated graph appeared on 3/30/2010. click here.
|
|
C
A
S
I |
News |
Chart |
SEC
View all notes Alert
me of new notes
Company
Profile
|
PEGA
- NASDAQ
Pegasystems Inc
COMPUTER SOFTWARE & SERVICES - Business Software & Services
|
$38.01
|
-0.15
|
120,964
67% DAV
179,800
|
2/26/2010
(Date
Featured) |
$36.00
(Price
Featured) |
PP = $38.55 |
Y |
| MB = $40.48 |
Most Recent Note - 4/16/2010 5:57:54 PM
Y - Volume totals have been quiet while consolidating since 3/15/10, staying in a tight trading range near support. A violation of its 50 DMA line or its recent low ($36.42 on 4/12/10) would raise concerns and trigger technical sell signals.
>>> The latest Featured Stock Update with an annotated graph appeared on 4/6/2010. click here.
|
|
C
A
S
I |
News |
Chart |
SEC
View all notes Alert
me of new notes
Company
Profile
|
ROVI
- NASDAQ
Rovi Corp
COMPUTER SOFTWARE & SERVICES - Security Software & Services
|
$37.60
|
-0.61
|
569,681
42% DAV
1,341,100
|
2/25/2010
(Date
Featured) |
$33.54
(Price
Featured) |
PP = $34.87 |
G |
| MB = $36.61 |
Most Recent Note - 4/16/2010 5:58:48 PM
G - Today's loss ended a streak of 5 consecutive small gains with below average volume. Prior chart highs and its 50 DMA line coinciding in the $34 area define an important support level to watch on pullbacks.
>>> The latest Featured Stock Update with an annotated graph appeared on 4/8/2010. click here.
|
|
C
A
S
I |
News |
Chart |
SEC
View all notes Alert
me of new notes
Company
Profile
|
SIRO
- NASDAQ
Sirona Dental Systems
HEALTH SERVICES - Medical Instruments & Supplies
|
$38.81
|
-0.32
|
377,140
63% DAV
594,500
|
2/16/2010
(Date
Featured) |
$36.43
(Price
Featured) |
PP = $36.15 |
G |
| MB = $37.96 |
Most Recent Note - 4/16/2010 5:59:50 PM
G - Hit a new high today, then reversed into the red. Volume totals have been cooling while holding its ground near its 52-week high. Prior chart highs and its 50 DMA line in the $36 area define an initial support level to watch.
>>> The latest Featured Stock Update with an annotated graph appeared on 3/26/2010. click here.
|
|
C
A
S
I |
News |
Chart |
SEC
View all notes Alert
me of new notes
Company
Profile
|
ULTA
- NASDAQ
Ulta Salon Cosm & Frag
SPECIALTY RETAIL - Specialty Retail, Other
|
$23.61
|
-0.20
|
206,345
53% DAV
389,600
|
3/12/2010
(Date
Featured) |
$22.81
(Price
Featured) |
PP = $21.72 |
G |
| MB = $22.81 |
Most Recent Note - 4/16/2010 6:00:29 PM
G - Holding its ground stubbornly near its 52-week high, yet it has made very little progress since the detailed Stock Bulletin and 3/12/10 mid-day report appearance.
>>> The latest Featured Stock Update with an annotated graph appeared on 4/1/2010. click here.
|
|
C
A
S
I |
News |
Chart |
SEC
View all notes Alert
me of new notes
Company
Profile
|
VIT
-
|
$24.30
|
-0.08
|
578,602
90% DAV
645,300
|
4/9/2010
(Date
Featured) |
$23.79
(Price
Featured) |
PP = $23.95 |
Y |
| MB = $25.15 |
Most Recent Note - 4/16/2010 6:02:13 PM
Y - Held its ground today following some distributional pressure this week. On 4/09/10 it triggered a technical buy signal as a solid gain with heavy volume more than 4 times average helped it trade above its pivot point after a 5-week consolidation. Color code was yellow with new pivot point noted in the 4/09/10 mid-day report (read here).
>>> The latest Featured Stock Update with an annotated graph appeared on 4/9/2010. click here.
|
|
C
A
S
I |
News |
Chart |
SEC
View all notes Alert
me of new notes
Company
Profile
|
VPRT
- NASDAQ
Vistaprint Nv
DIVERSIFIED SERVICES - Business/Management Services
|
$59.23
|
+0.05
|
419,999
114% DAV
369,100
|
3/1/2010
(Date
Featured) |
$57.72
(Price
Featured) |
PP = $59.70 |
G |
| MB = $62.69 |
Most Recent Note - 4/16/2010 6:02:42 PM
G - Recently finding impressive support near its 50 DMA line. A subsequent violation of the short-term average or recent chart low ($55.45) would raise concerns and trigger technical sell signals. It did not trigger a new technical buy signal since it was featured in the March 2010 CANSLIM.net News monthly newsletter (read here).
>>> The latest Featured Stock Update with an annotated graph appeared on 4/15/2010. click here.
|
|
C
A
S
I |
News |
Chart |
SEC
View all notes Alert
me of new notes
Company
Profile
|
|
|
|
THESE ARE NOT BUY RECOMMENDATIONS!
Comments contained in the body of this report are technical
opinions only. The material herein has been obtained
from sources believed to be reliable and accurate, however,
its accuracy and completeness cannot be guaranteed.
This site is not an investment advisor, hence it does
not endorse or recommend any securities or other investments.
Any recommendation contained in this report may not
be suitable for all investors and it is not to be deemed
an offer or solicitation on our part with respect to
the purchase or sale of any securities. All trademarks,
service marks and trade names appearing in this report
are the property of their respective owners, and are
likewise used for identification purposes only.
This report is a service available
only to active Paid Premium Members.
You may opt-out of receiving report notifications
at any time. Questions or comments may be submitted
by writing to Premium Membership Services 665 S.E. 10 Street, Suite 201 Deerfield Beach, FL 33441-5634 or by calling 1-800-965-8307
or 954-785-1121.
|
|
|


