You are not logged in.
This means you
CAN ONLY VIEW reports that were published prior to Monday, April 14, 2025.
You
MUST UPGRADE YOUR MEMBERSHIP if you want to see any current reports.
AFTER MARKET UPDATE - TUESDAY, APRIL 15TH, 2014
Previous After Market Report Next After Market Report >>>
|
|
|
|
DOW |
+89.32 |
16,262.56 |
+0.55% |
|
Volume |
771,626,060 |
+14% |
|
Volume |
2,243,706,130 |
+27% |
|
NASDAQ |
+11.47 |
4,034.16 |
+0.29% |
|
Advancers |
1,861 |
59% |
|
Advancers |
1,327 |
45% |
|
S&P 500 |
+12.37 |
1,842.98 |
+0.68% |
|
Decliners |
1,182 |
37% |
|
Decliners |
1,552 |
52% |
|
Russell 2000 |
+4.14 |
1,119.49 |
+0.37% |
|
52 Wk Highs |
61 |
|
|
52 Wk Highs |
21 |
|
|
S&P 600 |
+1.98 |
648.06 |
+0.31% |
|
52 Wk Lows |
60 |
|
|
52 Wk Lows |
125 |
|
|
 |
Major Averages Posted Gains With Better Volume Conviction
Kenneth J. Gruneisen - Passed the CAN SLIM® Master's Exam
On Tuesday the major averages posted gains and finished near their session highs. The reported volume totals were higher than the prior session totals on both the NYSE and on the Nasdaq exchange. Advancers led decliners by a 3-2 margin on the NYSE, but decliners had a narrow 8-7 lead over advancers on the Nasdaq exchange. There were 9 high-ranked companies from the CANSLIM.net Leaders List that made new 52-week highs and appeared on the CANSLIM.net BreakOuts Page, up from the total of 7 stocks on the prior session. The new 52-week highs and new 52-week lows totals were evenly matched on the NYSE while new 52-week lows solidly outnumbered new 52-week highs on the Nasdaq exchange. There were gains for 3 of the 4 high-ranked companies currently included on the Featured Stocks Page, a list that has grown shorter as numerous leaders have broken down in recent weeks. The Market (M criteria) pullback earned the label of a "correction" as a result of recent pressure on the indices, especially the tech-heavy Nasdaq Composite Index, coupled with waning leadership (fewer stocks hitting new 52-week highs). Investors are reminded to limit losses by always selling any stock that falls more than -7% from their purchase price. This is precisely how the fact-based investment system prompts investors to reduce their overall market exposure during weak periods.
At the end of the choppy trading session on Tuesday the Dow was up 89 points to 16,262. The S&P 500 gained 12 points to 1842. The NASDAQ was up 11 points to 4,034.
The major averages advanced for a second day as investors weighed updates on the economy and corporate profits. Before the open, reports showed consumer prices increased +0.2% in March while activity in the Fed's New York region unexpectedly slowed in April. A separate release revealed homebuilder sentiment rose less than projected this month. Investor attention also focused on the mounting tension in Ukraine.
On the earnings front, Coca-Cola (KO +3.7%) rallied after revenues topped analyst projections. Johnson & Johnson (JNJ +2.1%) rose following its better-than-expected quarterly results and increased full-year forecast. Shares of Northern Trust (NTRS -2.6%) after the bank's earnings fell short of estimates. Intel (INTC +0.8%) and Yahoo! (YHOO +2.3%) rose ahead of their scheduled profits results after the close.
Nine of 10 sectors were higher on the session. Energy and utilities were the best performing groups as Chevron (CVX +1.4%) and Exelon (EXC +2%) rose. Consumer Discretionary was lone sector down, and casino operator Wynn Resorts (WYNN -3.6%) paced the decline.
Treasuries rose with the 10-year note climbing 6/32 to yield 2.62%.
The CANSLIM.net Featured Stocks Page shows the most action-worthy candidates and their latest notes and a Headline Link directs members to the latest detailed analysis with data-packed graphs annotated by a Certified expert along with links to additional resources. The Premium Member Homepage includes "dynamic archives" to all prior pay reports published. Watch for an announcement via email concerning the next WEBCAST.
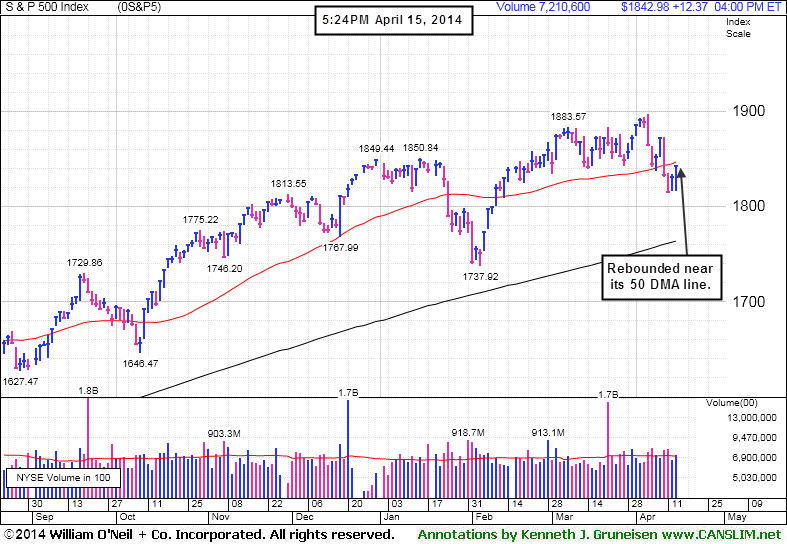
PICTURED 1: The S&P 500 Index rebounded near its 50-day moving average (DMA) line. That short-term average may act as a resistance level. A rally back above the 50 DMA line would be an encouraging sign, especially if accompanied by higher volume totals and an expansion in leadership (stocks making new 52-week highs).
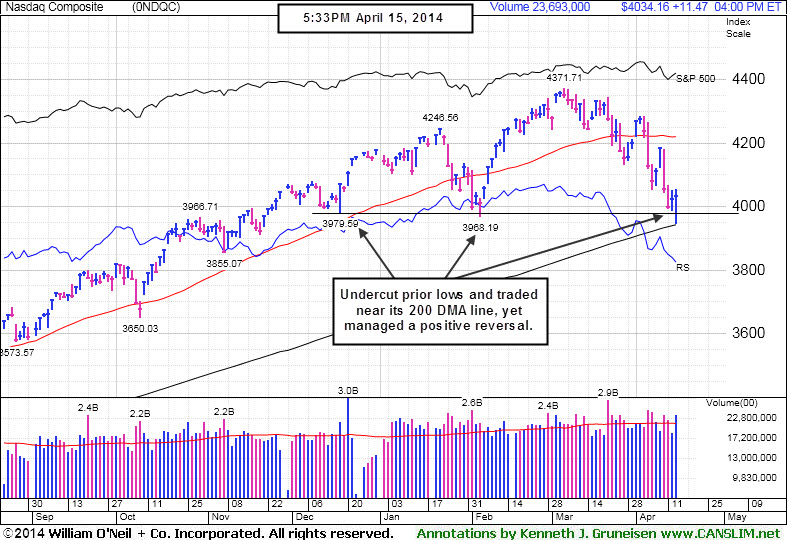
PICTURED 2: The Nasdaq Composite Index undercut prior lows and tested support at its 200-day moving average (DMA) line yet managed a positive reversal.
|
 Kenneth J. Gruneisen started out as a licensed stockbroker in August 1987, a couple of months prior to the historic stock market crash that took the Dow Jones Industrial Average down -22.6% in a single day. He has published daily fact-based fundamental and technical analysis on high-ranked stocks online for two decades. Through FACTBASEDINVESTING.COM, Kenneth provides educational articles, news, market commentary, and other information regarding proven investment systems that work in good times and bad.
Comments contained in the body of this report are technical opinions only and are not necessarily those of Gruneisen Growth Corp. The material herein has been obtained from sources believed to be reliable and accurate, however, its accuracy and completeness cannot be guaranteed. Our firm, employees, and customers may effect transactions, including transactions contrary to any recommendation herein, or have positions in the securities mentioned herein or options with respect thereto. Any recommendation contained in this report may not be suitable for all investors and it is not to be deemed an offer or solicitation on our part with respect to the purchase or sale of any securities. |
|
 |
Financial, Tech, and Energy-Linked Groups Rose
Kenneth J. Gruneisen - Passed the CAN SLIM® Master's Exam
The Broker/Dealer Index ($XBD +0.76%) and the Bank Index ($BKX +0.77%) both posted modest gains which had a positive influence on the major averages on Tuesday. The Retail Index ($RLX +0.01%) finished flat. The tech sector saw unanimous gains of less than +1% from the Networking Index ($NWX +0.57%), Semiconductor Index ($SOX +0.70%), and the Biotechnology Index ($BTK +0.84%). Energy-related groups also had a positive bias as the Integrated Oil Index ($XOI +0.99%) and the Oil Services Index ($OSX +1.41%) rose.
Charts courtesy www.stockcharts.com
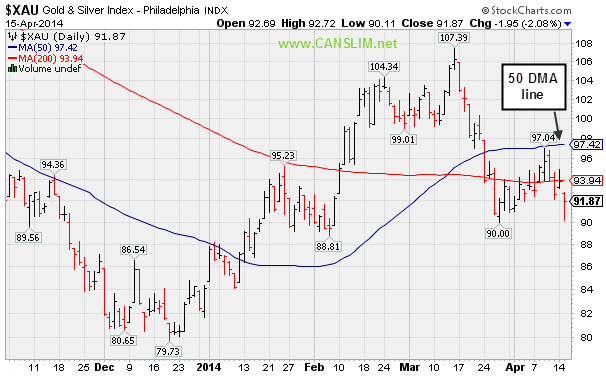
PICTURED: The Gold & Silver Index ($XAU -2.09%) was a clear laggard as it lost ground. It ran into resistance at its 50-day moving average (DMA) line on the last rally effort and has slumped back below its 200 DMA line toward the March lows.
| Oil Services |
$OSX |
291.88 |
+4.07 |
+1.41% |
+3.86% |
| Integrated Oil |
$XOI |
1,553.82 |
+15.21 |
+0.99% |
+3.37% |
| Semiconductor |
$SOX |
569.00 |
+3.98 |
+0.70% |
+6.35% |
| Networking |
$NWX |
326.68 |
+1.85 |
+0.57% |
+0.85% |
| Broker/Dealer |
$XBD |
149.11 |
+1.12 |
+0.76% |
-7.13% |
| Gold & Silver |
$XAU |
91.87 |
-1.96 |
-2.09% |
+9.17% |
| Bank |
$BKX |
69.12 |
+0.53 |
+0.77% |
-0.20% |
| Biotech |
$BTK |
2,387.62 |
+19.93 |
+0.84% |
+2.45% |
|
|
|
 |
Submit Your Request for a Featured Stock Update
Kenneth J. Gruneisen - Passed the CAN SLIM® Master's Exam
Market conditions (the M criteria) are challenging at times. There are few stocks included on the Featured Stocks list and none of the companies need additional review in detail with annotated graphs. At times like these we have an opportunity to look back and review previously featured stocks which were dropped, which can serve as an educational review of the investment system's tactics and a reminder that high-ranked leaders eventually fall out of favor. If you wish to request for a specific stock to receive more detailed coverage in this section please use the inquiry form to submit your request. Thank you! |
|
|
Color Codes Explained :
Y - Better candidates highlighted by our
staff of experts.
G - Previously featured
in past reports as yellow but may no longer be buyable under the
guidelines.
***Last / Change / Volume data in this table is the closing quote data***
Symbol/Exchange
Company Name
Industry Group |
PRICE |
CHANGE
(%Change) |
Day High |
Volume
(% DAV)
(% 50 day avg vol) |
52 Wk Hi
% From Hi |
Featured
Date |
Price
Featured |
Pivot Featured |
|
Max Buy |
EQM
-
NYSE
E Q T Midstream Partners
ENERGY - Oil and Gas Pipelines
|
$72.95
|
+1.98
2.79% |
$73.31
|
165,687
144.08% of 50 DAV
50 DAV is 115,000
|
$73.90
-1.29%
|
12/12/2013
|
$53.17
|
PP = $56.51
|
|
MB = $59.34
|
Most Recent Note - 4/14/2014 5:56:04 PM
G - Touched a new high today then reversed into the red for a small loss and ended near the session low. Holding its ground and in strong shape, technically, despite fundamental concerns recently noted. Its 50 DMA line defines near-term support where a violation may trigger a technical sell signal.
>>> FEATURED STOCK ARTICLE : Technical Strength Continues Despite Fundamental Concerns - 4/9/2014
View all notes |
Set NEW NOTE alert |
CANSLIM.net Company Profile |
SEC
News |
Chart |
Request a new note
C
A N
S L
I M


|
GNRC
-
NYSE
Generac Hldgs Inc
Electrical-Power/Equipmt
|
$56.89
|
+0.57
1.01% |
$57.14
|
474,547
59.77% of 50 DAV
50 DAV is 794,000
|
$62.50
-8.98%
|
2/14/2014
|
$56.50
|
PP = $57.39
|
|
MB = $60.26
|
Most Recent Note - 4/11/2014 6:09:47 PM
G - Finished just below its 50 DMA line after undercutting prior highs in the $57 area and its color code is changed to green. More damaging losses below its recent low ($55.65 on 4/07/14) would raise greater concerns. See the latest FSU analysis for more details and new annotated graphs.
>>> FEATURED STOCK ARTICLE : Finished Just Below its 50-Day Average Line - 4/11/2014
View all notes |
Set NEW NOTE alert |
CANSLIM.net Company Profile |
SEC
News |
Chart |
Request a new note
C
A N
S L
I M
|
ICON
-
NASDAQ
Iconix Brand Group Inc
CONSUMER NON-DURABLES - Textile - Apparel Footwear
|
$37.20
|
+0.00
0.00% |
$37.64
|
280,483
46.57% of 50 DAV
50 DAV is 602,300
|
$42.47
-12.40%
|
3/7/2014
|
$41.46
|
PP = $40.88
|
|
MB = $42.92
|
Most Recent Note - 4/10/2014 5:24:37 PM
G - Recently violated its 50 DMA line and prior low triggering technical sell signals. A rebound above the 50 DMA line would help its outlook. See the latest FSU analysis for more details with new annotated graphs.
>>> FEATURED STOCK ARTICLE : Violated 50-Day Average and Relative Strength Rank Fell - 4/10/2014
View all notes |
Set NEW NOTE alert |
CANSLIM.net Company Profile |
SEC
News |
Chart |
Request a new note
C
A N
S L
I M
|
PSIX
-
NASDAQ
Power Solutions Intl Inc
Machinery-Gen Industrial
|
$73.50
|
+1.31
1.81% |
$74.20
|
74,479
112.85% of 50 DAV
50 DAV is 66,000
|
$87.40
-15.90%
|
2/28/2014
|
$74.65
|
PP = $76.93
|
|
MB = $80.78
|
Most Recent Note - 4/14/2014 5:53:21 PM
G - Remains below its 50 DMA line after damaging volume-driven losses. The recent low ($66.03 on 4/07/14) defines important near-term support where further deterioration would raise greater concerns. See the latest FSU analysis for more details and new annotated graphs.
>>> FEATURED STOCK ARTICLE : Halted Slide After Slump Below 50-Day Moving Average - 4/14/2014
View all notes |
Set NEW NOTE alert |
CANSLIM.net Company Profile |
SEC
News |
Chart |
Request a new note
C
A N
S L
I M
|
|
|
|
THESE ARE NOT BUY RECOMMENDATIONS!
Comments contained in the body of this report are technical
opinions only. The material herein has been obtained
from sources believed to be reliable and accurate, however,
its accuracy and completeness cannot be guaranteed.
This site is not an investment advisor, hence it does
not endorse or recommend any securities or other investments.
Any recommendation contained in this report may not
be suitable for all investors and it is not to be deemed
an offer or solicitation on our part with respect to
the purchase or sale of any securities. All trademarks,
service marks and trade names appearing in this report
are the property of their respective owners, and are
likewise used for identification purposes only.
This report is a service available
only to active Paid Premium Members.
You may opt-out of receiving report notifications
at any time. Questions or comments may be submitted
by writing to Premium Membership Services 665 S.E. 10 Street, Suite 201 Deerfield Beach, FL 33441-5634 or by calling 1-800-965-8307
or 954-785-1121.
|
|
|

