You are not logged in.
This means you
CAN ONLY VIEW reports that were published prior to Monday, April 14, 2025.
You
MUST UPGRADE YOUR MEMBERSHIP if you want to see any current reports.
AFTER MARKET UPDATE - MONDAY, APRIL 14TH, 2014
Previous After Market Report Next After Market Report >>>
|
|
|
|
DOW |
+146.49 |
16,173.24 |
+0.91% |
|
Volume |
675,862,420 |
-15% |
|
Volume |
1,766,866,460 |
-17% |
|
NASDAQ |
+22.96 |
4,022.69 |
+0.57% |
|
Advancers |
2,012 |
64% |
|
Advancers |
1,509 |
52% |
|
S&P 500 |
+14.92 |
1,830.61 |
+0.82% |
|
Decliners |
1,024 |
32% |
|
Decliners |
1,291 |
45% |
|
Russell 2000 |
+3.92 |
1,115.35 |
+0.35% |
|
52 Wk Highs |
58 |
|
|
52 Wk Highs |
24 |
|
|
S&P 600 |
+3.29 |
646.08 |
+0.51% |
|
52 Wk Lows |
47 |
|
|
52 Wk Lows |
82 |
|
|
 |
Major Averages Rose With Less Volume Conviction
Kenneth J. Gruneisen - Passed the CAN SLIM® Master's Exam
On Monday the major averages rose, however, the volume totals behind the gains were reported lighter on the NYSE and on the Nasdaq exchange. Advancers led decliners by a 2-1 margin on the NYSE and by 7-6 on the Nasdaq exchange. There were 7 high-ranked companies from the CANSLIM.net Leaders List that made new 52-week highs and appeared on the CANSLIM.net BreakOuts Page, up from the total of 5 stocks on the prior session. The list of stocks hitting new 52-week highs outnumbered new lows on the NYSE while new lows outnumbered new 52-week highs on the Nasdaq exchange. There were gains for 3 of the 5 high-ranked companies currently included on the Featured Stocks Page, a list that has grown shorter as numerous leaders have broken down in recent weeks. The Market (M criteria) pullback earned the label of a "correction" as a result of recent pressure on the indices, especially the tech-heavy Nasdaq Composite Index, coupled with waning leadership (fewer stocks hitting new 52-week highs). Investors are reminded to limit losses by always selling any stock that falls more than -7% from their purchase price. This is precisely how the fact-based investment system prompts investors to reduce their overall market exposure during weak periods.
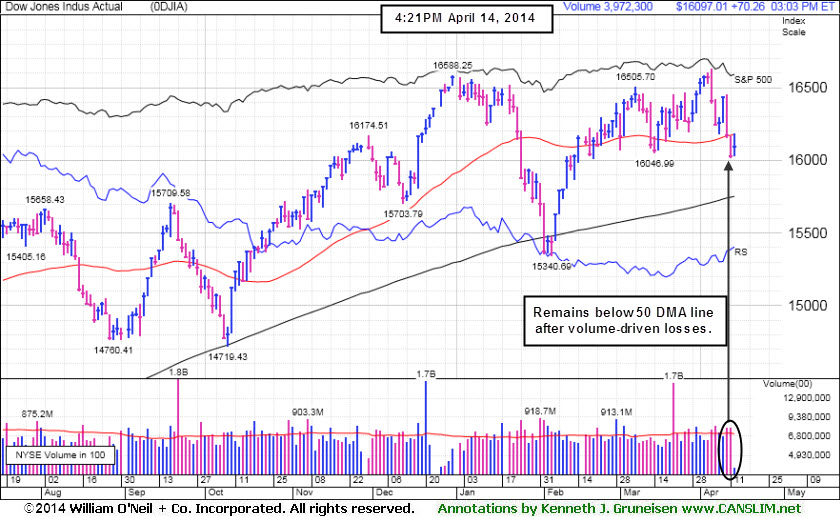
On Monday the Dow was up 146 points to 16,173. The S&P 500 rose 15 points to 1,830. The NASDAQ gained 23 points to close at 4,022. The major averages recovered from last week's retreat following encouraging economic and earnings reports. Before the open, retail sales unexpectedly grew +1.1% in March, its largest increase since 2012. On the earnings front, Citigroup (C +4.36%) climbed after posting quarterly results above analyst projections. The market recovered from an brief pullback in the afternoon attributed to concerns surrounding tension in Ukraine.
All 10 sectors in the S&P 500 were up on the session. Energy and materials were the best performing groups as Chevron (CVX +1.43%) and miner Freeport McMoRan (FCX +2.27%) rose. Over in tech, International Business Machines (IBM +1.32%) and Cisco (CSCO +1.74%) rose. Edward Lifesciences (EW +11%) was up the most in the S&P 500. The heart device maker rallied after a court ruled to limit sales of rival Medtronic's CoreValve system. Medtronic (MDT -1.89%) declined. Intuitive Surgical (ISRG -3.3%) was the worst performing stock in the S&P 500.
Treasuries were lower following the better-than-expected retail sales report. Benchmark 10-year notes fell 6/32 to yield 2.65%.
The CANSLIM.net Featured Stocks Page shows the most action-worthy candidates and their latest notes and a Headline Link directs members to the latest detailed analysis with data-packed graphs annotated by a Certified expert along with links to additional resources. The Premium Member Homepage includes "dynamic archives" to all prior pay reports published. Watch for an announcement via email concerning the next WEBCAST.
PICTURED: The Dow Jones Industrial Average remains below its 50-day moving average (DMA) line after last week's damaging volume-driven losses..
|
 Kenneth J. Gruneisen started out as a licensed stockbroker in August 1987, a couple of months prior to the historic stock market crash that took the Dow Jones Industrial Average down -22.6% in a single day. He has published daily fact-based fundamental and technical analysis on high-ranked stocks online for two decades. Through FACTBASEDINVESTING.COM, Kenneth provides educational articles, news, market commentary, and other information regarding proven investment systems that work in good times and bad.
Comments contained in the body of this report are technical opinions only and are not necessarily those of Gruneisen Growth Corp. The material herein has been obtained from sources believed to be reliable and accurate, however, its accuracy and completeness cannot be guaranteed. Our firm, employees, and customers may effect transactions, including transactions contrary to any recommendation herein, or have positions in the securities mentioned herein or options with respect thereto. Any recommendation contained in this report may not be suitable for all investors and it is not to be deemed an offer or solicitation on our part with respect to the purchase or sale of any securities. |
|
 |
Commodity-Linked Groups, Financial, Retail and Tech Indices Rose
Kenneth J. Gruneisen - Passed the CAN SLIM® Master's Exam
Commodity-linked groups led gainers on Monday as the Gold & Silver Index ($XAU +1.38%), Oil Services Index ($OSX +1.52%), and the Integrated Oil Index ($XOI +1.26%) rose. The Retail Index ($RLX +0.79%) and financial groups had a positive impact on the major averages as the Bank Index ($BKX +0.73%) and the Broker/Dealer Index ($XBD +0.75%) posted gains. The Semiconductor Index ($SOX +0.84%) and Networking Index ($NWX +0.58%) led the tech sector higher, meanwhile the Biotechnology Index ($BTK -0.28%) edged lower.
Charts courtesy www.stockcharts.com
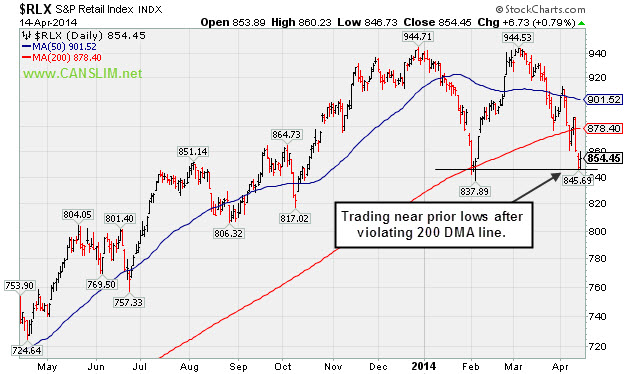
PICTURED: The Retail Index ($RLX +0.79%) is trading near prior lows after recently violating its 200-day moving average (DMA) line.
| Oil Services |
$OSX |
287.81 |
+4.32 |
+1.52% |
+2.41% |
| Integrated Oil |
$XOI |
1,538.61 |
+19.20 |
+1.26% |
+2.36% |
| Semiconductor |
$SOX |
565.02 |
+4.68 |
+0.84% |
+5.61% |
| Networking |
$NWX |
324.83 |
+1.87 |
+0.58% |
+0.27% |
| Broker/Dealer |
$XBD |
147.98 |
+1.11 |
+0.75% |
-7.83% |
| Retail |
$RLX |
854.45 |
+6.73 |
+0.79% |
-9.08% |
| Gold & Silver |
$XAU |
93.83 |
+1.28 |
+1.38% |
+11.50% |
| Bank |
$BKX |
68.59 |
+0.50 |
+0.73% |
-0.97% |
| Biotech |
$BTK |
2,367.69 |
-6.61 |
-0.28% |
+1.60% |
|
|
|
 |
Halted Slide After Slump Below 50-Day Moving Average
Kenneth J. Gruneisen - Passed the CAN SLIM® Master's Exam
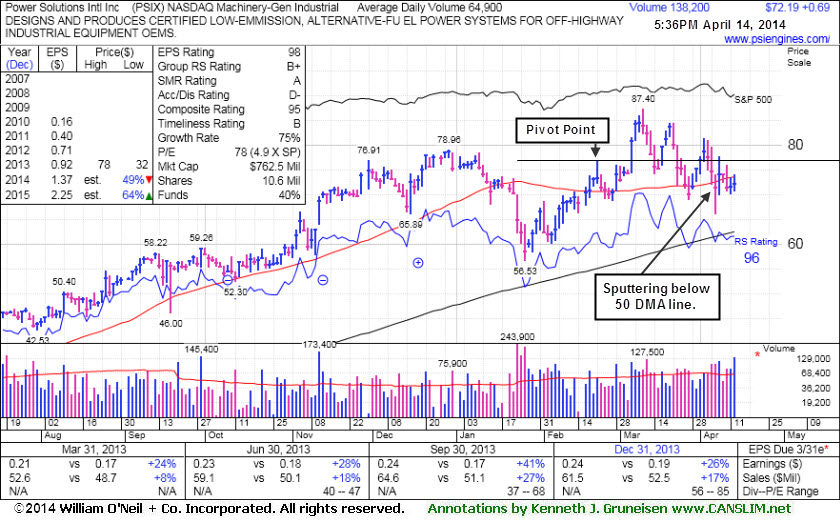
Power Solutions Int'l Inc (PSIX +$0.69 or +0.97% to $72.19) is trading below its 50-day moving average (DMA) line after recent volume-driven losses. Its color code was changed to green. The recent low ($66.03 on 4/07/14) defines important near-term support where further deterioration would raise greater concerns. The high-ranked firm from the Machinery - General Industrial group was last shown in this FSU section on 4/01/14 with annotated graphs under the headline, "Found Prompt Support Near 50-Day Average After Dip Back Into Prior Base". Disciplined investors avoid chasing stocks more than +5% above prior highs and always sell if any stock falls more than -7% from their purchase price.
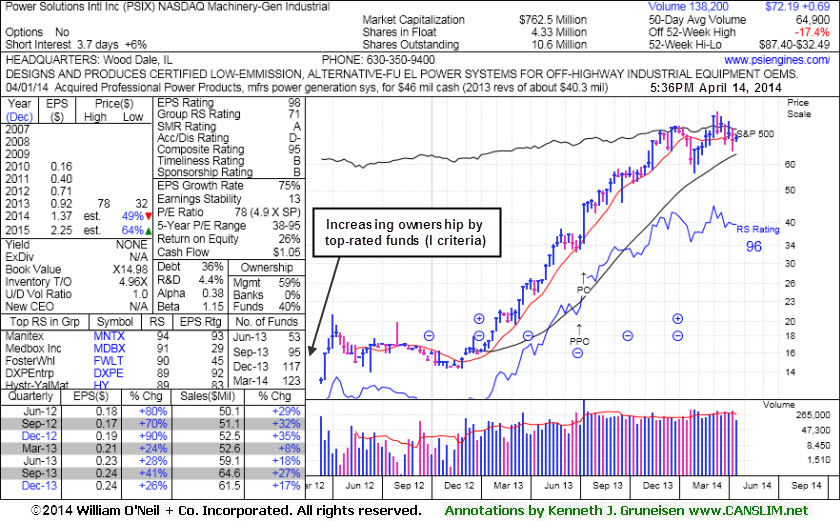
PSIX was highlighted in yellow with a pivot point cited based on its 2/21/14 high in the 2/28/14 mid-day report (read here). It stalled shortly after its 3/06/14 technical breakout, having made only a little headway into new high territory. It reported earnings +26% on +17% sales revenues for the Dec '13 quarter, its 3rd consecutive quarter with earnings above the +25% minimum guideline (C criteria). The number of top-rated funds owning its shares rose from 6 in Mar '13 to 123 in Mar '14, a reassuring trend concerning the I criteria. The small supply of only 4.33 million shares (S criteria) can contribute to greater price volatility in the event of institutional buying or selling. Additional leadership in the Machinery - General Industrial group (L criteria) is reassuring.
|
|
|
Color Codes Explained :
Y - Better candidates highlighted by our
staff of experts.
G - Previously featured
in past reports as yellow but may no longer be buyable under the
guidelines.
***Last / Change / Volume data in this table is the closing quote data***
Symbol/Exchange
Company Name
Industry Group |
PRICE |
CHANGE
(%Change) |
Day High |
Volume
(% DAV)
(% 50 day avg vol) |
52 Wk Hi
% From Hi |
Featured
Date |
Price
Featured |
Pivot Featured |
|
Max Buy |
EQM
-
NYSE
E Q T Midstream Partners
ENERGY - Oil and Gas Pipelines
|
$70.97
|
-0.06
-0.08% |
$73.90
|
115,969
101.73% of 50 DAV
50 DAV is 114,000
|
$73.43
-3.35%
|
12/12/2013
|
$53.17
|
PP = $56.51
|
|
MB = $59.34
|
 Most Recent Note - 4/14/2014 5:56:04 PM
G - Touched a new high today then reversed into the red for a small loss and ended near the session low. Holding its ground and in strong shape, technically, despite fundamental concerns recently noted. Its 50 DMA line defines near-term support where a violation may trigger a technical sell signal.
>>> FEATURED STOCK ARTICLE : Technical Strength Continues Despite Fundamental Concerns - 4/9/2014
View all notes |
Set NEW NOTE alert |
CANSLIM.net Company Profile |
SEC
News |
Chart |
Request a new note
C
A N
S L
I M


|
GNRC
-
NYSE
Generac Hldgs Inc
Electrical-Power/Equipmt
|
$56.32
|
+0.32
0.57% |
$57.53
|
629,473
78.49% of 50 DAV
50 DAV is 802,000
|
$62.50
-9.89%
|
2/14/2014
|
$56.50
|
PP = $57.39
|
|
MB = $60.26
|
Most Recent Note - 4/11/2014 6:09:47 PM
G - Finished just below its 50 DMA line after undercutting prior highs in the $57 area and its color code is changed to green. More damaging losses below its recent low ($55.65 on 4/07/14) would raise greater concerns. See the latest FSU analysis for more details and new annotated graphs.
>>> FEATURED STOCK ARTICLE : Finished Just Below its 50-Day Average Line - 4/11/2014
View all notes |
Set NEW NOTE alert |
CANSLIM.net Company Profile |
SEC
News |
Chart |
Request a new note
C
A N
S L
I M
|
ICON
-
NASDAQ
Iconix Brand Group Inc
CONSUMER NON-DURABLES - Textile - Apparel Footwear
|
$37.20
|
+0.04
0.11% |
$37.72
|
249,513
41.11% of 50 DAV
50 DAV is 607,000
|
$42.47
-12.40%
|
3/7/2014
|
$41.46
|
PP = $40.88
|
|
MB = $42.92
|
Most Recent Note - 4/10/2014 5:24:37 PM
G - Recently violated its 50 DMA line and prior low triggering technical sell signals. A rebound above the 50 DMA line would help its outlook. See the latest FSU analysis for more details with new annotated graphs.
>>> FEATURED STOCK ARTICLE : Violated 50-Day Average and Relative Strength Rank Fell - 4/10/2014
View all notes |
Set NEW NOTE alert |
CANSLIM.net Company Profile |
SEC
News |
Chart |
Request a new note
C
A N
S L
I M
|
PSIX
-
NASDAQ
Power Solutions Intl Inc
Machinery-Gen Industrial
|
$72.19
|
+0.69
0.97% |
$74.03
|
138,290
216.08% of 50 DAV
50 DAV is 64,000
|
$87.40
-17.40%
|
2/28/2014
|
$74.65
|
PP = $76.93
|
|
MB = $80.78
|
Most Recent Note - 4/14/2014 5:53:21 PM
G - Remains below its 50 DMA line after damaging volume-driven losses. The recent low ($66.03 on 4/07/14) defines important near-term support where further deterioration would raise greater concerns. See the latest FSU analysis for more details and new annotated graphs.
>>> FEATURED STOCK ARTICLE : Halted Slide After Slump Below 50-Day Moving Average - 4/14/2014
View all notes |
Set NEW NOTE alert |
CANSLIM.net Company Profile |
SEC
News |
Chart |
Request a new note
C
A N
S L
I M
|
SILC
-
NASDAQ
Silicom Ltd
COMPUTER HARDWARE - Networking andamp; Communication Dev
|
$56.92
|
-1.66
-2.83% |
$58.97
|
46,829
57.11% of 50 DAV
50 DAV is 82,000
|
$73.44
-22.49%
|
12/23/2013
|
$44.62
|
PP = $46.25
|
|
MB = $48.56
|
Most Recent Note - 4/14/2014 5:59:25 PM
Quietly slumped today, finishing the session at its lowest close since its considerable 1/23/14 gap up gain. A rebound above its 50 DMA line is needed to help its outlook improve. It is -22.5% off its 52-week high and will be dropped from the Featured Stocks list tonight.
>>> FEATURED STOCK ARTICLE : Halted Slide Following 50-Day Moving Average Violation - 4/3/2014
View all notes |
Set NEW NOTE alert |
CANSLIM.net Company Profile |
SEC
News |
Chart |
Request a new note
C
A N
S L
I M
|
Symbol/Exchange
Company Name
Industry Group |
PRICE |
CHANGE
(%Change) |
Day High |
Volume
(% DAV)
(% 50 day avg vol) |
52 Wk Hi
% From Hi |
Featured
Date |
Price
Featured |
Pivot Featured |
|
Max Buy |
|
|
|
THESE ARE NOT BUY RECOMMENDATIONS!
Comments contained in the body of this report are technical
opinions only. The material herein has been obtained
from sources believed to be reliable and accurate, however,
its accuracy and completeness cannot be guaranteed.
This site is not an investment advisor, hence it does
not endorse or recommend any securities or other investments.
Any recommendation contained in this report may not
be suitable for all investors and it is not to be deemed
an offer or solicitation on our part with respect to
the purchase or sale of any securities. All trademarks,
service marks and trade names appearing in this report
are the property of their respective owners, and are
likewise used for identification purposes only.
This report is a service available
only to active Paid Premium Members.
You may opt-out of receiving report notifications
at any time. Questions or comments may be submitted
by writing to Premium Membership Services 665 S.E. 10 Street, Suite 201 Deerfield Beach, FL 33441-5634 or by calling 1-800-965-8307
or 954-785-1121.
|
|
|

