***Last / Change / Volume data in this table is the closing quote data***
Symbol/Exchange
Company Name
Industry Group |
PRICE |
CHANGE
(%Change) |
Day High |
Volume
(% DAV)
(% 50 day avg vol) |
52 Wk Hi
% From Hi |
Featured
Date |
Price
Featured |
Pivot Featured |
|
Max Buy |
AIXG
-
NASDAQ
Aixtron Se
ELECTRONICS - Semiconductor Equipment andamp; Mate
|
$41.56
|
-1.59
-3.68% |
$42.25
|
376,678
154.19% of 50 DAV
50 DAV is 244,300
|
$44.96
-7.56%
|
4/5/2011
|
$44.14
|
PP = $44.64
|
|
MB = $46.87
|
 Most Recent Note - 4/14/2011 12:11:42 PM
G - Gapped down today violating its 50 DMA line, raising concerns. Color code is changed to green based on weak action, meanwhile the next support level to watch is prior lows in the $38 area. Only a prompt rebound above its short-term average would help its outlook. As previously noted - "Disciplined investors watch for proof of institutional buying demand and avoid the urge to get in 'early'".
>>> The latest Featured Stock Update with an annotated graph appeared on 4/5/2011. Click here.
View all notes |
Alert me of new notes |
CANSLIM.net Company Profile |
SEC |
Zacks Reports |
StockTalk |
News |
Chart |
Request a new note
C
A N
S L
I M


|
BIDU
-
NASDAQ
Baidu Inc Ads
INTERNET - Internet Information Providers
|
$147.01
|
+1.32
0.91% |
$147.25
|
7,446,582
108.01% of 50 DAV
50 DAV is 6,894,100
|
$148.92
-1.28%
|
3/17/2011
|
$121.97
|
PP = $131.73
|
|
MB = $138.32
|
Most Recent Note - 4/14/2011 12:19:43 PM
G - Holding its ground today after a gain yesterday with above average volume for a best-ever close. It is extended from its latest base, and the prior high near $131 defines initial chart support to watch above its 50 DMA line.
>>> The latest Featured Stock Update with an annotated graph appeared on 4/7/2011. Click here.
View all notes |
Alert me of new notes |
CANSLIM.net Company Profile |
SEC |
Zacks Reports |
StockTalk |
News |
Chart |
Request a new note
C
A N
S L
I M
|
CMG
-
NYSE
Chipotle Mexican Grill
LEISURE - Restaurants
|
$282.91
|
+1.60
0.57% |
$285.97
|
936,219
83.11% of 50 DAV
50 DAV is 1,126,500
|
$282.76
0.05%
|
4/1/2011
|
$274.00
|
PP = $275.10
|
|
MB = $288.86
|
Most Recent Note - 4/13/2011 5:03:09 PM
Y - Up today with average volume for a new all-time high. Gains above its pivot point with well above average volume are still needed to trigger a proper new (or add-on) technical buy signal. It recently stalled after reaching a new all-time high without triggering a new technical buy signal.
>>> The latest Featured Stock Update with an annotated graph appeared on 4/13/2011. Click here.
View all notes |
Alert me of new notes |
CANSLIM.net Company Profile |
SEC |
Zacks Reports |
StockTalk |
News |
Chart |
Request a new note
C
A N
S L
I M
|
CTCT
-
NASDAQ
Constant Contact Inc
MEDIA - Advertising Services
|
$34.29
|
-0.50
-1.44% |
$34.53
|
231,515
54.60% of 50 DAV
50 DAV is 424,000
|
$36.33
-5.62%
|
3/22/2011
|
$33.59
|
PP = $32.49
|
|
MB = $34.11
|
Most Recent Note - 4/14/2011 1:37:42 PM
G - Consolidating near its all-time high with volume totals cooling. Prior highs in the $32 area define support to watch above its 50 DMA line. Due to report earnings after the close on Thursday, April 28th.
>>> The latest Featured Stock Update with an annotated graph appeared on 3/22/2011. Click here.
View all notes |
Alert me of new notes |
CANSLIM.net Company Profile |
SEC |
Zacks Reports |
StockTalk |
News |
Chart |
Request a new note
C
A N
S L
I M
|
CTSH
-
NASDAQ
Cognizant Tech Sol Cl A
COMPUTER SOFTWARE and SERVICES - Business Software and Services
|
$80.78
|
+0.53
0.66% |
$81.03
|
1,870,056
83.93% of 50 DAV
50 DAV is 2,228,100
|
$82.86
-2.51%
|
2/7/2011
|
$75.09
|
PP = $76.46
|
|
MB = $80.28
|
Most Recent Note - 4/14/2011 1:42:45 PM
G - Below average volume trading has continued for the past 3 weeks while it has been consolidating in an orderly fashion above prior highs in the $77-78 area that define chart support to watch above its 50 DMA line. No resistance remains due to overhead supply.
>>> The latest Featured Stock Update with an annotated graph appeared on 3/17/2011. Click here.
View all notes |
Alert me of new notes |
CANSLIM.net Company Profile |
SEC |
Zacks Reports |
StockTalk |
News |
Chart |
Request a new note
C
A N
S L
I M
|
Symbol/Exchange
Company Name
Industry Group |
PRICE |
CHANGE
(%Change) |
Day High |
Volume
(% DAV)
(% 50 day avg vol) |
52 Wk Hi
% From Hi |
Featured
Date |
Price
Featured |
Pivot Featured |
|
Max Buy |
DECK
-
NASDAQ
Deckers Outdoor Corp
CONSUMER NON-DURABLES - Textile - Apparel Footwear
|
$91.74
|
-1.07
-1.15% |
$94.19
|
1,859,827
138.91% of 50 DAV
50 DAV is 1,338,900
|
$94.70
-3.13%
|
2/3/2011
|
$79.61
|
PP = $82.67
|
|
MB = $86.80
|
Most Recent Note - 4/14/2011 12:30:24 PM
G - Testing its all-time high today following a considerable 4/13/11 gain with +57% above average volume for its best-ever close. Finished the prior session 7 cents above the high of the handle on a shorter than minimum length "cup-with-handle" type consolidation. It is clear of resistance due to overhead supply. Its 50 DMA line defines initial chart support to watch.
>>> The latest Featured Stock Update with an annotated graph appeared on 4/6/2011. Click here.
View all notes |
Alert me of new notes |
CANSLIM.net Company Profile |
SEC |
Zacks Reports |
StockTalk |
News |
Chart |
Request a new note
C
A N
S L
I M
|
EZPW
-
NASDAQ
Ezcorp Inc Cl A
SPECIALTY RETAIL - Specialty Retail, Other
|
$28.47
|
+0.11
0.39% |
$28.52
|
249,416
72.44% of 50 DAV
50 DAV is 344,300
|
$33.08
-13.94%
|
2/18/2011
|
$27.94
|
PP = $30.04
|
|
MB = $31.54
|
Most Recent Note - 4/13/2011 4:28:32 PM
G - Down again today with higher volume, slumping further below its 50 DMA line. Damaging losses triggered technical sell signals while it slumped below its prior high closes in the $29-30 area previously noted as important support to watch.
>>> The latest Featured Stock Update with an annotated graph appeared on 4/11/2011. Click here.
View all notes |
Alert me of new notes |
CANSLIM.net Company Profile |
SEC |
Zacks Reports |
StockTalk |
News |
Chart |
Request a new note
C
A N
S L
I M
|
FOSL
-
NASDAQ
Fossil Inc
CONSUMER DURABLES - Recreational Goods, Other
|
$93.64
|
-1.04
-1.09% |
$95.10
|
887,326
89.77% of 50 DAV
50 DAV is 988,400
|
$95.39
-1.84%
|
2/1/2011
|
$73.30
|
PP = $74.44
|
|
MB = $78.16
|
Most Recent Note - 4/13/2011 4:55:47 PM
G - Gain with average volume today for a best-ever close. It has rallied more than +108% higher in 8 months since first featured in yellow in the 8/10/10 mid-day report (read here). It could produce more climactic gains, but recently it has been noted - "Extended from any sound base. Prior highs in the $83-85 area define chart support to watch above its 50 DMA line."
>>> The latest Featured Stock Update with an annotated graph appeared on 3/30/2011. Click here.
View all notes |
Alert me of new notes |
CANSLIM.net Company Profile |
SEC |
Zacks Reports |
StockTalk |
News |
Chart |
Request a new note
C
A N
S L
I M
|
HMSY
-
NASDAQ
H M S Holdings Corp
COMPUTER SOFTWARE and SERVICES - Healthcare Information Service
|
$81.45
|
+0.26
0.32% |
$81.58
|
97,980
61.28% of 50 DAV
50 DAV is 159,900
|
$84.82
-3.97%
|
11/19/2010
|
$61.89
|
PP = $63.01
|
|
MB = $66.16
|
Most Recent Note - 4/14/2011 5:16:42 PM
G - Perched -4.0% below its all-time high with volume totals cooling in recent weeks. It is extended from any sound base pattern. Its 50 DMA line ($77.12 now) defines support to watch on pullbacks.
>>> The latest Featured Stock Update with an annotated graph appeared on 3/25/2011. Click here.
View all notes |
Alert me of new notes |
CANSLIM.net Company Profile |
SEC |
Zacks Reports |
StockTalk |
News |
Chart |
Request a new note
C
A N
S L
I M
|
HS
-
NYSE
Healthspring Inc
HEALTH SERVICES - Health Care Plans
|
$37.91
|
+0.34
0.90% |
$37.97
|
1,166,674
136.82% of 50 DAV
50 DAV is 852,700
|
$40.78
-7.04%
|
3/22/2011
|
$38.29
|
PP = $38.85
|
|
MB = $40.79
|
Most Recent Note - 4/14/2011 5:20:46 PM
Y - It managed a positive reversal today for a gain on higher volume after a small gap down. Its pullback below its pivot point technically negated its 4/01/11 breakout. Its nearby 50 DMA line ($36.49 now) defines important support above recent lows in the $35.50 area.
>>> The latest Featured Stock Update with an annotated graph appeared on 3/23/2011. Click here.
View all notes |
Alert me of new notes |
CANSLIM.net Company Profile |
SEC |
Zacks Reports |
StockTalk |
News |
Chart |
Request a new note
C
A N
S L
I M
|
Symbol/Exchange
Company Name
Industry Group |
PRICE |
CHANGE
(%Change) |
Day High |
Volume
(% DAV)
(% 50 day avg vol) |
52 Wk Hi
% From Hi |
Featured
Date |
Price
Featured |
Pivot Featured |
|
Max Buy |
INFA
-
NASDAQ
Informatica Corp
COMPUTER SOFTWARE and SERVICES - Business Software and Services
|
$53.07
|
-0.27
-0.51% |
$53.95
|
919,261
107.32% of 50 DAV
50 DAV is 856,600
|
$53.50
-0.80%
|
3/24/2011
|
$50.04
|
PP = $49.86
|
|
MB = $52.35
|
Most Recent Note - 4/13/2011 5:08:37 PM
G - Considerable gain today with more than 2 times average volume for a new high. Color code is changed to green after rallying beyond its max buy level. Prior highs in the $49 area define support to watch coinciding with its 50 DMA line. Subsequent violations would raise concerns and may trigger technical sell signals.
>>> The latest Featured Stock Update with an annotated graph appeared on 3/28/2011. Click here.
View all notes |
Alert me of new notes |
CANSLIM.net Company Profile |
SEC |
Zacks Reports |
StockTalk |
News |
Chart |
Request a new note
C
A N
S L
I M
|
LULU
-
NASDAQ
Lululemon Athletica
MANUFACTURING - Textile Manufacturing
|
$92.03
|
-0.09
-0.09% |
$92.38
|
1,461,259
62.98% of 50 DAV
50 DAV is 2,320,100
|
$94.98
-3.11%
|
3/28/2011
|
$68.11
|
PP = $85.38
|
|
MB = $89.65
|
Most Recent Note - 4/13/2011 5:10:36 PM
G - Up today on light volume for its second-best close ever. Prior highs in the $85 area define initial chart support to watch.
>>> The latest Featured Stock Update with an annotated graph appeared on 3/31/2011. Click here.
View all notes |
Alert me of new notes |
CANSLIM.net Company Profile |
SEC |
Zacks Reports |
StockTalk |
News |
Chart |
Request a new note
C
A N
S L
I M
|
MG
-
NYSE
Mistras Group Inc
DIVERSIFIED SERVICES - Bulding and Faci;ity Management Services
|
$17.74
|
+0.66
3.86% |
$18.22
|
188,318
157.19% of 50 DAV
50 DAV is 119,800
|
$17.33
2.37%
|
3/15/2011
|
$15.48
|
PP = $15.90
|
|
MB = $16.70
|
Most Recent Note - 4/14/2011 12:55:52 PM
G - Considerable gap up gain today for a new all-time high, getting more extended from any sound base pattern. Recently reported earnings +200% on +23% sales revenues for the quarter ended February 28, 2011 versus the year-ago period. Its 50 DMA line and prior highs define important support to watch.
>>> The latest Featured Stock Update with an annotated graph appeared on 4/12/2011. Click here.
View all notes |
Alert me of new notes |
CANSLIM.net Company Profile |
SEC |
Zacks Reports |
StockTalk |
News |
Chart |
Request a new note
C
A N
S L
I M
|
MWIV
-
NASDAQ
M W I Veterinary Supply
HEALTH SERVICES - Medical Instruments and; Supplies
|
$79.91
|
+0.71
0.90% |
$80.08
|
73,325
77.51% of 50 DAV
50 DAV is 94,600
|
$80.86
-1.17%
|
11/4/2010
|
$61.79
|
PP = $59.60
|
|
MB = $62.58
|
Most Recent Note - 4/13/2011 5:12:46 PM
G - Wedging higher on light volume this week. Its 50 DMA line defines important support to watch. It has been repeatedly noted - "Extended from any sound base pattern."
>>> The latest Featured Stock Update with an annotated graph appeared on 4/8/2011. Click here.
View all notes |
Alert me of new notes |
CANSLIM.net Company Profile |
SEC |
Zacks Reports |
StockTalk |
News |
Chart |
Request a new note
C
A N
S L
I M
|
OPEN
-
NASDAQ
Opentable Inc
INTERNET - Internet Software and Services
|
$104.74
|
-2.24
-2.09% |
$106.10
|
1,133,632
87.85% of 50 DAV
50 DAV is 1,290,400
|
$112.78
-7.13%
|
3/17/2011
|
$90.71
|
PP = $96.07
|
|
MB = $100.87
|
Most Recent Note - 4/14/2011 1:30:16 PM
G - Small gap down today. Repeatedly noted - "Extended from its latest base. Prior highs near $96 and its 50 DMA line define support to watch on pullbacks.
>>> The latest Featured Stock Update with an annotated graph appeared on 3/24/2011. Click here.
View all notes |
Alert me of new notes |
CANSLIM.net Company Profile |
SEC |
Zacks Reports |
StockTalk |
News |
Chart |
Request a new note
C
A N
S L
I M
|
Symbol/Exchange
Company Name
Industry Group |
PRICE |
CHANGE
(%Change) |
Day High |
Volume
(% DAV)
(% 50 day avg vol) |
52 Wk Hi
% From Hi |
Featured
Date |
Price
Featured |
Pivot Featured |
|
Max Buy |
PAY
-
NYSE
Verifone Systems Inc
COMPUTER HARDWARE - Transaction Automation Systems
|
$54.00
|
-1.29
-2.33% |
$55.14
|
2,228,902
97.70% of 50 DAV
50 DAV is 2,281,400
|
$58.88
-8.29%
|
1/27/2011
|
$41.77
|
PP = $44.97
|
|
MB = $47.22
|
Most Recent Note - 4/14/2011 1:33:11 PM
G - Following a positive reversal on 4/12/11, which was a reassuring sign of support, it is consolidating well above its 50 DMA line ($49.89 now). That short-term average defines important chart support to watch.
>>> The latest Featured Stock Update with an annotated graph appeared on 4/4/2011. Click here.
View all notes |
Alert me of new notes |
CANSLIM.net Company Profile |
SEC |
Zacks Reports |
StockTalk |
News |
Chart |
Request a new note
C
A N
S L
I M
|
PCLN
-
NASDAQ
Priceline.Com Inc
INTERNET - Internet Software and Services
|
$512.65
|
-2.16
-0.42% |
$514.00
|
959,847
80.58% of 50 DAV
50 DAV is 1,191,100
|
$522.00
-1.79%
|
1/3/2011
|
$399.55
|
PP = $428.20
|
|
MB = $449.61
|
Most Recent Note - 4/14/2011 3:43:37 PM
G - It recently stalled after wedging to new 52-week highs without great volume conviction. It as been repeatedly noted - "Extended from any sound base pattern. Its 50 DMA line has defined support throughout its advance."
>>> The latest Featured Stock Update with an annotated graph appeared on 3/21/2011. Click here.
View all notes |
Alert me of new notes |
CANSLIM.net Company Profile |
SEC |
Zacks Reports |
StockTalk |
News |
Chart |
Request a new note
C
A N
S L
I M
|
RAX
-
NYSE
Rackspace Hosting Inc
INTERNET - Internet Software and; Services
|
$41.60
|
-0.15
-0.36% |
$42.00
|
1,238,428
70.17% of 50 DAV
50 DAV is 1,764,800
|
$44.19
-5.86%
|
3/16/2011
|
$36.28
|
PP = $40.72
|
|
MB = $42.76
|
Most Recent Note - 4/14/2011 5:25:21 PM
G - Volume totals have been cooling in the past week while consolidating above prior highs near $40 defining important chart support to watch above its 50 DMA line. The investment system permits investors to accumulate shares on light volume pullbacks, but research has proven that odds are best for a successful trade when buying is done as a stock is moving up in price rather than pulling back.
>>> The latest Featured Stock Update with an annotated graph appeared on 3/16/2011. Click here.
View all notes |
Alert me of new notes |
CANSLIM.net Company Profile |
SEC |
Zacks Reports |
StockTalk |
News |
Chart |
Request a new note
C
A N
S L
I M
|
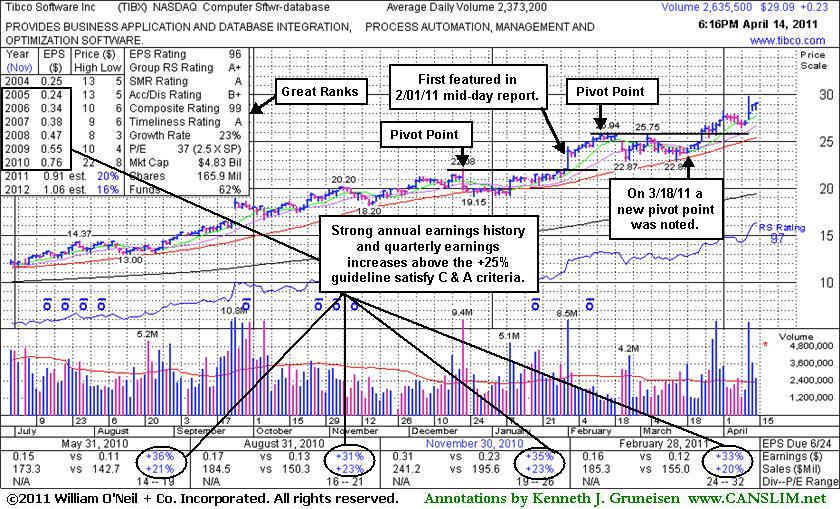
TIBX
-
NASDAQ
Tibco Software Inc
COMPUTER SOFTWARE and SERVICES - Business Software and Services
|
$29.09
|
+0.23
0.80% |
$29.16
|
2,637,172
111.12% of 50 DAV
50 DAV is 2,373,200
|
$29.85
-2.55%
|
3/18/2011
|
$23.88
|
PP = $26.04
|
|
MB = $27.34
|
Most Recent Note - 4/14/2011 6:42:08 PM
G - Finished near the session high for a best-ever close today, getting more extended from a sound base after a spurt of volume-driven gains. Support is defined by prior highs in the $25-26 area and its 50 DMA line. See the latest FSU analysis for more details and a new annotated graph.
>>> The latest Featured Stock Update with an annotated graph appeared on 4/14/2011. Click here.
View all notes |
Alert me of new notes |
CANSLIM.net Company Profile |
SEC |
Zacks Reports |
StockTalk |
News |
Chart |
Request a new note
C
A N
S L
I M
|
UA
-
NYSE
Under Armour Inc Cl A
CONSUMER NON-DURABLES - Textile - Apparel Clothing
|
$73.41
|
-1.55
-2.07% |
$74.83
|
694,969
88.35% of 50 DAV
50 DAV is 786,600
|
$76.85
-4.48%
|
3/31/2011
|
$68.04
|
PP = $70.79
|
|
MB = $74.33
|
Most Recent Note - 4/14/2011 5:12:10 PM
G - Small loss today with lighter than average volume, consolidating below its "max buy" level. The investment system permits investors to accumulate shares on light volume pullbacks, but research has proven that odds are best for a successful trade when buying is done as a stock is moving up in price rather than pulling back No overhead supply remaining to act as resistance. Following its 4/01/11 technical breakout, its prior highs in the $70 area define support to watch.
>>> The latest Featured Stock Update with an annotated graph appeared on 4/1/2011. Click here.
View all notes |
Alert me of new notes |
CANSLIM.net Company Profile |
SEC |
Zacks Reports |
StockTalk |
News |
Chart |
Request a new note
C
A N
S L
I M
|
Symbol/Exchange
Company Name
Industry Group |
PRICE |
CHANGE
(%Change) |
Day High |
Volume
(% DAV)
(% 50 day avg vol) |
52 Wk Hi
% From Hi |
Featured
Date |
Price
Featured |
Pivot Featured |
|
Max Buy |
ULTA
-
NASDAQ
Ulta Salon Cosm & Frag
SPECIALTY RETAIL - Specialty Retail, Other
|
$49.59
|
-0.21
-0.42% |
$50.03
|
555,366
88.90% of 50 DAV
50 DAV is 624,700
|
$51.82
-4.30%
|
1/6/2011
|
$36.12
|
PP = $37.34
|
|
MB = $39.21
|
Most Recent Note - 4/14/2011 5:14:32 PM
G - Quietly consolidating just -4.3% off its all-time high today. It is extended from any sound base. Prior highs and its 50 DMA line define chart support to watch near the $44 level on pullbacks.
>>> The latest Featured Stock Update with an annotated graph appeared on 3/29/2011. Click here.
View all notes |
Alert me of new notes |
CANSLIM.net Company Profile |
SEC |
Zacks Reports |
StockTalk |
News |
Chart |
Request a new note
C
A N
S L
I M
|