***Last / Change / Volume data in this table is the closing quote data***
Symbol/Exchange
Company Name
Industry Group |
PRICE |
CHANGE
(%Change) |
Day High |
Volume
(% DAV)
(% 50 day avg vol) |
52 Wk Hi
% From Hi |
Featured
Date |
Price
Featured |
Pivot Featured |
|
Max Buy |
ACN
-
NYSE
Accenture Plc
DIVERSIFIED SERVICES - Business/Management Services
|
$62.55
|
-1.58
-2.46% |
$63.61
|
4,975,797
156.59% of 50 DAV
50 DAV is 3,177,600
|
$65.89
-5.07%
|
3/23/2012
|
$64.13
|
PP = $63.76
|
|
MB = $66.95
|
 Most Recent Note - 4/13/2012 12:03:02 PM
Y - Gapped down today, and it has been sputtering since triggering a technical buy signal on 3/23/12 with a volume-driven gain. Prior highs in the $62-63 area define initial support to watch above its 50 DMA line.
>>> The latest Featured Stock Update with an annotated graph appeared on 3/23/2012. Click here.
View all notes |
Alert me of new notes |
CANSLIM.net Company Profile |
SEC |
Zacks Reports |
StockTalk |
News |
Chart |
Request a new note
C
A N
S L
I M


|
ADS
-
NYSE
Alliance Data Sys Corp
COMPUTER SOFTWARE and SERVICES - Information and Delivery Service
|
$124.32
|
-0.72
-0.58% |
$125.28
|
467,486
73.11% of 50 DAV
50 DAV is 639,400
|
$127.71
-2.65%
|
1/17/2012
|
$108.24
|
PP = $107.43
|
|
MB = $112.80
|
Most Recent Note - 4/10/2012 6:16:33 PM
G - Pulling back from its all-time high toward its 50 DMA line with today's 4th consecutive loss. Fundamental concerns were raised by earnings reported +9%, well below the +25% minimum guideline in the latest quarter ended December 31, 2011.
>>> The latest Featured Stock Update with an annotated graph appeared on 2/29/2012. Click here.
View all notes |
Alert me of new notes |
CANSLIM.net Company Profile |
SEC |
Zacks Reports |
StockTalk |
News |
Chart |
Request a new note
C
A N
S L
I M
|
ALLT
-
NASDAQ
Allot Communications Ltd
COMPUTER SOFTWARE andamp; SERVICES - Technical andamp; System Software
|
$23.73
|
-0.15
-0.63% |
$24.08
|
239,442
49.86% of 50 DAV
50 DAV is 480,200
|
$24.96
-4.93%
|
3/13/2012
|
$19.72
|
PP = $18.91
|
|
MB = $19.86
|
Most Recent Note - 4/11/2012 12:35:13 PM
G - Up today, and perched near its 52-week high, extended from its prior base. Prior highs near $18-19 define initial support to watch on pullbacks.
>>> The latest Featured Stock Update with an annotated graph appeared on 3/19/2012. Click here.
View all notes |
Alert me of new notes |
CANSLIM.net Company Profile |
SEC |
Zacks Reports |
StockTalk |
News |
Chart |
Request a new note
C
A N
S L
I M
|
ALXN
-
NASDAQ
Alexion Pharmaceuticals
DRUGS - Drug Manufacturers - Other
|
$89.02
|
-1.08
-1.20% |
$90.43
|
811,337
62.77% of 50 DAV
50 DAV is 1,292,600
|
$95.01
-6.30%
|
3/12/2012
|
$87.87
|
PP = $87.73
|
|
MB = $92.12
|
Most Recent Note - 4/10/2012 6:18:12 PM
G - Down today with higher (near average) volume, encountering profit-taking pressure amid widespread market weakness. Support to watch is at its 50 DMA line ($85.73).
>>> The latest Featured Stock Update with an annotated graph appeared on 2/24/2012. Click here.
View all notes |
Alert me of new notes |
CANSLIM.net Company Profile |
SEC |
Zacks Reports |
StockTalk |
News |
Chart |
Request a new note
C
A N
S L
I M
|
BODY
-
NASDAQ
Body Central Corp
RETAIL - Catalog andamp; Mail Order Houses
|
$27.64
|
-0.07
-0.25% |
$27.82
|
100,422
47.26% of 50 DAV
50 DAV is 212,500
|
$29.49
-6.27%
|
1/27/2012
|
$26.69
|
PP = $25.46
|
|
MB = $26.73
|
Most Recent Note - 4/11/2012 4:58:11 PM
G - Promptly rebounded and closed near its 50 DMA line today, an encouraging sign that it was finding support near that important short-term average. Subsequent damaging losses below its recent lows would raise more serious concerns and trigger additional sell signals.
>>> The latest Featured Stock Update with an annotated graph appeared on 3/13/2012. Click here.
View all notes |
Alert me of new notes |
CANSLIM.net Company Profile |
SEC |
Zacks Reports |
StockTalk |
News |
Chart |
Request a new note
C
A N
S L
I M
|
Symbol/Exchange
Company Name
Industry Group |
PRICE |
CHANGE
(%Change) |
Day High |
Volume
(% DAV)
(% 50 day avg vol) |
52 Wk Hi
% From Hi |
Featured
Date |
Price
Featured |
Pivot Featured |
|
Max Buy |
CDNS
-
NASDAQ
Cadence Design Systems
COMPUTER SOFTWARE and SERVICES - Technical and System Software
|
$11.51
|
-0.09
-0.78% |
$11.64
|
2,538,611
79.30% of 50 DAV
50 DAV is 3,201,300
|
$12.60
-8.65%
|
2/3/2012
|
$11.66
|
PP = $11.15
|
|
MB = $11.71
|
Most Recent Note - 4/10/2012 6:10:20 PM
G - Volume was higher (near average) today while slumping further below its 50 DMA line, raising concerns. Finished the session at the prior low ($11.24 on 3/06/12) previously noted as the next important support level to watch.
>>> The latest Featured Stock Update with an annotated graph appeared on 3/28/2012. Click here.
View all notes |
Alert me of new notes |
CANSLIM.net Company Profile |
SEC |
Zacks Reports |
StockTalk |
News |
Chart |
Request a new note
C
A N
S L
I M
|
CELG
-
NASDAQ
Celgene Corp
DRUGS - Drug Manufacturers - Major
|
$78.32
|
-0.26
-0.33% |
$79.47
|
2,749,509
100.59% of 50 DAV
50 DAV is 2,733,500
|
$80.42
-2.61%
|
2/2/2012
|
$74.16
|
PP = $75.21
|
|
MB = $78.97
|
Most Recent Note - 4/11/2012 12:27:37 PM
G - Stubbornly holding its ground after rallying above its "max buy" level. Its 50 DMA line defines support to watch.
>>> The latest Featured Stock Update with an annotated graph appeared on 3/26/2012. Click here.
View all notes |
Alert me of new notes |
CANSLIM.net Company Profile |
SEC |
Zacks Reports |
StockTalk |
News |
Chart |
Request a new note
C
A N
S L
I M
|
COO
-
NYSE
Cooper Companies Inc
HEALTH SERVICES - Medical Instruments and Supplies
|
$82.97
|
-0.66
-0.79% |
$83.49
|
337,738
79.02% of 50 DAV
50 DAV is 427,400
|
$84.20
-1.46%
|
3/9/2012
|
$83.05
|
PP = $81.02
|
|
MB = $85.07
|
Most Recent Note - 4/12/2012 4:27:18 PM
Y - Up today on slightly higher volume, challenging its 52-week high and rising above its pivot point with no resistance remaining. While trading sideways in recent weeks its Relative Strength rating slumped, and now at a mediocre 77, that rating is below the 80+ guideline for buy candidates.
>>> The latest Featured Stock Update with an annotated graph appeared on 3/9/2012. Click here.
View all notes |
Alert me of new notes |
CANSLIM.net Company Profile |
SEC |
Zacks Reports |
StockTalk |
News |
Chart |
Request a new note
C
A N
S L
I M
|
DISH
-
NASDAQ
Dish Network Corp Cl A
CONSUMER DURABLES - Electronic Equipment
|
$31.69
|
-0.32
-0.98% |
$32.03
|
1,205,086
48.01% of 50 DAV
50 DAV is 2,510,000
|
$35.64
-11.08%
|
3/7/2012
|
$30.83
|
PP = $30.10
|
|
MB = $31.61
|
Most Recent Note - 4/10/2012 6:14:18 PM
Y - Down today on below average volume. Color code is changed to yellow while consolidating under its "max buy" level and above prior highs in the $30 area defining initial support to watch on pullbacks.
>>> The latest Featured Stock Update with an annotated graph appeared on 3/14/2012. Click here.
View all notes |
Alert me of new notes |
CANSLIM.net Company Profile |
SEC |
Zacks Reports |
StockTalk |
News |
Chart |
Request a new note
C
A N
S L
I M
|
FEIC
-
NASDAQ
F E I Co
ELECTRONICS - Diversified Electronics
|
$47.12
|
-1.09
-2.26% |
$48.17
|
238,153
74.80% of 50 DAV
50 DAV is 318,400
|
$49.92
-5.61%
|
12/7/2011
|
$41.41
|
PP = $42.35
|
|
MB = $44.47
|
Most Recent Note - 4/13/2012 4:22:09 PM
G - Consolidating above its 50 DMA line, down today with higher (but below average) volume. The latest quarterly report showed +21% earnings for the Dec '11 quarter, below the +25% minimum guideline for earnings growth.
>>> The latest Featured Stock Update with an annotated graph appeared on 3/12/2012. Click here.
View all notes |
Alert me of new notes |
CANSLIM.net Company Profile |
SEC |
Zacks Reports |
StockTalk |
News |
Chart |
Request a new note
C
A N
S L
I M
|
Symbol/Exchange
Company Name
Industry Group |
PRICE |
CHANGE
(%Change) |
Day High |
Volume
(% DAV)
(% 50 day avg vol) |
52 Wk Hi
% From Hi |
Featured
Date |
Price
Featured |
Pivot Featured |
|
Max Buy |
GNC
-
NYSE
G N C Holdings Inc
RETAIL - Drug Stores
|
$33.92
|
-0.75
-2.16% |
$34.77
|
1,213,320
77.69% of 50 DAV
50 DAV is 1,561,700
|
$36.10
-6.04%
|
1/19/2012
|
$28.99
|
PP = $29.60
|
|
MB = $31.08
|
Most Recent Note - 4/13/2012 4:23:46 PM
G - Extended from its prior base and consolidating above its 50 DMA line, important support to watch on pullbacks. It completed Secondary Offerings on 10/25/11 and 3/13/12 after making steady progress following its 4/01/11 IPO.
>>> The latest Featured Stock Update with an annotated graph appeared on 3/5/2012. Click here.
View all notes |
Alert me of new notes |
CANSLIM.net Company Profile |
SEC |
Zacks Reports |
StockTalk |
News |
Chart |
Request a new note
C
A N
S L
I M
|
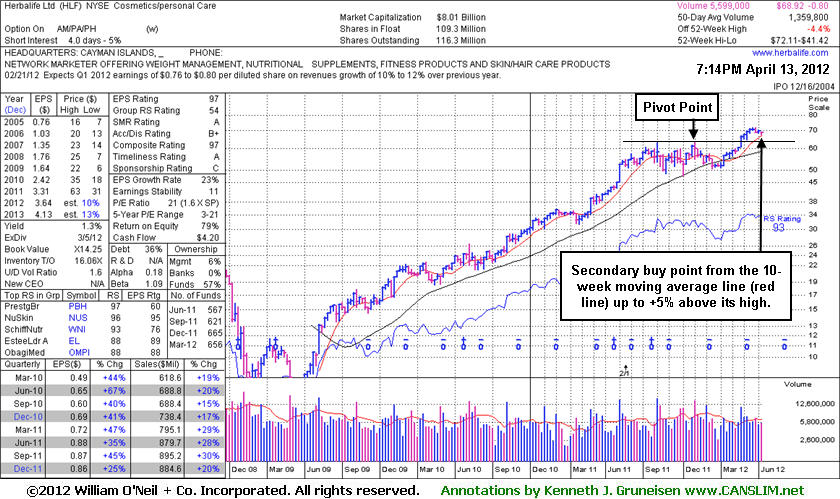
HLF
-
NYSE
Herbalife Ltd
DRUGS - Nutrition and Weight Management
|
$68.92
|
+0.25
0.36% |
$69.07
|
870,574
64.02% of 50 DAV
50 DAV is 1,359,800
|
$72.11
-4.42%
|
2/22/2012
|
$65.90
|
PP = $63.50
|
|
MB = $66.68
|
Most Recent Note - 4/13/2012 7:43:39 PM
G - Hovering only -4.4% off its all-time high today. Its 50 DMA line defines important support to watch on pullbacks. Color code remains green, however a secondary buy point is discussed in the latest FSU analysis with an annotated weekly graph.
>>> The latest Featured Stock Update with an annotated graph appeared on 4/13/2012. Click here.
View all notes |
Alert me of new notes |
CANSLIM.net Company Profile |
SEC |
Zacks Reports |
StockTalk |
News |
Chart |
Request a new note
C
A N
S L
I M
|
ISRG
-
NASDAQ
Intuitive Surgical Inc
HEALTH SERVICES - Medical Appliances and Equipment
|
$546.56
|
-5.03
-0.91% |
$552.68
|
206,201
73.22% of 50 DAV
50 DAV is 281,600
|
$554.13
-1.37%
|
12/20/2011
|
$442.43
|
PP = $449.16
|
|
MB = $471.62
|
Most Recent Note - 4/11/2012 12:33:30 PM
G - Enduring mild distributional pressure but holding its ground following 8 consecutive weekly gains. Extended from any sound base pattern. Previously noted - "The December '11 quarterly earnings increased by just below the borderline +25% minimum guideline for ideal buy candidates."
>>> The latest Featured Stock Update with an annotated graph appeared on 3/1/2012. Click here.
View all notes |
Alert me of new notes |
CANSLIM.net Company Profile |
SEC |
Zacks Reports |
StockTalk |
News |
Chart |
Request a new note
C
A N
S L
I M
|
LULU
-
NASDAQ
Lululemon Athletica
MANUFACTURING - Textile Manufacturing
|
$73.51
|
+0.38
0.52% |
$74.49
|
1,548,918
78.46% of 50 DAV
50 DAV is 1,974,200
|
$77.13
-4.69%
|
1/10/2012
|
$60.97
|
PP = $59.46
|
|
MB = $62.43
|
Most Recent Note - 4/12/2012 6:17:16 PM
G - A damaging loss on Tuesday violated the previously noted upward trendline connecting January-March lows, which may be considered an early sell signal. It may go on to form another base, meanwhile its 50 DMA line defines the next important support level to watch. See the latest FSU analysis for more details and a new annotated graph.
>>> The latest Featured Stock Update with an annotated graph appeared on 4/12/2012. Click here.
View all notes |
Alert me of new notes |
CANSLIM.net Company Profile |
SEC |
Zacks Reports |
StockTalk |
News |
Chart |
Request a new note
C
A N
S L
I M
|
MA
-
NYSE
Mastercard Inc Cl A
DIVERSIFIED SERVICES - Business/Management Services
|
$440.46
|
+6.48
1.49% |
$443.80
|
1,058,150
113.12% of 50 DAV
50 DAV is 935,400
|
$442.88
-0.55%
|
3/12/2012
|
$419.86
|
PP = $428.67
|
|
MB = $450.10
|
Most Recent Note - 4/11/2012 7:06:38 PM
Y - Its gain today with light volume followed distributional action without a fresh sign of institutional buying demand. Its 50 DMA line defines near-term support to watch. See the latest FSU analysis for more details and a new annotated graph.
>>> The latest Featured Stock Update with an annotated graph appeared on 4/11/2012. Click here.
View all notes |
Alert me of new notes |
CANSLIM.net Company Profile |
SEC |
Zacks Reports |
StockTalk |
News |
Chart |
Request a new note
C
A N
S L
I M
|
Symbol/Exchange
Company Name
Industry Group |
PRICE |
CHANGE
(%Change) |
Day High |
Volume
(% DAV)
(% 50 day avg vol) |
52 Wk Hi
% From Hi |
Featured
Date |
Price
Featured |
Pivot Featured |
|
Max Buy |
MELI
-
NASDAQ
Mercadolibre Inc
INTERNET - Internet Software and; Services
|
$96.60
|
-1.00
-1.02% |
$98.11
|
248,133
49.54% of 50 DAV
50 DAV is 500,900
|
$104.50
-7.56%
|
2/6/2012
|
$97.09
|
PP = $95.58
|
|
MB = $100.36
|
Most Recent Note - 4/12/2012 4:21:41 PM
Y - Color code is changed to yellow after a light volume gain today helped it rebound above its 50 DMA line helping its technical stance improve. The recent low ($91.38 on 3/06/12) defines the next important support area to watch.
>>> The latest Featured Stock Update with an annotated graph appeared on 3/29/2012. Click here.
View all notes |
Alert me of new notes |
CANSLIM.net Company Profile |
SEC |
Zacks Reports |
StockTalk |
News |
Chart |
Request a new note
C
A N
S L
I M
|
MG
-
NYSE
Mistras Group Inc
DIVERSIFIED SERVICES - Bulding and Faci;ity Management Services
|
$23.51
|
-0.11
-0.47% |
$23.79
|
51,663
44.50% of 50 DAV
50 DAV is 116,100
|
$26.24
-10.40%
|
3/22/2012
|
$24.96
|
PP = $26.34
|
|
MB = $27.66
|
Most Recent Note - 4/11/2012 12:28:59 PM
G - Finding support near its 50 DMA line. Color code was changed to green, meanwhile gains above its recent chart highs are needed to help its technical stance improve. It has remained below the new pivot point cited in the 3/22/12 mid-day report based on its 52-week high plus 10 cents, not triggering a technical buy signal.
>>> The latest Featured Stock Update with an annotated graph appeared on 4/2/2012. Click here.
View all notes |
Alert me of new notes |
CANSLIM.net Company Profile |
SEC |
Zacks Reports |
StockTalk |
News |
Chart |
Request a new note
C
A N
S L
I M
|
MKTX
-
NASDAQ
Marketaxess Holdings Inc
FINANCIAL SERVICES - Investment Brokerage - Nationa
|
$35.71
|
-0.22
-0.61% |
$36.46
|
282,424
88.98% of 50 DAV
50 DAV is 317,400
|
$37.95
-5.90%
|
3/8/2012
|
$35.80
|
PP = $35.52
|
|
MB = $37.30
|
Most Recent Note - 4/12/2012 12:20:52 PM
G - It has rebounded above its 50 DMA line after today's early losses on heavy volume led to a violation that raised concerns. Color code was changed to green based on its technical deterioration. A weak finish on the session would not bode well, while a strong finish in the upper third of its intra-day range would be an encouraging sign of prompt support.
>>> The latest Featured Stock Update with an annotated graph appeared on 3/8/2012. Click here.
View all notes |
Alert me of new notes |
CANSLIM.net Company Profile |
SEC |
Zacks Reports |
StockTalk |
News |
Chart |
Request a new note
C
A N
S L
I M
|
NTES
-
NASDAQ
Netease.Com Inc Adr
INTERNET - Internet Information Providers
|
$56.98
|
+0.06
0.11% |
$57.43
|
470,410
68.37% of 50 DAV
50 DAV is 688,000
|
$60.47
-5.77%
|
3/19/2012
|
$56.18
|
PP = $55.10
|
|
MB = $57.86
|
Most Recent Note - 4/11/2012 5:03:50 PM
Y - Gapped up today and posted a prompt gain on lighter volume, quickly rebounding near its "max buy" level after dipping near its old highs in the $55 area on the prior session. Subsequent losses may raise greater concerns.
>>> The latest Featured Stock Update with an annotated graph appeared on 3/27/2012. Click here.
View all notes |
Alert me of new notes |
CANSLIM.net Company Profile |
SEC |
Zacks Reports |
StockTalk |
News |
Chart |
Request a new note
C
A N
S L
I M
|
RAX
-
NYSE
Rackspace Hosting Inc
INTERNET - Internet Software and; Services
|
$56.23
|
+0.00
0.00% |
$56.73
|
893,397
42.45% of 50 DAV
50 DAV is 2,104,400
|
$59.43
-5.38%
|
2/2/2012
|
$46.69
|
PP = $45.55
|
|
MB = $47.83
|
Most Recent Note - 4/12/2012 3:23:44 PM
G - Up today with light volume. It remains extended from its prior base, meanwhile its 50 DMA line ($53.87) defines important near-term support to watch. See the latest FSU analysis for more details and a new annotated graph.
>>> The latest Featured Stock Update with an annotated graph appeared on 4/10/2012. Click here.
View all notes |
Alert me of new notes |
CANSLIM.net Company Profile |
SEC |
Zacks Reports |
StockTalk |
News |
Chart |
Request a new note
C
A N
S L
I M
|
Symbol/Exchange
Company Name
Industry Group |
PRICE |
CHANGE
(%Change) |
Day High |
Volume
(% DAV)
(% 50 day avg vol) |
52 Wk Hi
% From Hi |
Featured
Date |
Price
Featured |
Pivot Featured |
|
Max Buy |
RGR
-
NYSE
Sturm Ruger & Co Inc
CONSUMER DURABLES - Sporting Goods
|
$49.75
|
-1.16
-2.28% |
$50.50
|
433,721
119.88% of 50 DAV
50 DAV is 361,800
|
$53.29
-6.64%
|
3/22/2012
|
$46.49
|
PP = $46.78
|
|
MB = $49.12
|
Most Recent Note - 4/12/2012 3:27:02 PM
G - Up again today, rising within close striking distance of its best-ever close. Found prompt support after a pullback near its prior high in the $46 area previously noted as support to watch above its 50 DMA line.
>>> The latest Featured Stock Update with an annotated graph appeared on 3/22/2012. Click here.
View all notes |
Alert me of new notes |
CANSLIM.net Company Profile |
SEC |
Zacks Reports |
StockTalk |
News |
Chart |
Request a new note
C
A N
S L
I M
|
RRTS
-
NYSE
Roadrunner Trans Systems
TRANSPORTATION - Air Delivery and Freight Service
|
$17.33
|
-0.23
-1.31% |
$17.55
|
41,134
30.86% of 50 DAV
50 DAV is 133,300
|
$18.59
-6.78%
|
2/10/2012
|
$17.40
|
PP = $17.50
|
|
MB = $18.38
|
Most Recent Note - 4/11/2012 4:54:13 PM
G - Its rebound above the 50 DMA today indicated that it was finding prompt support, helping its outlook. Subsequent deterioration below the prior low would raise even greater concerns.
>>> The latest Featured Stock Update with an annotated graph appeared on 4/9/2012. Click here.
View all notes |
Alert me of new notes |
CANSLIM.net Company Profile |
SEC |
Zacks Reports |
StockTalk |
News |
Chart |
Request a new note
C
A N
S L
I M
|
SHFL
-
NASDAQ
Shuffle Master Inc
MANUFACTURING - Diversified Machinery
|
$17.00
|
-0.29
-1.68% |
$17.41
|
311,278
46.47% of 50 DAV
50 DAV is 669,900
|
$18.77
-9.43%
|
3/6/2012
|
$17.07
|
PP = $15.25
|
|
MB = $16.01
|
Most Recent Note - 4/11/2012 11:35:52 AM
G - Rebounding today following a slump near its 50 DMA line with 4 consecutive losses since hitting its 52-week high. It is extended from any sound base pattern.
>>> The latest Featured Stock Update with an annotated graph appeared on 3/15/2012. Click here.
View all notes |
Alert me of new notes |
CANSLIM.net Company Profile |
SEC |
Zacks Reports |
StockTalk |
News |
Chart |
Request a new note
C
A N
S L
I M
|
SXCI
-
NASDAQ
S X C Health Solutions
COMPUTER SOFTWARE and SERVICES - Healthcare Information Service
|
$78.53
|
+0.84
1.08% |
$78.76
|
173,411
40.49% of 50 DAV
50 DAV is 428,300
|
$79.26
-0.92%
|
2/23/2012
|
$68.24
|
PP = $66.05
|
|
MB = $69.35
|
Most Recent Note - 4/10/2012 6:23:30 PM
G - Pulled back today with near average volume, consolidating from last week's new 52-week high. Extended from its prior base, its 50 DMA line defines support to watch on pullbacks.
>>> The latest Featured Stock Update with an annotated graph appeared on 3/6/2012. Click here.
View all notes |
Alert me of new notes |
CANSLIM.net Company Profile |
SEC |
Zacks Reports |
StockTalk |
News |
Chart |
Request a new note
C
A N
S L
I M
|
TDG
-
NYSE
Transdigm Group Inc
AEROSPACE/DEFENSE - Aerospace/Defense Products and; Services
|
$116.04
|
-1.02
-0.87% |
$117.14
|
257,703
60.52% of 50 DAV
50 DAV is 425,800
|
$121.48
-4.48%
|
2/29/2012
|
$120.10
|
PP = $118.93
|
|
MB = $124.88
|
Most Recent Note - 4/12/2012 3:34:03 PM
Y - Gains came with light volume as it rebounded above its 50 DMA line helping its outlook improve, and the color code is changed to yellow again. Volume-driven gains for a new high close would be an encouraging sign of fresh institutional buying demand that could lead to a meaningful advance. Meanwhile, deterioration below prior lows ($110.60 on 3/20/12) would trigger a more worrisome technical sell signal.
>>> The latest Featured Stock Update with an annotated graph appeared on 3/30/2012. Click here.
View all notes |
Alert me of new notes |
CANSLIM.net Company Profile |
SEC |
Zacks Reports |
StockTalk |
News |
Chart |
Request a new note
C
A N
S L
I M
|
Symbol/Exchange
Company Name
Industry Group |
PRICE |
CHANGE
(%Change) |
Day High |
Volume
(% DAV)
(% 50 day avg vol) |
52 Wk Hi
% From Hi |
Featured
Date |
Price
Featured |
Pivot Featured |
|
Max Buy |
TIBX
-
NASDAQ
Tibco Software Inc
COMPUTER SOFTWARE and SERVICES - Business Software and Services
|
$33.31
|
+0.45
1.37% |
$33.69
|
2,940,810
117.03% of 50 DAV
50 DAV is 2,512,800
|
$33.42
-0.33%
|
3/30/2012
|
$31.01
|
PP = $31.25
|
|
MB = $32.81
|
Most Recent Note - 4/10/2012 6:26:44 PM
Y - Volume was higher and slightly above average behind today's loss and close below its "max buy" level after trading near its 52-week high. Color code is changed to yellow, however more damaging losses may raise greater concerns. Recent low ($30.03 on 4/02/12) defines a near-term support level to watch above its 50 DMA line.
>>> The latest Featured Stock Update with an annotated graph appeared on 4/5/2012. Click here.
View all notes |
Alert me of new notes |
CANSLIM.net Company Profile |
SEC |
Zacks Reports |
StockTalk |
News |
Chart |
Request a new note
C
A N
S L
I M
|
TNGO
-
NASDAQ
Tangoe Inc
COMPUTER SOFTWARE and SERVICES - Technical and System Software
|
$19.12
|
+0.36
1.92% |
$19.19
|
331,436
52.58% of 50 DAV
50 DAV is 630,400
|
$20.05
-4.64%
|
3/27/2012
|
$19.35
|
PP = $20.00
|
|
MB = $21.00
|
Most Recent Note - 4/12/2012 3:06:12 PM
G - Rebounding to within close striking distance of its 52-week high with light volume behind its gain today. Found prompt support after recent violations of its 50 DMA line triggered technical sell signals following a 3/20/12 Public Offering.
>>> The latest Featured Stock Update with an annotated graph appeared on 4/3/2012. Click here.
View all notes |
Alert me of new notes |
CANSLIM.net Company Profile |
SEC |
Zacks Reports |
StockTalk |
News |
Chart |
Request a new note
C
A N
S L
I M
|
TSCO
-
NASDAQ
Tractor Supply Co
SPECIALTY RETAIL - Specialty Retail, Other
|
$98.38
|
+0.43
0.44% |
$99.33
|
1,681,324
229.25% of 50 DAV
50 DAV is 733,400
|
$98.78
-0.40%
|
1/12/2012
|
$79.12
|
PP = $75.58
|
|
MB = $79.36
|
Most Recent Note - 4/13/2012 12:57:30 PM
G - Up today, adding to the considerable gain on the prior session with heavy volume after the company raised its guidance. Perched at an all-time high, very extended from its prior base. Its 50 DMA line defines support to watch on pullbacks.
>>> The latest Featured Stock Update with an annotated graph appeared on 2/27/2012. Click here.
View all notes |
Alert me of new notes |
CANSLIM.net Company Profile |
SEC |
Zacks Reports |
StockTalk |
News |
Chart |
Request a new note
C
A N
S L
I M
|
UA
-
NYSE
Under Armour Inc Cl A
CONSUMER NON-DURABLES - Textile - Apparel Clothing
|
$96.26
|
+1.18
1.24% |
$96.33
|
591,807
62.00% of 50 DAV
50 DAV is 954,500
|
$99.35
-3.11%
|
2/15/2012
|
$85.77
|
PP = $84.86
|
|
MB = $89.10
|
Most Recent Note - 4/10/2012 6:28:11 PM
G - Down today on higher (near average) volume, slumping toward its 50 DMA line. Prior gains above its pivot point did not have volume sufficient to trigger a proper technical buy signal, and recent losses on higher volume (near average, but above prior session totals) indicate distributional pressure while working on a possible new base-on-base pattern.
>>> The latest Featured Stock Update with an annotated graph appeared on 4/4/2012. Click here.
View all notes |
Alert me of new notes |
CANSLIM.net Company Profile |
SEC |
Zacks Reports |
StockTalk |
News |
Chart |
Request a new note
C
A N
S L
I M
|
UBNT
-
NASDAQ
Ubiquiti Networks Inc
TELECOMMUNICATIONS - Diversified Communication Serv
|
$34.35
|
+0.47
1.39% |
$35.32
|
423,501
117.90% of 50 DAV
50 DAV is 359,200
|
$34.80
-1.29%
|
4/12/2012
|
$33.89
|
PP = $34.07
|
|
MB = $35.77
|
Most Recent Note - 4/12/2012 12:52:50 PM
Y - Hit another new high today. Its color code is changed to yellow with new pivot point cited based on its 3/26/12 high plus 10 cents after forming an advanced "ascending base" pattern marked by 3 pullbacks of 10-20% following its previous breakout. A strong finish may trigger a new (or add-on) technical buy signal.

>>> The latest Featured Stock Update with an annotated graph appeared on 3/21/2012. Click here.
View all notes |
Alert me of new notes |
CANSLIM.net Company Profile |
SEC |
Zacks Reports |
StockTalk |
News |
Chart |
Request a new note
C
A N
S L
I M
|
Symbol/Exchange
Company Name
Industry Group |
PRICE |
CHANGE
(%Change) |
Day High |
Volume
(% DAV)
(% 50 day avg vol) |
52 Wk Hi
% From Hi |
Featured
Date |
Price
Featured |
Pivot Featured |
|
Max Buy |
ULTA
-
NASDAQ
Ulta Salon Cosm & Frag
SPECIALTY RETAIL - Specialty Retail, Other
|
$94.93
|
+0.20
0.21% |
$95.00
|
321,403
46.84% of 50 DAV
50 DAV is 686,100
|
$95.62
-0.72%
|
1/11/2012
|
$71.97
|
PP = $75.80
|
|
MB = $79.59
|
Most Recent Note - 4/10/2012 6:06:19 PM
G - Down today on higher volume, encountering distributional pressure amid widespread market weakness. Its 50 DMA line defines support to watch well above its prior highs in the $75 area. It is extended from any sound base pattern.
>>> The latest Featured Stock Update with an annotated graph appeared on 2/28/2012. Click here.
View all notes |
Alert me of new notes |
CANSLIM.net Company Profile |
SEC |
Zacks Reports |
StockTalk |
News |
Chart |
Request a new note
C
A N
S L
I M
|
V
-
NYSE
Visa Inc Cl A
DIVERSIFIED SERVICES - Business/Management Services
|
$123.16
|
+2.14
1.77% |
$123.68
|
5,374,311
149.77% of 50 DAV
50 DAV is 3,588,400
|
$121.16
1.65%
|
3/12/2012
|
$116.53
|
PP = $119.46
|
|
MB = $125.43
|
Most Recent Note - 4/12/2012 4:25:10 PM
Y - Touched a new all-time high and finished a penny above its best-ever close with a gain on near average volume today. Wedged higher without great volume conviction behind gains in recent weeks. Its 50 DMA line defines support to watch well above prior highs in the $103-104 area.
>>> The latest Featured Stock Update with an annotated graph appeared on 3/7/2012. Click here.
View all notes |
Alert me of new notes |
CANSLIM.net Company Profile |
SEC |
Zacks Reports |
StockTalk |
News |
Chart |
Request a new note
C
A N
S L
I M
|