You are not logged in.
This means you
CAN ONLY VIEW reports that were published prior to Monday, April 14, 2025.
You
MUST UPGRADE YOUR MEMBERSHIP if you want to see any current reports.
AFTER MARKET UPDATE - WEDNESDAY, APRIL 13TH, 2011
Previous After Market Report Next After Market Report >>>
|
|
|
|
DOW |
+7.41 |
12,270.99 |
+0.06% |
|
Volume |
901,118,600 |
-5% |
|
Volume |
1,694,248,010 |
-5% |
|
NASDAQ |
+16.73 |
2,761.52 |
+0.61% |
|
Advancers |
1,377 |
44% |
|
Advancers |
1,325 |
49% |
|
S&P 500 |
+0.25 |
1,314.41 |
+0.02% |
|
Decliners |
1,595 |
51% |
|
Decliners |
1,259 |
46% |
|
Russell 2000 |
+1.65 |
823.92 |
+0.20% |
|
52 Wk Highs |
50 |
|
|
52 Wk Highs |
46 |
|
|
S&P 600 |
-0.25 |
435.59 |
-0.06% |
|
52 Wk Lows |
15 |
|
|
52 Wk Lows |
46 |
|
|
Today we have a question from an observant member concerning the number of new 52-week highs/lows recognized in recent reports. Many members have told us they enjoy the occasional "Ken's Mailbag" included below the FSU table near the bottom of the evening report. These segments share a recent Q&A between CANSLIM.net's founder, Kenneth J. Gruneisen, and a member who has written in with a question concerning our services or a stock they are curious about. Please feel free to submit your questions or any feedback you have for us via the inquiry form - click here.
|
 |
Volume Light As Major Averages Posted Small Gains
Kenneth J. Gruneisen - Passed the CAN SLIM® Master's Exam
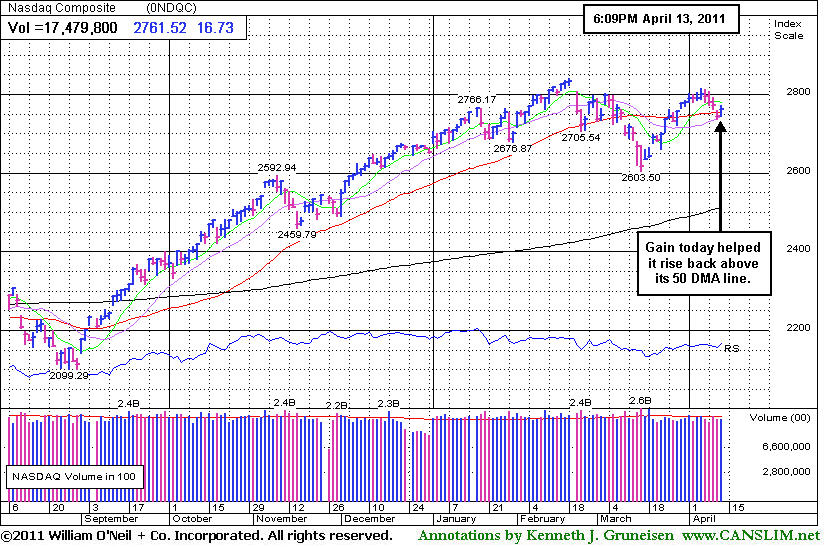
The major stock averages ended a choppy day with moderate gains led by the tech-heavy Nasdaq Composite Index. Lighter volume totals on both major exchanges revealed a lack of serious institutional buying conviction. New 52-week highs outnumbered new 52-week lows on the NYSE, however new 52-week lows and new highs totals on the Nasdaq exchange were evenly matched. There were 21 high-ranked companies from the CANSLIM.net Leaders List that made new 52-week highs and appeared on the CANSLIM.net BreakOuts Page, which was up from the total of 7 on the prior session. On the Featured Stocks Page there were gains from 18 of the 21 high-ranked market leaders currently listed.
A positive start on Wall Street dissolved. A report on March retail sales was a minor disappointment. Sales increased 0.4%, below expectations for a gain of 0.5%. It was still the ninth straight monthly increase, and February results were revised higher. Wholesale inventories at U.S. companies rose less than forecast in February, depressed by a drop among retailers as sales improved. The Federal Reserve published its Beige Book report on regional economic conditions around the country showed some impact on the economy from the Japan crisis, but overall conditions improved at a modest but steady rate.
President Barack Obama outlined a plan to cut the nation's long-term debt, and part of the deficit-reduction plan he brought forth included defense cuts. Lockheed Martin Corp LMT -2.56%) was among the weaker issues in the Aerospace/Defense group. Bank stocks took a further hit when regulators imposed rules forcing the 14 largest mortgage servicers to pay back some botched foreclosures. Dow Jones Industrial Average component JPMorgan Chase & Co (JPM -0.84%) led bank stocks lower even after earnings and revenue beat forecasts. It had to overcome flat loan growth and investor skepticism as its chief executive Jamie Dimon warned that mortgage-related losses will continue to be "extraordinarily high".
Advances in technology stocks offset weak financials. Riverbed Technology Inc (RVBD +12.35%) forecast sales and earnings above expectations and the IT services company's shares jumped back from below its January lows after nearly testing its 200-day moving average (DMA) line.
Keep in mind that earnings announcements are likely to provide a catalyst for increased volatility for the next couple of weeks. Additionally, it should be noted that pundits at the newspaper recognized the current market environment as an "uptrend under pressure" after Tuesday's damaging losses.
PICTURED: The Nasdaq Composite Index's quiet gain helped it rally back above its 50 DMA line.
|
 Kenneth J. Gruneisen started out as a licensed stockbroker in August 1987, a couple of months prior to the historic stock market crash that took the Dow Jones Industrial Average down -22.6% in a single day. He has published daily fact-based fundamental and technical analysis on high-ranked stocks online for two decades. Through FACTBASEDINVESTING.COM, Kenneth provides educational articles, news, market commentary, and other information regarding proven investment systems that work in good times and bad.
Comments contained in the body of this report are technical opinions only and are not necessarily those of Gruneisen Growth Corp. The material herein has been obtained from sources believed to be reliable and accurate, however, its accuracy and completeness cannot be guaranteed. Our firm, employees, and customers may effect transactions, including transactions contrary to any recommendation herein, or have positions in the securities mentioned herein or options with respect thereto. Any recommendation contained in this report may not be suitable for all investors and it is not to be deemed an offer or solicitation on our part with respect to the purchase or sale of any securities. |
|
 |
Financial Groups' Weakness Weighing On Rally
Kenneth J. Gruneisen - Passed the CAN SLIM® Master's Exam
Weakness in the financial groups dragged on the market as the Bank Index ($BKX -1.07%) and Broker/Dealer Index ($XBD -0.45%) lost ground on Wednesday. The in the Gold & Silver Index ($XAU -0.95%) also lost ground and the Healthcare Index ($HMO -0.05%) finished flat. Tech sector leadership boosted the teach-heavy Nasdaq Composite Index as the Biotechnology Index ($BTK +0.74%), Internet Index ($IIX +0.92%), and Networking Index ($NWX +2.01%) easily outpaced the recently struggling Semiconductor Index ($SOX +0.26%). The major averages also benefited from a positive bias in the Retail Index ($RLX +0.24%) and energy-related groups including the Oil Services Index ($OSX +0.39%) and Integrated Oil Index ($XOI +0.09%).
Charts courtesy www.stockcharts.com
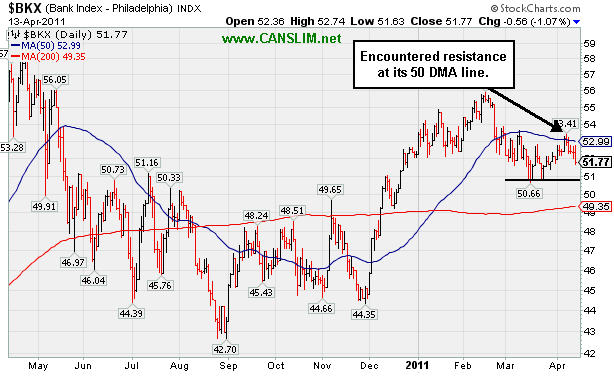
PICTURED: The Bank Index ($BKX -1.07%) recently encountered resistance at its 50-day moving average (DMA) line and is slumping back toward its March lows. Since we recognize the importance of the financial group as a leading indicator for the broader market outlook, subsequent losses to new 2011 lows would not bode well for the rally which is enduring pressure. Meanwhile, gains above the 50 DMA line from this highly influential index could help the rally to gather better upward momentum.
| Oil Services |
$OSX |
280.19 |
+1.08 |
+0.39% |
+14.31% |
| Healthcare |
$HMO |
2,167.15 |
-1.11 |
-0.05% |
+28.08% |
| Integrated Oil |
$XOI |
1,327.40 |
+1.16 |
+0.09% |
+9.42% |
| Semiconductor |
$SOX |
427.89 |
+1.11 |
+0.26% |
+3.90% |
| Networking |
$NWX |
328.10 |
+6.46 |
+2.01% |
+16.94% |
| Internet |
$IIX |
317.58 |
+2.90 |
+0.92% |
+3.20% |
| Broker/Dealer |
$XBD |
119.72 |
-0.54 |
-0.45% |
-1.47% |
| Retail |
$RLX |
527.79 |
+1.25 |
+0.24% |
+3.82% |
| Gold & Silver |
$XAU |
216.67 |
-2.07 |
-0.95% |
-4.37% |
| Bank |
$BKX |
51.77 |
-0.56 |
-1.07% |
-0.84% |
| Biotech |
$BTK |
1,393.31 |
+10.18 |
+0.74% |
+7.37% |
|
|
|
 |
Fresh High Close Lacking Great Volume Conviction
Kenneth J. Gruneisen - Passed the CAN SLIM® Master's Exam
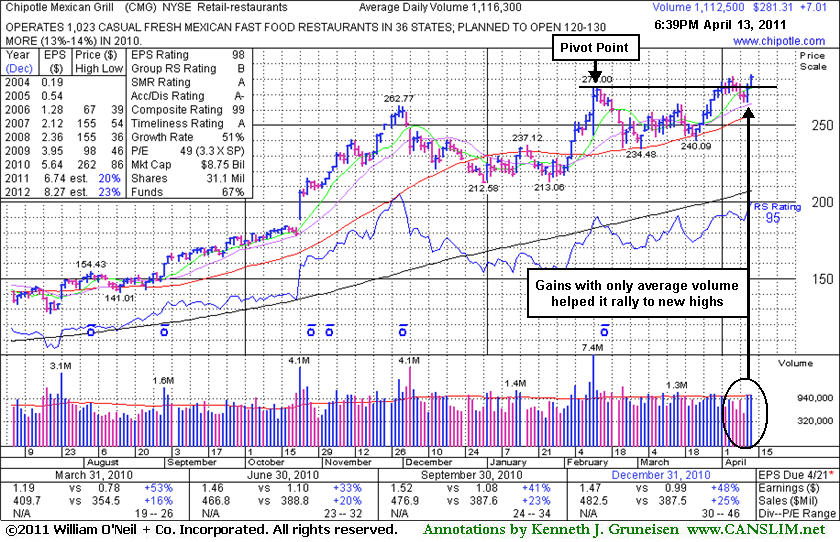
Chipotle Mexican Grill, Inc. (CMG +$7.01 or +2.56% to $281.31) was up today with average volume for a new all-time high. It recently stalled after reaching a new all-time high without triggering a proper new technical buy signal. Disciplined investors know that gains above its pivot point with well above average volume are needed to trigger a proper new (or add-on) technical buy signal.
It could get too extended above prior highs before sufficient volume backs up its gains. Do not be frustrated by that if it ever happens in any strong leader. Know that a truly bullish market environment (M criteria) offers investors many great opportunities to buy stocks within the proper guidelines. Many of the market's best winners gave investors multiple opportunities to buy their shares within the system's guidelines during an ongoing rally. Patience and discipline are critical to your success.
CMG currently has an A- rating for Accumulation/Distribution. Ownership by top-rated funds rose from 530 in Mar '10 to 660 in Dec '10, a nice reassurance concerning the I criteria of the investment system. Sales revenues increases have shown acceleration while up +12%, +16%, +20%, +23%, and now +25% in the streak of latest quarterly comparisons while the C criteria is satisfied by ongoing earnings increases above the +25% guideline. It also has a good annual (A criteria) earnings history.
It eventually formed a new flat base that was noted on 4/01/11 as a new pivot point was cited and its color code was changed to yellow after an orderly 7-week base pattern. It may now look like a cup-with-handle pattern after the latest light volume pullback, but without powerful volume-driven gains it is questionable whether a sustained advance is very likely. Fresh proof of heavy institutional buying demand is usually important, and fact-based investors know that a confirmation of it is worth waiting to see even if that means paying a little higher price. It was last shown in the FSU section on 3/14/11 under the headline, "Correction Also Hurts Stocks With Strong Fundamentals". Subsequent to that appearance, it was a very reassuring sign that it found support above its 50-day moving average (DMA) line and was resilient near prior highs in the $237 area. As previously noted, subsequent violations and damaging losses would have raised greater concerns and triggered more worrisome technical sell signals.
|
|
|
Color Codes Explained :
Y - Better candidates highlighted by our
staff of experts.
G - Previously featured
in past reports as yellow but may no longer be buyable under the
guidelines.
***Last / Change / Volume data in this table is the closing quote data***
Symbol/Exchange
Company Name
Industry Group |
PRICE |
CHANGE
(%Change) |
Day High |
Volume
(% DAV)
(% 50 day avg vol) |
52 Wk Hi
% From Hi |
Featured
Date |
Price
Featured |
Pivot Featured |
|
Max Buy |
AIXG
-
NASDAQ
Aixtron Se
ELECTRONICS - Semiconductor Equipment andamp; Mate
|
$43.15
|
+0.68
1.60% |
$44.04
|
208,228
86.73% of 50 DAV
50 DAV is 240,100
|
$44.96
-4.03%
|
4/5/2011
|
$44.14
|
PP = $44.64
|
|
MB = $46.87
|
 Most Recent Note - 4/13/2011 12:10:37 PM
Y - Gapped up today after finding support near its 50 DMA line. Now perched only -3.9% off its 52-week high with no overhead supply to act as resistance. Volume driven gains above its pivot point may trigger a technical buy signal. Disciplined investors watch for proof of institutional buying demand and avoid the urge to get in "early".
>>> The latest Featured Stock Update with an annotated graph appeared on 4/5/2011. Click here.
View all notes |
Alert me of new notes |
CANSLIM.net Company Profile |
SEC |
Zacks Reports |
StockTalk |
News |
Chart |
Request a new note
C
A N
S L
I M


|
BIDU
-
NASDAQ
Baidu Inc Ads
INTERNET - Internet Information Providers
|
$145.69
|
+4.98
3.54% |
$146.23
|
9,397,297
131.05% of 50 DAV
50 DAV is 7,171,000
|
$148.92
-2.17%
|
3/17/2011
|
$121.97
|
PP = $131.73
|
|
MB = $138.32
|
Most Recent Note - 4/13/2011 4:59:25 PM
G - Gain today with above average volume helped it finish the session one cent above Monday's best-ever close. It is extended from its latest base, and the prior high near $131 defines initial chart support to watch above its 50 DMA line.
>>> The latest Featured Stock Update with an annotated graph appeared on 4/7/2011. Click here.
View all notes |
Alert me of new notes |
CANSLIM.net Company Profile |
SEC |
Zacks Reports |
StockTalk |
News |
Chart |
Request a new note
C
A N
S L
I M
|
CMG
-
NYSE
Chipotle Mexican Grill
LEISURE - Restaurants
|
$281.31
|
+7.01
2.56% |
$282.76
|
1,113,853
100.99% of 50 DAV
50 DAV is 1,102,900
|
$282.00
-0.24%
|
4/1/2011
|
$274.00
|
PP = $275.10
|
|
MB = $288.86
|
Most Recent Note - 4/13/2011 5:03:09 PM
Y - Up today with average volume for a new all-time high. Gains above its pivot point with well above average volume are still needed to trigger a proper new (or add-on) technical buy signal. It recently stalled after reaching a new all-time high without triggering a new technical buy signal.
>>> The latest Featured Stock Update with an annotated graph appeared on 4/13/2011. Click here.
View all notes |
Alert me of new notes |
CANSLIM.net Company Profile |
SEC |
Zacks Reports |
StockTalk |
News |
Chart |
Request a new note
C
A N
S L
I M
|
CTCT
-
NASDAQ
Constant Contact Inc
MEDIA - Advertising Services
|
$34.79
|
+0.39
1.13% |
$35.40
|
188,746
44.42% of 50 DAV
50 DAV is 424,900
|
$36.33
-4.24%
|
3/22/2011
|
$33.59
|
PP = $32.49
|
|
MB = $34.11
|
Most Recent Note - 4/8/2011 6:15:05 PM
G - Holding its ground near its all-time high after enduring distributional pressure this week. Prior highs in the $32 area define support to watch above its 50 DMA line.
>>> The latest Featured Stock Update with an annotated graph appeared on 3/22/2011. Click here.
View all notes |
Alert me of new notes |
CANSLIM.net Company Profile |
SEC |
Zacks Reports |
StockTalk |
News |
Chart |
Request a new note
C
A N
S L
I M
|
CTSH
-
NASDAQ
Cognizant Tech Sol Cl A
COMPUTER SOFTWARE and SERVICES - Business Software and Services
|
$80.25
|
+0.33
0.41% |
$80.76
|
1,492,662
65.97% of 50 DAV
50 DAV is 2,262,500
|
$82.86
-3.15%
|
2/7/2011
|
$75.09
|
PP = $76.46
|
|
MB = $80.28
|
Most Recent Note - 4/8/2011 6:17:31 PM
G - Down today for a 5th consecutive loss on below average volume, consolidating near its "max buy" level above prior highs in the $77-78 area that define chart support to watch above its 50 DMA line. No resistance remains due to overhead supply.
>>> The latest Featured Stock Update with an annotated graph appeared on 3/17/2011. Click here.
View all notes |
Alert me of new notes |
CANSLIM.net Company Profile |
SEC |
Zacks Reports |
StockTalk |
News |
Chart |
Request a new note
C
A N
S L
I M
|
Symbol/Exchange
Company Name
Industry Group |
PRICE |
CHANGE
(%Change) |
Day High |
Volume
(% DAV)
(% 50 day avg vol) |
52 Wk Hi
% From Hi |
Featured
Date |
Price
Featured |
Pivot Featured |
|
Max Buy |
DECK
-
NASDAQ
Deckers Outdoor Corp
CONSUMER NON-DURABLES - Textile - Apparel Footwear
|
$92.80
|
+4.94
5.62% |
$92.99
|
2,075,680
157.51% of 50 DAV
50 DAV is 1,317,800
|
$94.70
-2.01%
|
2/3/2011
|
$79.61
|
PP = $82.67
|
|
MB = $86.80
|
Most Recent Note - 4/13/2011 4:53:51 PM
G - Considerable gain today with +57% above average volume for its best-ever close, finishing near the session high and 7 cents above the high of the handle on a shorter than minimum length "cup-with-handle" type consolidation. It is clear of resistance due to overhead supply. Its 50 DMA line defines initial chart support to watch. See the latest FSU analysis for more details and a new annotated graph.
>>> The latest Featured Stock Update with an annotated graph appeared on 4/6/2011. Click here.
View all notes |
Alert me of new notes |
CANSLIM.net Company Profile |
SEC |
Zacks Reports |
StockTalk |
News |
Chart |
Request a new note
C
A N
S L
I M
|
EZPW
-
NASDAQ
Ezcorp Inc Cl A
SPECIALTY RETAIL - Specialty Retail, Other
|
$28.36
|
-0.62
-2.14% |
$29.12
|
464,286
135.05% of 50 DAV
50 DAV is 343,800
|
$33.08
-14.27%
|
2/18/2011
|
$27.94
|
PP = $30.04
|
|
MB = $31.54
|
Most Recent Note - 4/13/2011 4:28:32 PM
G - Down again today with higher volume, slumping further below its 50 DMA line. Damaging losses triggered technical sell signals while it slumped below its prior high closes in the $29-30 area previously noted as important support to watch.
>>> The latest Featured Stock Update with an annotated graph appeared on 4/11/2011. Click here.
View all notes |
Alert me of new notes |
CANSLIM.net Company Profile |
SEC |
Zacks Reports |
StockTalk |
News |
Chart |
Request a new note
C
A N
S L
I M
|
FOSL
-
NASDAQ
Fossil Inc
CONSUMER DURABLES - Recreational Goods, Other
|
$94.67
|
+2.16
2.33% |
$94.71
|
1,021,066
104.48% of 50 DAV
50 DAV is 977,300
|
$95.39
-0.75%
|
2/1/2011
|
$73.30
|
PP = $74.44
|
|
MB = $78.16
|
Most Recent Note - 4/13/2011 4:55:47 PM
G - Gain with average volume today for a best-ever close. It has rallied more than +108% higher in 8 months since first featured in yellow in the 8/10/10 mid-day report (read here). It could produce more climactic gains, but recently it has been noted - "Extended from any sound base. Prior highs in the $83-85 area define chart support to watch above its 50 DMA line."
>>> The latest Featured Stock Update with an annotated graph appeared on 3/30/2011. Click here.
View all notes |
Alert me of new notes |
CANSLIM.net Company Profile |
SEC |
Zacks Reports |
StockTalk |
News |
Chart |
Request a new note
C
A N
S L
I M
|
HMSY
-
NASDAQ
H M S Holdings Corp
COMPUTER SOFTWARE and SERVICES - Healthcare Information Service
|
$81.19
|
+0.29
0.36% |
$82.20
|
99,700
62.55% of 50 DAV
50 DAV is 159,400
|
$84.82
-4.28%
|
11/19/2010
|
$61.89
|
PP = $63.01
|
|
MB = $66.16
|
Most Recent Note - 4/8/2011 6:23:55 PM
G - Pulling back from its all-time high with a 4th consecutive loss on below average volume. It is extended from any sound base pattern. Its 50 DMA line ($75.83 now) defines support to watch on pullbacks.
>>> The latest Featured Stock Update with an annotated graph appeared on 3/25/2011. Click here.
View all notes |
Alert me of new notes |
CANSLIM.net Company Profile |
SEC |
Zacks Reports |
StockTalk |
News |
Chart |
Request a new note
C
A N
S L
I M
|
HS
-
NYSE
Healthspring Inc
HEALTH SERVICES - Health Care Plans
|
$37.57
|
-0.61
-1.60% |
$38.47
|
1,085,687
130.66% of 50 DAV
50 DAV is 830,900
|
$40.78
-7.87%
|
3/22/2011
|
$38.29
|
PP = $38.85
|
|
MB = $40.79
|
Most Recent Note - 4/13/2011 5:25:17 PM
Y - Down again today on slightly higher volume, raising some concerns while sinking further below its pivot point and closing under prior high closes, technically negating its 4/01/11 breakout. Its nearby 50 DMA line ($36.36 now) defines important support above recent lows in the $35.50 area.
>>> The latest Featured Stock Update with an annotated graph appeared on 3/23/2011. Click here.
View all notes |
Alert me of new notes |
CANSLIM.net Company Profile |
SEC |
Zacks Reports |
StockTalk |
News |
Chart |
Request a new note
C
A N
S L
I M
|
Symbol/Exchange
Company Name
Industry Group |
PRICE |
CHANGE
(%Change) |
Day High |
Volume
(% DAV)
(% 50 day avg vol) |
52 Wk Hi
% From Hi |
Featured
Date |
Price
Featured |
Pivot Featured |
|
Max Buy |
INFA
-
NASDAQ
Informatica Corp
COMPUTER SOFTWARE and SERVICES - Business Software and Services
|
$53.34
|
+1.96
3.81% |
$53.50
|
1,994,465
234.89% of 50 DAV
50 DAV is 849,100
|
$52.96
0.72%
|
3/24/2011
|
$50.04
|
PP = $49.86
|
|
MB = $52.35
|
Most Recent Note - 4/13/2011 5:08:37 PM
G - Considerable gain today with more than 2 times average volume for a new high. Color code is changed to green after rallying beyond its max buy level. Prior highs in the $49 area define support to watch coinciding with its 50 DMA line. Subsequent violations would raise concerns and may trigger technical sell signals.
>>> The latest Featured Stock Update with an annotated graph appeared on 3/28/2011. Click here.
View all notes |
Alert me of new notes |
CANSLIM.net Company Profile |
SEC |
Zacks Reports |
StockTalk |
News |
Chart |
Request a new note
C
A N
S L
I M
|
LULU
-
NASDAQ
Lululemon Athletica
MANUFACTURING - Textile Manufacturing
|
$92.11
|
+2.81
3.15% |
$92.36
|
1,593,002
68.22% of 50 DAV
50 DAV is 2,335,100
|
$94.98
-3.02%
|
3/28/2011
|
$68.11
|
PP = $85.38
|
|
MB = $89.65
|
Most Recent Note - 4/13/2011 5:10:36 PM
G - Up today on light volume for its second-best close ever. Prior highs in the $85 area define initial chart support to watch.
>>> The latest Featured Stock Update with an annotated graph appeared on 3/31/2011. Click here.
View all notes |
Alert me of new notes |
CANSLIM.net Company Profile |
SEC |
Zacks Reports |
StockTalk |
News |
Chart |
Request a new note
C
A N
S L
I M
|
MG
-
NYSE
Mistras Group Inc
DIVERSIFIED SERVICES - Bulding and Faci;ity Management Services
|
$17.08
|
+0.58
3.52% |
$17.24
|
188,619
165.17% of 50 DAV
50 DAV is 114,200
|
$17.33
-1.44%
|
3/15/2011
|
$15.48
|
PP = $15.90
|
|
MB = $16.70
|
Most Recent Note - 4/13/2011 5:11:17 PM
G - Considerable gain today rallying back above its "max buy" level, and its color code was changed to green again. Reported earnings +200% on +23% sales revenues for the quarter ended February 28, 2011 versus the year-ago period. Recently consolidating above prior highs and its 50 DMA line defining important support, and subsequent violations may trigger technical sell signals.
>>> The latest Featured Stock Update with an annotated graph appeared on 4/12/2011. Click here.
View all notes |
Alert me of new notes |
CANSLIM.net Company Profile |
SEC |
Zacks Reports |
StockTalk |
News |
Chart |
Request a new note
C
A N
S L
I M
|
MWIV
-
NASDAQ
M W I Veterinary Supply
HEALTH SERVICES - Medical Instruments and; Supplies
|
$79.20
|
+0.72
0.92% |
$79.95
|
69,069
73.63% of 50 DAV
50 DAV is 93,800
|
$80.86
-2.05%
|
11/4/2010
|
$61.79
|
PP = $59.60
|
|
MB = $62.58
|
Most Recent Note - 4/13/2011 5:12:46 PM
G - Wedging higher on light volume this week. Its 50 DMA line defines important support to watch. It has been repeatedly noted - "Extended from any sound base pattern."
>>> The latest Featured Stock Update with an annotated graph appeared on 4/8/2011. Click here.
View all notes |
Alert me of new notes |
CANSLIM.net Company Profile |
SEC |
Zacks Reports |
StockTalk |
News |
Chart |
Request a new note
C
A N
S L
I M
|
OPEN
-
NASDAQ
Opentable Inc
INTERNET - Internet Software and Services
|
$106.98
|
+0.70
0.66% |
$108.40
|
934,882
72.98% of 50 DAV
50 DAV is 1,281,000
|
$112.78
-5.14%
|
3/17/2011
|
$90.71
|
PP = $96.07
|
|
MB = $100.87
|
Most Recent Note - 4/13/2011 5:14:07 PM
G - Quietly hovering near all-time highs, extended from its latest base. Prior highs near $96 and its 50 DMA line define support to watch on pullbacks.
>>> The latest Featured Stock Update with an annotated graph appeared on 3/24/2011. Click here.
View all notes |
Alert me of new notes |
CANSLIM.net Company Profile |
SEC |
Zacks Reports |
StockTalk |
News |
Chart |
Request a new note
C
A N
S L
I M
|
Symbol/Exchange
Company Name
Industry Group |
PRICE |
CHANGE
(%Change) |
Day High |
Volume
(% DAV)
(% 50 day avg vol) |
52 Wk Hi
% From Hi |
Featured
Date |
Price
Featured |
Pivot Featured |
|
Max Buy |
PAY
-
NYSE
Verifone Systems Inc
COMPUTER HARDWARE - Transaction Automation Systems
|
$55.29
|
+1.27
2.35% |
$55.45
|
2,940,113
133.39% of 50 DAV
50 DAV is 2,204,200
|
$58.88
-6.10%
|
1/27/2011
|
$41.77
|
PP = $44.97
|
|
MB = $47.22
|
Most Recent Note - 4/13/2011 5:16:37 PM
G - Up again today with above average volume following a positive reversal noted on the prior session. Its 50 DMA line ($49.64 now) defines important chart support to watch.
>>> The latest Featured Stock Update with an annotated graph appeared on 4/4/2011. Click here.
View all notes |
Alert me of new notes |
CANSLIM.net Company Profile |
SEC |
Zacks Reports |
StockTalk |
News |
Chart |
Request a new note
C
A N
S L
I M
|
PCLN
-
NASDAQ
Priceline.Com Inc
INTERNET - Internet Software and Services
|
$514.81
|
+2.67
0.52% |
$516.30
|
833,492
70.02% of 50 DAV
50 DAV is 1,190,300
|
$522.00
-1.38%
|
1/3/2011
|
$399.55
|
PP = $428.20
|
|
MB = $449.61
|
Most Recent Note - 4/8/2011 6:37:19 PM
G - Still hovering near its 52-week high with volume totals cooling while it has been noted as extended from any sound base pattern. Its 50 DMA line has defined support throughout its advance.
>>> The latest Featured Stock Update with an annotated graph appeared on 3/21/2011. Click here.
View all notes |
Alert me of new notes |
CANSLIM.net Company Profile |
SEC |
Zacks Reports |
StockTalk |
News |
Chart |
Request a new note
C
A N
S L
I M
|
RAX
-
NYSE
Rackspace Hosting Inc
INTERNET - Internet Software and; Services
|
$41.75
|
+0.71
1.73% |
$42.58
|
1,264,460
71.66% of 50 DAV
50 DAV is 1,764,600
|
$44.19
-5.52%
|
3/16/2011
|
$36.28
|
PP = $40.72
|
|
MB = $42.76
|
Most Recent Note - 4/12/2011 10:27:05 AM
G - Down considerably today, slumping again toward prior highs near $40 defining important chart support to watch above its 50 DMA line.
>>> The latest Featured Stock Update with an annotated graph appeared on 3/16/2011. Click here.
View all notes |
Alert me of new notes |
CANSLIM.net Company Profile |
SEC |
Zacks Reports |
StockTalk |
News |
Chart |
Request a new note
C
A N
S L
I M
|
TIBX
-
NASDAQ
Tibco Software Inc
COMPUTER SOFTWARE and SERVICES - Business Software and Services
|
$28.86
|
+0.81
2.89% |
$28.98
|
3,707,252
155.76% of 50 DAV
50 DAV is 2,380,100
|
$29.85
-3.32%
|
3/18/2011
|
$23.88
|
PP = $26.04
|
|
MB = $27.34
|
Most Recent Note - 4/13/2011 1:15:19 PM
G - Gapped up again today, getting extended from a sound base following a 4/12/11 gap up and gain with heavy volume for a new 52-week high. Found support above prior highs in the $25-26 area during its recent consolidation.
>>> The latest Featured Stock Update with an annotated graph appeared on 3/18/2011. Click here.
View all notes |
Alert me of new notes |
CANSLIM.net Company Profile |
SEC |
Zacks Reports |
StockTalk |
News |
Chart |
Request a new note
C
A N
S L
I M
|
UA
-
NYSE
Under Armour Inc Cl A
CONSUMER NON-DURABLES - Textile - Apparel Clothing
|
$74.96
|
+0.99
1.34% |
$75.09
|
614,393
77.48% of 50 DAV
50 DAV is 793,000
|
$76.85
-2.46%
|
3/31/2011
|
$68.04
|
PP = $70.79
|
|
MB = $74.33
|
Most Recent Note - 4/13/2011 5:20:22 PM
G - Gain today with lighter than average volume led to a close back above its "max buy" level and its color code is changed to green again. No overhead supply remaining to act as resistance. Following its 4/01/11 technical breakout, its prior highs in the $70 area define support to watch.
>>> The latest Featured Stock Update with an annotated graph appeared on 4/1/2011. Click here.
View all notes |
Alert me of new notes |
CANSLIM.net Company Profile |
SEC |
Zacks Reports |
StockTalk |
News |
Chart |
Request a new note
C
A N
S L
I M
|
Symbol/Exchange
Company Name
Industry Group |
PRICE |
CHANGE
(%Change) |
Day High |
Volume
(% DAV)
(% 50 day avg vol) |
52 Wk Hi
% From Hi |
Featured
Date |
Price
Featured |
Pivot Featured |
|
Max Buy |
ULTA
-
NASDAQ
Ulta Salon Cosm & Frag
SPECIALTY RETAIL - Specialty Retail, Other
|
$49.80
|
-0.71
-1.41% |
$50.95
|
441,695
70.26% of 50 DAV
50 DAV is 628,700
|
$51.82
-3.90%
|
1/6/2011
|
$36.12
|
PP = $37.34
|
|
MB = $39.21
|
Most Recent Note - 4/8/2011 6:43:58 PM
G - Touched another new all-time high today before puling back and closing with a small loss on light volume. Extended from any sound base now, its prior highs and its 50 DMA line define chart support to watch near the $44 level on pullbacks.
>>> The latest Featured Stock Update with an annotated graph appeared on 3/29/2011. Click here.
View all notes |
Alert me of new notes |
CANSLIM.net Company Profile |
SEC |
Zacks Reports |
StockTalk |
News |
Chart |
Request a new note
C
A N
S L
I M
|
|
 |
| Subscriber Questions: |
April 12, 2011 |
Greetings Ken and company,
Please note your 4/12/11 comment, "New 52-week highs totals still significantly outnumbered new 52-week lows on the Nasdaq exchange and on the NYSE". This comment appears to contradict your table which indicates 52 wk lows on the Nasdaq were higher than 52 wk highs, 56 to 39 respectively. This is a noteworthy change!! and the casual reader may not realize the importance of this change since it has been quite a while since this has been the case. Happy trades! - Alan |
| Ken's Response: |
April 13, 2011 |
Dear Alan,
My apologies for the mistake in the commentary, while the top table showed it accurately, just as you noted concerning new highs/lows totals. Thanks for pointing that out! We have gone back and corrected the sentence appropriately.
While the new lows list has not become massive, the quick contraction in the new highs totals (which we have observed in past corrections or periods where the ongoing rally has come under pressure) has allowed the new lows totals to suddenly trump new highs once again.
Last month we saw the new lows totals outnumber new highs on a few occasions. As our Thursday March 10th commentary headline read, "Market Dives Into Correction Prompting Investors To Raise Cash", one detail mentioned was that it - "Marked the first time since November 16, 2010 that new 52-week lows outnumbered new 52-week highs on both the NYSE and on the Nasdaq exchange." http://premium.canslim.net/premium/AMR.aspx?D=031011 The market improved since March 16th, which was the last time that we noted the new lows outnumbering new highs on both exchanges. http://premium.canslim.net/premium/amr.aspx?D=031611
Of course, we will watch closely to see (and in my case, accurately summarize) what the market is telling us. Thanks again for your attention to detail and for speaking up when there is ever anything we should correct or improve.
Best regards,

Kenneth J. Gruneisen
Founder & Contributing Writer for CANSLIM.net
www.canslim.net |
|
|
|
THESE ARE NOT BUY RECOMMENDATIONS!
Comments contained in the body of this report are technical
opinions only. The material herein has been obtained
from sources believed to be reliable and accurate, however,
its accuracy and completeness cannot be guaranteed.
This site is not an investment advisor, hence it does
not endorse or recommend any securities or other investments.
Any recommendation contained in this report may not
be suitable for all investors and it is not to be deemed
an offer or solicitation on our part with respect to
the purchase or sale of any securities. All trademarks,
service marks and trade names appearing in this report
are the property of their respective owners, and are
likewise used for identification purposes only.
This report is a service available
only to active Paid Premium Members.
You may opt-out of receiving report notifications
at any time. Questions or comments may be submitted
by writing to Premium Membership Services 665 S.E. 10 Street, Suite 201 Deerfield Beach, FL 33441-5634 or by calling 1-800-965-8307
or 954-785-1121.
|
|
|

