You are not logged in.
This means you
CAN ONLY VIEW reports that were published prior to Monday, April 14, 2025.
You
MUST UPGRADE YOUR MEMBERSHIP if you want to see any current reports.
AFTER MARKET UPDATE - MONDAY, APRIL 12TH, 2010
Previous After Market Report Next After Market Report >>>
|
|
|
|
DOW |
+8.62 |
11,005.97 |
+0.08% |
|
Volume |
973,305,440 |
+1% |
|
Volume |
2,063,450,390 |
-3% |
|
NASDAQ |
+3.82 |
2,457.87 |
+0.16% |
|
Advancers |
1,739 |
55% |
|
Advancers |
1,494 |
52% |
|
S&P 500 |
+2.11 |
1,196.48 |
+0.18% |
|
Decliners |
1,300 |
41% |
|
Decliners |
1,218 |
43% |
|
Russell 2000 |
+1.33 |
705.06 |
+0.19% |
|
52 Wk Highs |
436 |
|
|
52 Wk Highs |
245 |
|
|
S&P 600 |
+0.53 |
373.47 |
+0.14% |
|
52 Wk Lows |
5 |
|
|
52 Wk Lows |
7 |
|
|
 |
Major Averages Inch Up For New Recovery Highs
Adam Sarhan, Contributing Writer,
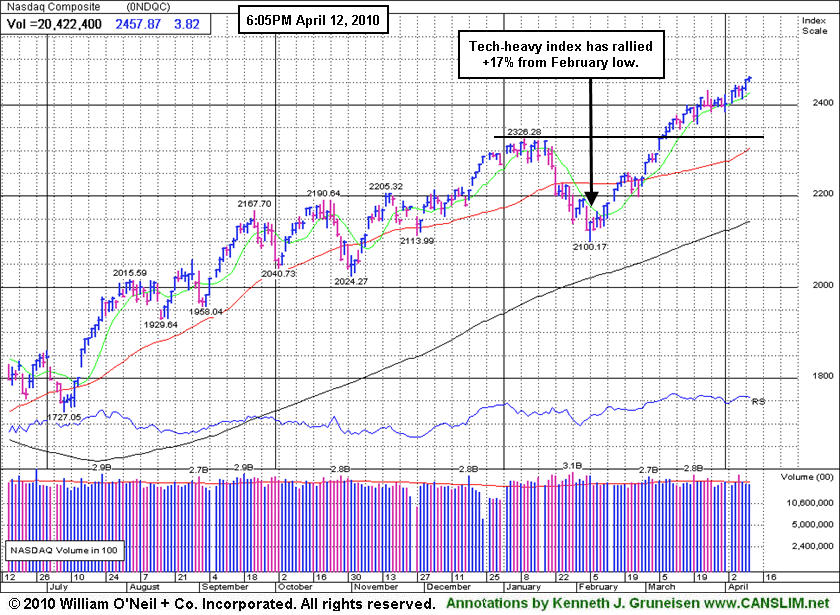
The major averages ended higher after Greece received an international aid pledge to help it get through its worst financial crisis since WWII. Volume totals on the NYSE and on the Nasdaq exchange were reported mixed; slightly lower on the Nasdaq and slightly higher on the NYSE compared to Friday's totals. Breadth was positive as advancers led decliners by almost a 4-to-3 ratio on the NYSE and by a 5-to-4 ratio on the Nasdaq exchange. New 52-week highs trumped new lows on both exchanges yet again. There were 61 high-ranked companies from the CANSLIM.net Leaders List that made a new 52-week high and appeared on the CANSLIM.net BreakOuts Page, higher from the 48 issues that appeared on the prior session. A healthy crop of new leaders making new highs bodes well for any market rally, so the recent expansion in leadership has been a welcome post-holiday improvement.
Over the weekend, Greece received a promise of as much as 45 billion euros ($61 billion) in loans from the euro-region and International Monetary Fund to help the troubled nation remain solvent and avoid a default. The euro surged on the news helping offset some of its recent losses. In the US, the Dow Jones Industrial Average closed above the psychologically important 11,000 level and the S&P 500 approached the 1,200 level, an old floor of support, for the first time since September 2008 (when Lehman failed).
After the close, Alcoa Inc. (AA +1.25%) kicked off Q1 earnings season and reported a narrower Q1 loss, citing improving demand. Analysts believe that combined profit for S&P 500 companies will jump +30% from Q1 2009. Remember that companies will begin reporting Q1 earnings in droves over the next few weeks. It is imperative for investors to pay attention to the results and, just as importantly, how each stock reacts to its earnings news and guidance.
The benchmark S&P 500 Index currently has 5 distribution days while the Nasdaq Composite and Dow Jones Industrial Average have 4 since the March 1, 2010 follow-though-day (FTD). These distribution days have not been damaging, however, as each of the major averages actually ended Monday's session at new recovery highs. Additional distribution days in the near term, however, could raise a more worrisome caution flag.
Don't miss your opportunity to view CANSLIM.net's Q1 2010 Webcast - Available free of charge now to all active StockNews (pay premium) members! The link to access the webcast is posted at the top of the white portion of the Premium Membership Homepage (click here). You may take advantage of the SPRING SPECIAL to reactivate an expired membership, start a new membership, or upgrade from your free membership level so you can access this informative webcast.
PICTURED: The tech-heavy Nasdaq Composite Index has rallied +17% from its February low.
|
|
|
 |
Networking Index Rallies To New Recovery High
Kenneth J. Gruneisen - Passed the CAN SLIM® Master's Exam
Gains from the financial group on Monday helped the major averages inch higher as the Bank Index ($BKX +1.19%) and Broker/Dealer Index ($XBD +0.38%) rose. The Gold & Silver Index ($XAU -1.15%) pulled back and the Biotechnology Index ($BTK -0.65%) suffered a small loss while there was little change for the Oil Services Index ($OSX -0.01%) and Integrated Oil Index ($XOI +0.09%). The Retail Index ($RLX +0.19%) and Healthcare Index ($HMO +0.09%) inched higher. The Semiconductor Index ($SOX +0.85%) and Internet Index ($IIX +0.44%) posted modest gains.
Charts courtesy www.stockcharts.com
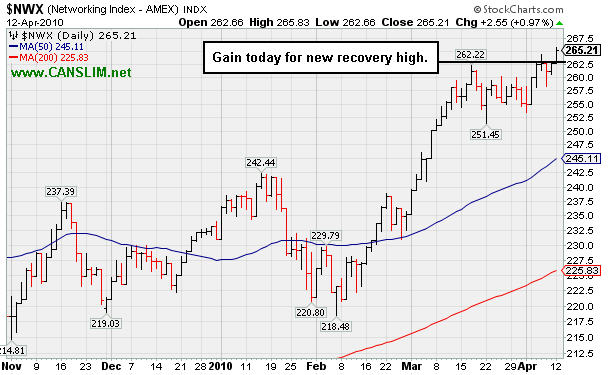
PICTURED: The Networking Index ($NWX +0.97%) led the tech sector indices higher as it posted a gain today for a new recovery high.
| Oil Services |
$OSX |
213.12 |
-0.03 |
-0.01% |
+9.34% |
| Healthcare |
$HMO |
1,544.07 |
+1.33 |
+0.09% |
+4.83% |
| Integrated Oil |
$XOI |
1,120.57 |
+0.97 |
+0.09% |
+4.90% |
| Semiconductor |
$SOX |
378.97 |
+3.21 |
+0.85% |
+5.30% |
| Networking |
$NWX |
265.21 |
+2.56 |
+0.97% |
+14.78% |
| Internet |
$IIX |
255.19 |
+1.11 |
+0.44% |
+9.12% |
| Broker/Dealer |
$XBD |
122.25 |
+0.46 |
+0.38% |
+6.26% |
| Retail |
$RLX |
469.16 |
+0.90 |
+0.19% |
+14.12% |
| Gold & Silver |
$XAU |
174.96 |
-2.04 |
-1.15% |
+3.99% |
| Bank |
$BKX |
55.97 |
+0.66 |
+1.19% |
+31.05% |
| Biotech |
$BTK |
1,238.82 |
-8.11 |
-0.65% |
+31.49% |
|
|
|
 |
Encountered Distributional Pressure Since Bulletin Published
Kenneth J. Gruneisen - Passed the CAN SLIM® Master's Exam
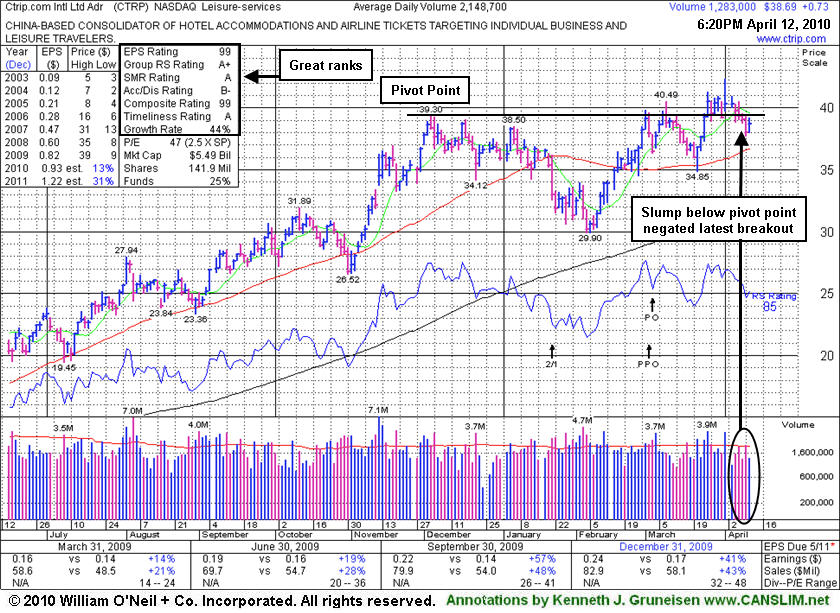
Ctrip.com International, Ltd. (CTRP) posted a gain today on lighter volume, halting a streak of 4 consecutive losses. It stalled and has shown distributional action since 3/25/10 when a detailed Stock Bulletin with annotated graph and expert analysis was published (read here) and it triggered a proper technical buy signal. Its reversal from its high on 4/01/10 was noted as encountered distributional pressure and quickly reversed a large part of its early gain to ultimately close in the lower part of its intra-day range. The subsequent pullback led to a violation of the $39.40 pivot point cited, which had the effect of technically negating its latest breakout, raising concerns. It had rallied on average volume to a new 52-week high when featured in the March 2010 issue of CANSLIM.net News (read here). Meanwhile, the broader market action (M criteria) turned definitively more bullish with a follow-through-day (FTD) and an increase in the number of stocks making it to the Breakouts Page.
There is not any great overhead supply now to act as resistance for CTRP. Ideally, one would like to see significant volume show up behind a gain for a new high close to re-confirm a proper technical buy signal. The company and its subsidiaries provide travel services for hotel accommodations, airline tickets, and packaged tours in China. It also sells independent leisure travelers bundled package-tour products, which include transportation and accommodations, as well as guided tours covering various domestic and international destinations. The company was founded in 1999 and is headquartered in Shanghai, China. The stock resides in the Leisure-Services group which is presently ranked in the much-preferred top quartile of groups, easily satisfying the L criteria. The number of top-rated funds with an ownership interest has grown from 52 funds in Mar '09 to 130 funds as of Dec '09, a sign of increasing institutional interest (the I criteria). It has maintained a strong and steady annual earnings (A criteria) history. Fundamentally, its sales revenues and earnings increases have been strong in the most recent quarterly comparisons, above the +25% guideline (C criteria). Return On Equity is reported at 32%, well above the 17% minimum.
|
|
|
Color Codes Explained :
Y - Better candidates highlighted by our
staff of experts.
G - Previously featured
in past reports as yellow but may no longer be buyable under the
guidelines.
***Last / Change / Volume quote data in this table corresponds with the timestamp on the note***
Symbol/Exchange
Company Name
Industry Group |
Last |
Chg. |
Vol
% DAV |
Date Featured |
Price Featured |
Latest Pivot Point
Featured |
Status |
| Latest Max Buy Price |
ARUN
- NASDAQ
Aruba Networks Inc
COMPUTER HARDWARE - Networking & Communication Dev
|
$13.84
|
+0.22
|
1,577,767
99% DAV
1,600,400
|
2/19/2010
(Date
Featured) |
$12.71
(Price
Featured) |
PP = $11.94 |
G |
| MB = $12.54 |
Most Recent Note - 4/12/2010 4:20:58 PM
G - Finished the session 4 cents under it best ever close with a gain on average volume, perched near its 52-week high. Support to watch is defined by prior chart highs and its 50 DMA line in the upper $11 area.
>>> The latest Featured Stock Update with an annotated graph appeared on 3/31/2010. click here.
|
|
C
A
S
I |
News |
Chart |
SEC
View all notes Alert
me of new notes
Company
Profile
|
BIDU
- NASDAQ
Baidu Inc Ads
INTERNET - Internet Information Providers
|
$626.16
|
+0.69
|
651,623
39% DAV
1,650,000
|
1/13/2010
(Date
Featured) |
$431.25
(Price
Featured) |
PP = $426.75 |
G |
| MB = $448.09 |
Most Recent Note - 4/12/2010
G - Small gain on light volume today, touching and closing at a new all-time high close. It is extended from any sound base after 10 consecutive weekly gains.
>>> The latest Featured Stock Update with an annotated graph appeared on 3/24/2010. click here.
|
|
C
A
S
I |
News |
Chart |
SEC
View all notes Alert
me of new notes
Company
Profile
|
BRLI
- NASDAQ
Bio Reference Labs Inc
HEALTH SERVICES - Medical Laboratories & Researc
|
$45.74
|
+0.15
|
97,074
99% DAV
97,700
|
2/12/2010
(Date
Featured) |
$39.02
(Price
Featured) |
PP = $40.97 |
G |
| MB = $43.02 |
Most Recent Note - 4/12/2010 4:48:13 PM
G - Rallied for a 4th consecutive gain new all-time high today after consolidating for 4 weeks well above its 50 DMA line. Its recent chart low ($42.54 on 3/26/10) is an initial support level to watch near its short-term average.
>>> The latest Featured Stock Update with an annotated graph appeared on 3/22/2010. click here.
|
|
C
A
S
I |
News |
Chart |
SEC
View all notes Alert
me of new notes
Company
Profile
|
CISG
- NASDAQ
Cninsure Inc Ads
INSURANCE - Insurance Brokers
|
$28.31
|
+0.01
|
104,825
45% DAV
233,100
|
3/3/2010
(Date
Featured) |
$24.38
(Price
Featured) |
PP = $23.10 |
G |
| MB = $24.26 |
Most Recent Note - 4/12/2010 4:49:03 PM
G - Quietly held its ground today. Recently noted as "extended from a sound base, yet no overhead supply remains to act as resistance." It has traded up +16% since featured in yellow in the 3/03/10 mid-day report (read here).
>>> The latest Featured Stock Update with an annotated graph appeared on 3/23/2010. click here.
|
|
C
A
S
I |
News |
Chart |
SEC
View all notes Alert
me of new notes
Company
Profile
|
CRM
- NYSE
Salesforce.com Inc
INTERNET - Internet Software & Services
|
$80.51
|
+0.74
|
2,459,429
141% DAV
1,744,600
|
3/5/2010
(Date
Featured) |
$72.28
(Price
Featured) |
PP = $75.53 |
G |
| MB = $79.31 |
Most Recent Note - 4/12/2010 4:50:10 PM
G - Gain today with +40% above average volume for another new all-time high above its "max buy" level. Color code was changed to green. No gain above the latest pivot point came with volume at least +50% above average. It did not trigger a proper technical buy signal within the investment system's guidelines.
>>> The latest Featured Stock Update with an annotated graph appeared on 3/25/2010. click here.
|
|
C
A
S
I |
News |
Chart |
SEC
View all notes Alert
me of new notes
Company
Profile
|
CTRP
- NASDAQ
Ctrip.com Intl Ltd Adr
LEISURE - Resorts & Casinos
|
$38.69
|
+0.73
|
1,284,510
60% DAV
2,148,700
|
3/25/2010
(Date
Featured) |
$40.74
(Price
Featured) |
PP = $39.40 |
Y |
| MB = $41.37 |
Most Recent Note - 4/12/2010 4:54:35 PM
Y - Today's gain on lighter volume halted a streak of 4 consecutive losses. CTRP stalled and showed distributional action since 3/25/10 when a detailed Stock Bulletin with annotated graph and expert analysis was published (read here).
>>> The latest Featured Stock Update with an annotated graph appeared on 4/12/2010. click here.
|
|
C
A
S
I |
News |
Chart |
SEC
View all notes Alert
me of new notes
Company
Profile
|
EZPW
- NASDAQ
Ezcorp Inc Cl A
SPECIALTY RETAIL - Specialty Retail, Other
|
$21.58
|
+0.62
|
345,632
67% DAV
514,300
|
2/19/2010
(Date
Featured) |
$19.03
(Price
Featured) |
PP = $18.80 |
G |
| MB = $19.74 |
Most Recent Note - 4/12/2010 4:56:29 PM
G - Consolidating well above its 50 DMA line and its recent chart low ($19.73 on 3/16/10) that define near-term support. This high-ranked Finance - Consumer/Commercial Loans firm is within close striking distance of its all-time high and has no overhead supply to act as resistance.
>>> The latest Featured Stock Update with an annotated graph appeared on 3/29/2010. click here.
|
|
C
A
S
I |
News |
Chart |
SEC
View all notes Alert
me of new notes
Company
Profile
|
GMCR
- NASDAQ
Green Mtn Coffee Roastrs
FOOD & BEVERAGE - Processed & Packaged Goods
|
$96.11
|
-0.46
|
687,467
61% DAV
1,121,000
|
2/26/2010
(Date
Featured) |
$84.39
(Price
Featured) |
PP = $88.75 |
G |
| MB = $93.19 |
Most Recent Note - 4/12/2010 4:59:17 PM
G - This high-ranked leader is extended from an ideal base and consolidating above the "max buy" level previously cited, stubbornly holding its ground. Support to watch on pullbacks is at prior chart highs and its 50-day moving average (DMA) line now coinciding in the $88 area.
>>> The latest Featured Stock Update with an annotated graph appeared on 4/5/2010. click here.
|
|
C
A
S
I |
News |
Chart |
SEC
View all notes Alert
me of new notes
Company
Profile
|
PCLN
- NASDAQ
Priceline.com Inc
INTERNET - Internet Software & Services
|
$399.55
|
-4.72
|
584,812
N/A
|
11/1/2002
(Date
Featured) |
$399.55
(Price
Featured) |
PP = $428.20 |
Y |
| MB = $449.61 |
Most Recent Note - 1/2/2011
Y - Returns to Featured Stocks list with its appearance in the January 2011 CANSLIM.net News including detailed analysis and annotated daily and weekly graphs.
>>> The latest Featured Stock Update with an annotated graph appeared on 3/30/2010. click here.
|
|
C
A
S
I |
News |
Chart |
SEC
View all notes Alert
me of new notes
Company
Profile
|
PEGA
- NASDAQ
Pegasystems Inc
COMPUTER SOFTWARE & SERVICES - Business Software & Services
|
$37.26
|
-0.05
|
119,674
60% DAV
200,200
|
2/26/2010
(Date
Featured) |
$36.00
(Price
Featured) |
PP = $38.55 |
Y |
| MB = $40.48 |
Most Recent Note - 4/12/2010 5:06:42 PM
Y - Quietly consolidating near support at prior chart highs and just above its 50 DMA line which coincides in the $37 area. Its Relative Strength rank has been slumping while it has failed to follow through with any confirming gains with above average volume since its considerable gap up gain on 3/15/10 triggered a technical buy signal.
>>> The latest Featured Stock Update with an annotated graph appeared on 4/6/2010. click here.
|
|
C
A
S
I |
News |
Chart |
SEC
View all notes Alert
me of new notes
Company
Profile
|
ROVI
- NASDAQ
Rovi Corp
COMPUTER SOFTWARE & SERVICES - Security Software & Services
|
$37.46
|
+0.67
|
1,044,622
77% DAV
1,352,800
|
2/25/2010
(Date
Featured) |
$33.54
(Price
Featured) |
PP = $34.87 |
G |
| MB = $36.61 |
Most Recent Note - 4/12/2010 5:14:30 PM
G - Gain today with higher but still below average volume lifted it above its "max buy" level, and the color code is changed to green. Prior chart highs and its 50 DMA line coinciding in the $34 area define an important support level to watch on pullbacks.
>>> The latest Featured Stock Update with an annotated graph appeared on 4/8/2010. click here.
|
|
C
A
S
I |
News |
Chart |
SEC
View all notes Alert
me of new notes
Company
Profile
|
SIRO
- NASDAQ
Sirona Dental Systems
HEALTH SERVICES - Medical Instruments & Supplies
|
$38.05
|
-0.39
|
335,222
57% DAV
592,400
|
2/16/2010
(Date
Featured) |
$36.43
(Price
Featured) |
PP = $36.15 |
G |
| MB = $37.96 |
Most Recent Note - 4/12/2010 5:15:43 PM
G - Hovering near all-time highs. Prior chart highs and its 50 DMA line in the $36 area define an initial support level to watch.
>>> The latest Featured Stock Update with an annotated graph appeared on 3/26/2010. click here.
|
|
C
A
S
I |
News |
Chart |
SEC
View all notes Alert
me of new notes
Company
Profile
|
ULTA
- NASDAQ
Ulta Salon Cosm & Frag
SPECIALTY RETAIL - Specialty Retail, Other
|
$23.22
|
+0.02
|
745,833
197% DAV
379,200
|
3/12/2010
(Date
Featured) |
$22.81
(Price
Featured) |
PP = $21.72 |
G |
| MB = $22.81 |
Most Recent Note - 4/12/2010 5:18:07 PM
G - Closed near the session low, reversing most of its gain today after reaching a new 52-week high. Above its "max buy" level, recently noted as getting extended from its previous sound base. A detailed Stock Bulletin with annotated graph was published soon after it was featured in the 3/12/10 mid-day report.
>>> The latest Featured Stock Update with an annotated graph appeared on 4/1/2010. click here.
|
|
C
A
S
I |
News |
Chart |
SEC
View all notes Alert
me of new notes
Company
Profile
|
VIT
-
|
$25.14
|
+0.86
|
1,574,498
259% DAV
607,200
|
4/9/2010
(Date
Featured) |
$23.79
(Price
Featured) |
PP = $23.95 |
Y |
| MB = $25.15 |
Most Recent Note - 4/12/2010 5:21:23 PM
Y - Gapped up today for its second consecutive considerable gain and new 52-week high, closing near its "max buy" level. On 4/09/10 it triggered a technical buy signal as a solid gain with heavy volume more than 4 times average helped it trade above its pivot point after a 5-week consolidation. Color code was yellow with new pivot point noted in the 4/09/10 mid-day report (read here).
>>> The latest Featured Stock Update with an annotated graph appeared on 4/9/2010. click here.
|
|
C
A
S
I |
News |
Chart |
SEC
View all notes Alert
me of new notes
Company
Profile
|
VPRT
- NASDAQ
Vistaprint Nv
DIVERSIFIED SERVICES - Business/Management Services
|
$58.61
|
-0.04
|
265,248
64% DAV
413,700
|
3/1/2010
(Date
Featured) |
$57.72
(Price
Featured) |
PP = $59.70 |
G |
| MB = $62.69 |
Most Recent Note - 4/12/2010 5:28:31 PM
G - Still quietly holding its ground just above its 50 DMA line. Distributional action recently pressured it near that short-term average line, raising concerns. Color code was changed to green. It did not trigger a technical buy signal since it was featured in the March 2010 CANSLIM.net News monthly newsletter (read here). As previously noted, "Its gain on 3/02/10 was below the volume guidelines for buyable breakouts under the investment system."
>>> The latest Featured Stock Update with an annotated graph appeared on 3/19/2010. click here.
|
|
C
A
S
I |
News |
Chart |
SEC
View all notes Alert
me of new notes
Company
Profile
|
|
|
|
THESE ARE NOT BUY RECOMMENDATIONS!
Comments contained in the body of this report are technical
opinions only. The material herein has been obtained
from sources believed to be reliable and accurate, however,
its accuracy and completeness cannot be guaranteed.
This site is not an investment advisor, hence it does
not endorse or recommend any securities or other investments.
Any recommendation contained in this report may not
be suitable for all investors and it is not to be deemed
an offer or solicitation on our part with respect to
the purchase or sale of any securities. All trademarks,
service marks and trade names appearing in this report
are the property of their respective owners, and are
likewise used for identification purposes only.
This report is a service available
only to active Paid Premium Members.
You may opt-out of receiving report notifications
at any time. Questions or comments may be submitted
by writing to Premium Membership Services 665 S.E. 10 Street, Suite 201 Deerfield Beach, FL 33441-5634 or by calling 1-800-965-8307
or 954-785-1121.
|
|
|


