You are not logged in.
This means you
CAN ONLY VIEW reports that were published prior to Tuesday, July 9, 2024.
You
MUST UPGRADE YOUR MEMBERSHIP if you want to see any current reports.
AFTER MARKET UPDATE - THURSDAY, APRIL 11TH, 2024
Previous After Market Report Next After Market Report >>>
|
|
|
|
DOW |
-2.43 |
38,459.08 |
-0.01% |
|
Volume |
862,502,831 |
-7% |
|
Volume |
4,812,897,700 |
-10% |
|
NASDAQ |
+271.84 |
16,442.20 |
+1.68% |
|
Advancers |
1,399 |
51% |
|
Advancers |
2,341 |
56% |
|
S&P 500 |
+38.42 |
5,199.06 |
+0.74% |
|
Decliners |
1,347 |
49% |
|
Decliners |
1,867 |
44% |
|
Russell 2000 |
+14.21 |
2,042.60 |
+0.70% |
|
52 Wk Highs |
44 |
|
|
52 Wk Highs |
63 |
|
|
S&P 600 |
+5.92 |
1,290.71 |
+0.46% |
|
52 Wk Lows |
26 |
|
|
52 Wk Lows |
143 |
|
|
Continued distributional action has signaled a shift in (M criteria) conditions from an "uptrend under pressure" to a market "correction". Use greater caution, raise cash and reduce exposure by selling any weakening stocks on a case-by-case basis.
|
 |
Tech Heavy Nasdaq Composite Index Led Major Averages
Kenneth J. Gruneisen - Passed the CAN SLIM® Master's Exam
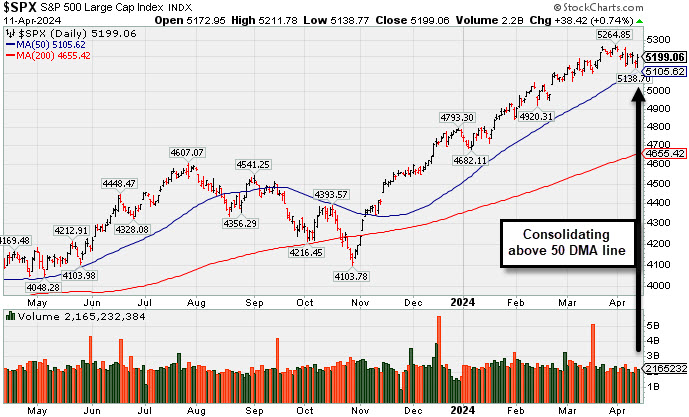
The tech-heavy Nasdaq Composite Index posted a solid +1.68% gain and the benchmark S&P 500 Index rose +0.74%, but the Dow Jones Industrial Average finished flat. Volume reported was lighter than the prior session total on the NYSE and on the Nasdaq exchange. Advancers led decliner by a very narrow margin on the NYSE and by almost a 4-3 margin on the Nasdaq exchange. Leadership improved as there were 19 high-ranked companies from the Leaders List that hit new 52-week highs and were listed on the BreakOuts Page, versus the total of 5 on the prior session. New 52-week highs outnumbered new 52-week lows on the NYSE but new lows outnumbered new highs on the Nasdaq exchange. The major indices have shown distributional action indicative of a market correction (M criteria). Greater caution is important for all investors. Always stand ready to protect against losses.
PICTURED: The S&P 500 Index is consolidating above its 50-day moving average (DMA) line.
The market seemed to be helped by the latest inflation data, which was cooler-than-expected on a month-over-month basis (actual 0.2% versis the expected 0.3%). Total PPI still accelerated to 2.1% in March from 1.6% in February. The 10-yr note yield settled two basis points higher at 4.58% and the 2-yr note yield declined one basis point to 4.96%. There was weak demand for the latest $22 billion 30-yr Treasury bond sale.
Five of the S&P 500 sectors registered gains while six declined. The financials sector was the worst performer, dropping -0.6%, in front of earnings news due tomorrow. A loss in shares of Morgan Stanley (MS -5.25%) came after The Wall Street Journal indicated its wealth unit is being investigated by federal regulators.
|
 Kenneth J. Gruneisen started out as a licensed stockbroker in August 1987, a couple of months prior to the historic stock market crash that took the Dow Jones Industrial Average down -22.6% in a single day. He has published daily fact-based fundamental and technical analysis on high-ranked stocks online for two decades. Through FACTBASEDINVESTING.COM, Kenneth provides educational articles, news, market commentary, and other information regarding proven investment systems that work in good times and bad.
Comments contained in the body of this report are technical opinions only and are not necessarily those of Gruneisen Growth Corp. The material herein has been obtained from sources believed to be reliable and accurate, however, its accuracy and completeness cannot be guaranteed. Our firm, employees, and customers may effect transactions, including transactions contrary to any recommendation herein, or have positions in the securities mentioned herein or options with respect thereto. Any recommendation contained in this report may not be suitable for all investors and it is not to be deemed an offer or solicitation on our part with respect to the purchase or sale of any securities. |
|
 |
Retail, Tech, and Gold & Silver Indexes Rose
Kenneth J. Gruneisen - Passed the CAN SLIM® Master's Exam
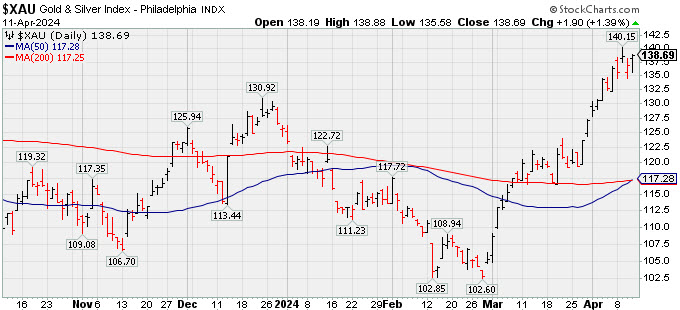
The Broker/Dealer Index ($XBD -0.31%) and the Bank Index ($BKX -0.76%) both lost ground while the Retail Index ($RLX +0.80%) posted a solid gain. The tech sector had a mostly positive bias as the Semiconductor Index ($SOX +2.42%) outpaced the Networking Index ($NWX +0.89%) but the Biotech Index ($BTK -0.21%) ended slightly lower. The Gold & Silver Index ($XAU +1.39%) posted a solid gain while the Integrated Oil Index ($XOI +0.02%) finished flat and the Oil Services Index ($OSX -0.71%) fell.
![]() PICTURED: The Gold & Silver Index ($XAU +1.39%) is consolidating near its 2024 high.
| Oil Services |
$OSX |
93.14 |
-0.66 |
-0.70% |
+11.04% |
| Integrated Oil |
$XOI |
2,248.26 |
+0.50 |
+0.02% |
+20.71% |
| Semiconductor |
$SOX |
4,906.37 |
+116.02 |
+2.42% |
+17.50% |
| Networking |
$NWX |
777.40 |
+6.85 |
+0.89% |
-6.65% |
| Broker/Dealer |
$XBD |
594.09 |
-1.82 |
-0.31% |
+6.60% |
| Retail |
$RLX |
4,521.32 |
+36.09 |
+0.80% |
+16.27% |
| Gold & Silver |
$XAU |
138.69 |
+1.90 |
+1.39% |
+10.34% |
| Bank |
$BKX |
99.54 |
-0.77 |
-0.76% |
+3.66% |
| Biotech |
$BTK |
5,172.43 |
-11.13 |
-0.21% |
-4.55% |
|
|
|
 |
Quietly Consolidating Near 50-Day Moving Average Line
Kenneth J. Gruneisen - Passed the CAN SLIM® Master's Exam
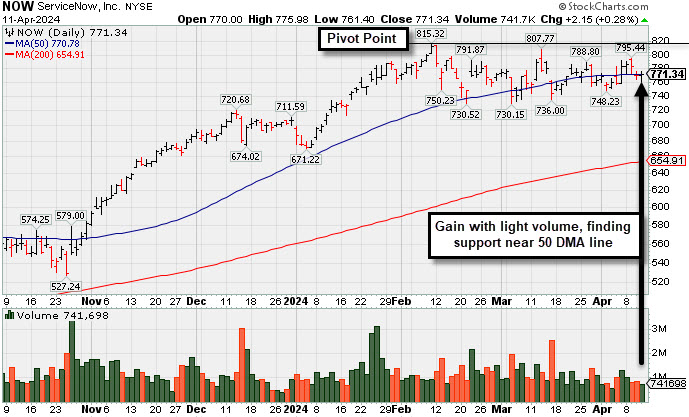
ServiceNow Inc (NOW +$2.15 or +0.28% to $771.34) posted a small gain with light volume, finding support near its 50-day moving average (DMA) line. It remains perched within striking distance of its pivot point cited based on its 2/09/24 high. Recent lows define important near-term support to watch where more damaging losses would raise greater concerns.
The Computer Software - Enterprise group is currently ranked 61st on the 197 Industry Groups list with a Group Relative Strength Rating of B+ (69). NOW was highlighted in yellow in the 2/22/24 mid-day report (read here). It was last shown in this FSU section on 3/20/24 with an annotated graph under the headline, "NOW Quietly Rebounded Above 50-Day Moving Average Line".
NOW has a 99 Earnings Per Share Rating. It reported Dec '23 quarterly earnings +36% on +26% sales revenues versus the year-ago period, its 6th quarterly comparison above the +25% minimum guideline (C criteria) of the fact-based investment system. Annual earnings growth has been strong and steady.
The number of top-rated funds owning its shares rose from 3,287 in Mar '23 to 3,864 in Mar '24, a reassuring sign concerning the I criteria. It has a Timeliness Rating of A and a Sponsorship Rating of B. Its current Up/Down Volume Ratio of 1.2 is an unbiased indication its shares have been under slight accumulation over the past 50 days. |
|
|
Color Codes Explained :
Y - Better candidates highlighted by our
staff of experts.
G - Previously featured
in past reports as yellow but may no longer be buyable under the
guidelines.
***Last / Change / Volume data in this table is the closing quote data***
Symbol/Exchange
Company Name
Industry Group |
PRICE |
CHANGE
(%Change) |
Day High |
Volume
(% DAV)
(% 50 day avg vol) |
52 Wk Hi
% From Hi |
Featured
Date |
Price
Featured |
Pivot Featured |
|
Max Buy |
 ANET
-
NYSE
ANET
-
NYSE
Arista Networks
Computer-Networking
|
$296.58
|
+8.36
2.90% |
$297.67
|
1,501,356
55.54% of 50 DAV
50 DAV is 2,703,000
|
$307.74
-3.63%
|
3/18/2024
|
$188.84
|
PP = $292.76
|
|
MB = $307.40
|
 Most Recent Note - 4/11/2024 5:28:22 PM
Y - Posted another gain today with light volume, still hovering near its all-time high. Found support near prior highs in the $292 area. Additional near-term support to watch is its 50 DMA line ($281) and an upward trendline connecting its October-March lows.
>>> FEATURED STOCK ARTICLE : Consolidating Abover Recent Highs and Above 50-Day Average - 3/26/2024 |
View all notes |
Set NEW NOTE alert |
Company Profile |
SEC
News |
Chart |
Request a new note
C
A
S
I |
NVO
-
NYSE
Novo Nordisk ADR
Medical-Ethical Drugs
|
$125.40
|
+0.47
0.38% |
$125.88
|
2,417,042
44.74% of 50 DAV
50 DAV is 5,403,000
|
$138.28
-9.31%
|
3/1/2024
|
$124.23
|
PP = $124.97
|
|
MB = $131.22
|
Most Recent Note - 4/8/2024 5:19:16 PM
Y - Posted a gain today with lighter volume. Quietly pulling back below the pivot point of the previously noted "3-weeks tight" base and testing its 50 DMA line ($124.30) which defines important near-term support.
>>> FEATURED STOCK ARTICLE : Volume Cools While Consolidating Above 50-Day Moving Average Line - 4/3/2024 |
View all notes |
Set NEW NOTE alert |
Company Profile |
SEC
News |
Chart |
Request a new note
C
A
S
I |
AXON
-
NASDAQ
Axon Enterprise
Security/Sfty
|
$324.06
|
+5.80
1.82% |
$329.87
|
698,917
139.78% of 50 DAV
50 DAV is 500,000
|
$325.63
-0.48%
|
4/5/2024
|
$309.90
|
PP = $325.73
|
|
MB = $342.02
|
Most Recent Note - 4/8/2024 5:17:45 PM
Y - Color code was changed to yellow with new pivot point cited based on its 3/04/24 high plus 10 cents. Volume totals have been cooling while hovering in a tight range near its all-time high. Volume-driven gains above the pivot point are needed to trigger a proper technical buy signal. Its 50-day moving average (DMA) line ($291) defines near-term support to watch. Fundamentals remain strong. See the latest FSU analysis for more details and a new annotated graph.
>>> FEATURED STOCK ARTICLE : Volume Totals Cooling While Building a New Base - 4/8/2024 |
View all notes |
Set NEW NOTE alert |
Company Profile |
SEC
News |
Chart |
Request a new note
C
A
S
I |
TDG
-
NYSE
TransDigm Group
Aerospace/Defense
|
$1,234.93
|
+15.02
1.23% |
$1,237.51
|
179,250
84.15% of 50 DAV
50 DAV is 213,000
|
$1,246.22
-0.91%
|
12/12/2023
|
$1,000.39
|
PP = $1,013.18
|
|
MB = $1,063.84
|
Most Recent Note - 4/9/2024 5:23:10 PM
G - Holding its ground following a noted "negative reversal" on 4/04/24 after touching a new all-time high. Its 50 DMA line ($1,173) defines near-term support to watch. See the latest FSU analysis for more details and a new annotated graph.
>>> FEATURED STOCK ARTICLE : Volume Totals Cooling While Perched Near High - 4/9/2024 |
View all notes |
Set NEW NOTE alert |
Company Profile |
SEC
News |
Chart |
Request a new note
C
A
S
I |
CRWD
-
NASDAQ
CrowdStrike Holdings
Computer Sftwr-Security
|
$317.88
|
+5.35
1.71% |
$317.91
|
1,845,759
48.03% of 50 DAV
50 DAV is 3,843,000
|
$365.00
-12.91%
|
1/2/2024
|
$246.42
|
PP = $261.91
|
|
MB = $275.01
|
Most Recent Note - 4/8/2024 5:24:35 PM
G - Still lingering below its 50 DMA ($317.59) with volume totals cooling. A rebound above the 50 DMA line is needed for its outlook to improve. It has not formed a sound base. Fundamentals remain strong after it reported Jan '24 quarterly earnings +102% on +33% sales revenues versus the year-ago period.
>>> FEATURED STOCK ARTICLE : 50-Day Moving Average Line Support Being Tested - 4/1/2024 |
View all notes |
Set NEW NOTE alert |
Company Profile |
SEC
News |
Chart |
Request a new note
C
A
S
I |
Symbol/Exchange
Company Name
Industry Group |
PRICE |
CHANGE
(%Change) |
Day High |
Volume
(% DAV)
(% 50 day avg vol) |
52 Wk Hi
% From Hi |
Featured
Date |
Price
Featured |
Pivot Featured |
|
Max Buy |
PCAR
-
NASDAQ
Paccar
Trucks and Parts-Hvy Duty
|
$118.87
|
+0.18
0.15% |
$119.70
|
1,437,240
65.51% of 50 DAV
50 DAV is 2,194,000
|
$125.50
-5.28%
|
1/23/2024
|
$100.35
|
PP = $98.57
|
|
MB = $103.50
|
Most Recent Note - 4/9/2024 5:30:11 PM
G - Pulled back today with +13% above-average volume, retreating from its all-time high. Very extended from any sound base, its 50 DMA line ($113.37) defines near-term support to watch. Fundamentals remain strong.
>>> FEATURED STOCK ARTICLE : Hit New High With 5th Consecutive Gain - 3/21/2024 |
View all notes |
Set NEW NOTE alert |
Company Profile |
SEC
News |
Chart |
Request a new note
C
A
S
I |
HUBB
-
NYSE
Hubbell
Electrical-Power/Equipmt
|
$406.23
|
-0.68
-0.17% |
$409.35
|
245,956
56.54% of 50 DAV
50 DAV is 435,000
|
$429.61
-5.44%
|
1/30/2024
|
$343.26
|
PP = $336.83
|
|
MB = $353.67
|
Most Recent Note - 4/8/2024 5:25:52 PM
G - Holding its ground after a noted "negative reversal" at its all-time high on 4/04/24. It is very extended from the previously noted base. Its 50 DMA line ($380.73) defines important support to watch.
>>> FEATURED STOCK ARTICLE : Hubbell Perched at All-Time High After 5 Weekly Gains - 3/22/2024 |
View all notes |
Set NEW NOTE alert |
Company Profile |
SEC
News |
Chart |
Request a new note
C
A
S
I |
MANH
-
NASDAQ
Manhattan Associates
Computer Sftwr-Enterprse
|
$239.66
|
+1.36
0.57% |
$240.57
|
212,224
56.59% of 50 DAV
50 DAV is 375,000
|
$266.94
-10.22%
|
1/31/2024
|
$240.57
|
PP = $230.71
|
|
MB = $242.25
|
Most Recent Note - 4/11/2024 5:33:56 PM
Lingering below its 50 DMA line ($248.69) and quietly undercut the prior low in the $239 area raising greater concerns this week. A rebound above the 50 DMA line is needed for its outlook to improve. It will be dropped from the Featured Stocks list tonight.
>>> FEATURED STOCK ARTICLE : Manhattan Associates Consolidating Above 50-Day Moving Average - 3/25/2024 |
View all notes |
Set NEW NOTE alert |
Company Profile |
SEC
News |
Chart |
Request a new note
C
A
S
I |
USLM
-
NASDAQ
U.S. Lime & Minerals
Bldg-Cement/Concrt/Ag
|
$294.83
|
+4.83
1.67% |
$296.64
|
29,195
116.78% of 50 DAV
50 DAV is 25,000
|
$308.00
-4.28%
|
2/9/2024
|
$254.68
|
PP = $265.09
|
|
MB = $278.34
|
Most Recent Note - 4/10/2024 12:48:01 PM
G - Hovering in a tight range in recent weeks near its all-time high, encountering some distributional pressure. Its 50 DMA line ($275.30) defines near-term support to watch.
>>> FEATURED STOCK ARTICLE : Gain With Light Volume for Best Ever Close - 4/5/2024 |
View all notes |
Set NEW NOTE alert |
Company Profile |
SEC
News |
Chart |
Request a new note
C
A
S
I |
NOW
-
NYSE
ServiceNow
Computer Sftwr-Enterprse
|
$771.34
|
+2.15
0.28% |
$775.98
|
742,640
64.80% of 50 DAV
50 DAV is 1,146,000
|
$815.32
-5.39%
|
2/22/2024
|
$771.75
|
PP = $815.32
|
|
MB = $856.09
|
Most Recent Note - 4/11/2024 5:12:47 PM
Y - Posted a small gain today with below-average (lighter) volume, finding support near its 50 DMA line ($771). Prior lows in the $730 area define the next important near-term support to watch. See the latest FSU analysis for more details and a new annotated graph.
>>> FEATURED STOCK ARTICLE : Quietly Consolidating Near 50-Day Moving Average Line - 4/11/2024 |
View all notes |
Set NEW NOTE alert |
Company Profile |
SEC
News |
Chart |
Request a new note
C
A
S
I |
Symbol/Exchange
Company Name
Industry Group |
PRICE |
CHANGE
(%Change) |
Day High |
Volume
(% DAV)
(% 50 day avg vol) |
52 Wk Hi
% From Hi |
Featured
Date |
Price
Featured |
Pivot Featured |
|
Max Buy |
SNPS
-
NASDAQ
Synopsys
Computer Sftwr-Design
|
$561.43
|
+0.20
0.04% |
$563.73
|
913,677
85.39% of 50 DAV
50 DAV is 1,070,000
|
$629.38
-10.80%
|
2/22/2024
|
$600.65
|
PP = $582.85
|
|
MB = $611.99
|
Most Recent Note - 4/10/2024 5:40:56 PM
G - Volume totals have been cooling and its color code is changed to green after a quiet slump below its 50 DMA line ($568) today raised concerns. The prior low ($546.91 on 3/15/23) defines the next important support where a damaging loss would raise serious concerns and trigger a more worrisome technical sell signal. See the latest FSU analysis for more details and a new annotated graph.
>>> FEATURED STOCK ARTICLE : Quietly Slumped Below 50-Day Moving Average Line - 4/10/2024 |
View all notes |
Set NEW NOTE alert |
Company Profile |
SEC
News |
Chart |
Request a new note
C
A
S
I |
PAY
-
NYSE
Paymentus Holdings
Finance-CrdtCard/PmtPr
|
$20.74
|
-0.14
-0.67% |
$20.99
|
216,304
56.62% of 50 DAV
50 DAV is 382,000
|
$25.21
-17.73%
|
3/5/2024
|
$19.97
|
PP = $18.89
|
|
MB = $19.83
|
Most Recent Note - 4/10/2024 12:55:27 PM
G - Pulling back today following 3 small gains. It is extended from the previously noted base. Its 50 DMA line ($19) defines important near-term support above prior highs in the $18 range.
>>> FEATURED STOCK ARTICLE : Consolidating After Powerful Breakout and Volume-Driven Gains - 3/27/2024 |
View all notes |
Set NEW NOTE alert |
Company Profile |
SEC
News |
Chart |
Request a new note
C
A
S
I |
HUBS
-
NYSE
HubSpot
Comp Sftwr-Spec Enterprs
|
$682.02
|
+24.31
3.70% |
$682.66
|
520,203
97.97% of 50 DAV
50 DAV is 531,000
|
$693.85
-1.70%
|
4/4/2024
|
$686.66
|
PP = $660.10
|
|
MB = $693.11
|
Most Recent Note - 4/11/2024 5:30:40 PM
Y - Posted a solid gain today with average volume for a best-ever close. Highlighted yellow in the 4/04/24 mid-day report with pivot point cited based on its 2/09/24 high plus 10 cents. Initial support is at its prior highs and its 50 DMA line ($622). Reported Dec '23 quarterly earnings +59% on +24% sales revenues versus the year-ago period, its 6th consecutive quarterly comparison well above the +25% minimum guideline (C criteria). Annual earnings history (A criteria) has been strong. Faces some resistance due to old overhead supply up to the $866 level.
>>> FEATURED STOCK ARTICLE : Encountered Distributional Pressure and Finished Below Pivot Point - 4/4/2024 |
View all notes |
Set NEW NOTE alert |
Company Profile |
SEC
News |
Chart |
Request a new note
C
A
S
I |
|
|
|
THESE ARE NOT BUY RECOMMENDATIONS!
Comments contained in the body of this report are technical
opinions only. The material herein has been obtained
from sources believed to be reliable and accurate, however,
its accuracy and completeness cannot be guaranteed.
This site is not an investment advisor, hence it does
not endorse or recommend any securities or other investments.
Any recommendation contained in this report may not
be suitable for all investors and it is not to be deemed
an offer or solicitation on our part with respect to
the purchase or sale of any securities. All trademarks,
service marks and trade names appearing in this report
are the property of their respective owners, and are
likewise used for identification purposes only.
This report is a service available
only to active Paid Premium Members.
You may opt-out of receiving report notifications
at any time. Questions or comments may be submitted
by writing to Premium Membership Services 665 S.E. 10 Street, Suite 201 Deerfield Beach, FL 33441-5634 or by calling 1-800-965-8307
or 954-785-1121.
|
|
|