You are not logged in.
This means you
CAN ONLY VIEW reports that were published prior to Monday, April 14, 2025.
You
MUST UPGRADE YOUR MEMBERSHIP if you want to see any current reports.
AFTER MARKET UPDATE - FRIDAY, APRIL 11TH, 2014
Previous After Market Report Next After Market Report >>>
|
|
|
|
DOW |
-143.47 |
16,026.75 |
-0.89% |
|
Volume |
798,446,580 |
+2% |
|
Volume |
2,121,080,680 |
-6% |
|
NASDAQ |
-51.42 |
4,002.69 |
-1.27% |
|
Advancers |
853 |
27% |
|
Advancers |
547 |
19% |
|
S&P 500 |
-17.39 |
1,815.69 |
-0.95% |
|
Decliners |
2,205 |
70% |
|
Decliners |
2,257 |
78% |
|
Russell 2000 |
-16.22 |
1,111.44 |
-1.44% |
|
52 Wk Highs |
20 |
|
|
52 Wk Highs |
14 |
|
|
S&P 600 |
-7.98 |
642.79 |
-1.23% |
|
52 Wk Lows |
52 |
|
|
52 Wk Lows |
90 |
|
|
 |
Major Averages Ended Near Session Lows After Rough Week
Kenneth J. Gruneisen - Passed the CAN SLIM® Master's Exam
With Friday's decline, the major averages ended the week firmly in negative territory. The Dow was down -2.4%.The S&P 500 fell -2.7% while the NASDAQ retreated -3.1%. The volume totals behind the losses were reported mixed, higher on the NYSE and lower on the Nasdaq exchange. Decliners led advancers by a 5-2 margin on the NYSE and by 4-1 on the Nasdaq exchange. There were 5 high-ranked companies from the CANSLIM.net Leaders List that made new 52-week highs and appeared on the CANSLIM.net BreakOuts Page, matching the total of 5 stocks on the prior session. The list of stocks hitting new 52-week lows outnumbered new 52-week highs on the NYSE and on the Nasdaq exchange. There were losses for 2 of the 5 high-ranked companies currently included on the Featured Stocks Page, a list that has grown shorter as numerous leaders have broken down in recent weeks. The Market (M criteria) pullback earned the label of a "correction" as a result of recent pressure on the indices, especially the tech-heavy Nasdaq Composite Index, coupled with waning leadership (fewer stocks hitting new 52-week highs). Investors are reminded to limit losses by always selling any stock that falls more than -7% from their purchase price. This is precisely how the fact-based investment system prompts investors to reduce their overall market exposure during weak periods.
Stocks extended their losing streak on Friday. The Dow fell 143 points to 16,026. The S&P 500 declined 17 points to 1,815. The NASDAQ finished 54 points lower at 3,999. The major averages ended the week on a down note amid disappointment in JP Morgan Chase's (JPM - 3.7%) earnings as the largest U.S. bank suffered a -19% decline in first-quarter profits. Fastenal (FAST -1.7%) was lower after posting earnings results matching analyst estimates.
On the economic front, the producer price index unexpectedly rose +0.5% in March versus a projected +0.1% increase. The University of Michigan preliminary reading on consumer sentiment improved in April. Treasuries were higher with the benchmark 10-year note gaining 6/32 to yield 2.63%.
All 10 sectors in the S&P 500 were down on the session. Consumer discretionary, financials and tech were the worst performing groups. TripAdvisor (TRIP -3.6%) and Genworth Financial (GNW -3.9%) lost ground. The defensive utility sector was the best performing as shares of Public Service Enterprises (PEG +0.8%) edged higher.
The CANSLIM.net Featured Stocks Page shows the most action-worthy candidates and their latest notes and a Headline Link directs members to the latest detailed analysis with data-packed graphs annotated by a Certified expert along with links to additional resources. The Premium Member Homepage includes "dynamic archives" to all prior pay reports published. Watch for an announcement via email concerning the next WEBCAST.
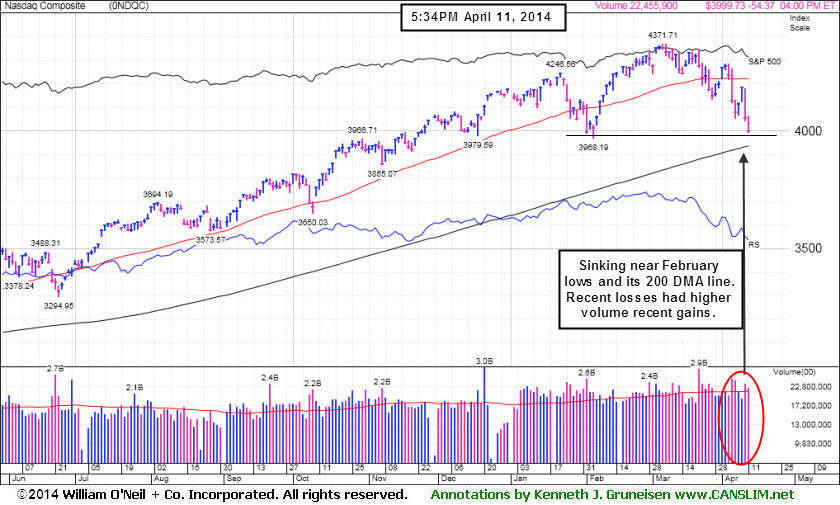
PICTURED: The Nasdaq Composite Index fell near prior lows while slumping toward its 200-day moving average (DMA) line. The ongoing technical deterioration adds emphasis on the importance for investors to use caution and currently aim toward reducing market exposure.
|
 Kenneth J. Gruneisen started out as a licensed stockbroker in August 1987, a couple of months prior to the historic stock market crash that took the Dow Jones Industrial Average down -22.6% in a single day. He has published daily fact-based fundamental and technical analysis on high-ranked stocks online for two decades. Through FACTBASEDINVESTING.COM, Kenneth provides educational articles, news, market commentary, and other information regarding proven investment systems that work in good times and bad.
Comments contained in the body of this report are technical opinions only and are not necessarily those of Gruneisen Growth Corp. The material herein has been obtained from sources believed to be reliable and accurate, however, its accuracy and completeness cannot be guaranteed. Our firm, employees, and customers may effect transactions, including transactions contrary to any recommendation herein, or have positions in the securities mentioned herein or options with respect thereto. Any recommendation contained in this report may not be suitable for all investors and it is not to be deemed an offer or solicitation on our part with respect to the purchase or sale of any securities. |
|
 |
Tech, Financial, and Retail Groups Led Broad Declines
Kenneth J. Gruneisen - Passed the CAN SLIM® Master's Exam
The Biotechnology Index ($BTK -2.42%) led the tech sector retreat while the Semiconductor Index ($SOX -1.55%) and the Networking Index ($NWX -1.35%) also fell. Financial shares weighed on the major averages as the Broker/Dealer Index ($XBD -1.96%) and the Bank Index ($BKX -1.12%) faced pressure. The Retail Index ($RLX -1.50%) also was a negative influence on the major averages. The Gold & Silver Index ($XAU -1.74%) lost ground, meanwhile energy-relaterd shares did a better job of holding their ground as the Oil Services Index ($OSX -0.30%) and the Integrated Oil Index ($XOI -0.19%) edged lower.
Charts courtesy www.stockcharts.com
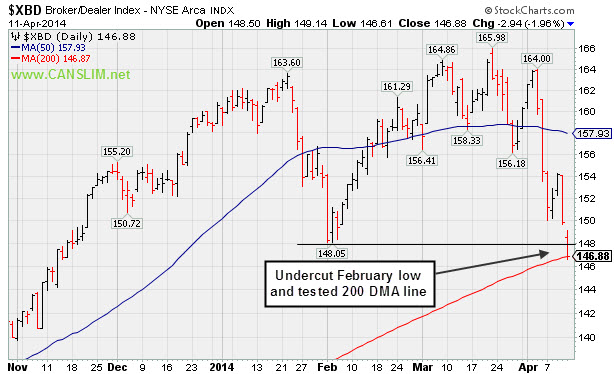
PICTURED: The Broker/Dealer Index ($XBD -1.96%) undercut its February low and tested support at its longer-term 200-day moving average (DMA) line. The action in financial stocks has deteriorated further since regular readers of this report were recently reminded yet again - "Weak action in financial stocks does not bode well for the broader market outlook because the financial groups are usually reliable leading indicators. The major averages have been prone to large downdrafts in the past when financial groups were weak. Further deterioration in financial stocks would raise a caution flag and serve as a reminder for investors to reduce market exposure."
Charts courtesy www.stockcharts.com
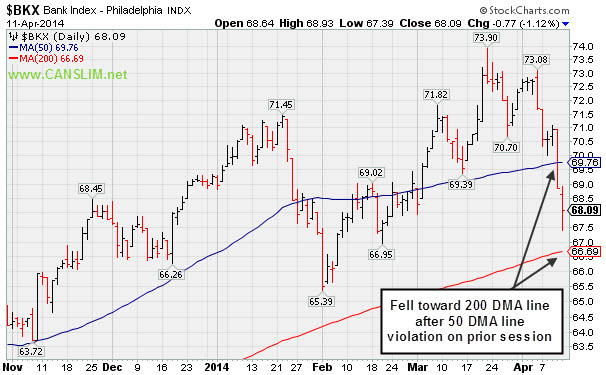
PICTURED: The Bank Index ($BKX -1.12%) fell toward its 200 DMA line after a 50 DMA line violation on the prior session. If the financial indexes badly violate their respective 200 DMA lines it would send a more ominous signal to investors that the market may be headed for bigger trouble.
| Oil Services |
$OSX |
283.49 |
-0.85 |
-0.30% |
+0.88% |
| Integrated Oil |
$XOI |
1,519.41 |
-2.97 |
-0.19% |
+1.08% |
| Semiconductor |
$SOX |
560.34 |
-8.81 |
-1.55% |
+4.73% |
| Networking |
$NWX |
322.96 |
-4.42 |
-1.35% |
-0.30% |
| Broker/Dealer |
$XBD |
146.88 |
-2.94 |
-1.96% |
-8.52% |
| Retail |
$RLX |
847.72 |
-12.94 |
-1.50% |
-9.80% |
| Gold & Silver |
$XAU |
92.55 |
-1.64 |
-1.74% |
+9.98% |
| Bank |
$BKX |
68.09 |
-0.77 |
-1.12% |
-1.69% |
| Biotech |
$BTK |
2,379.32 |
-59.03 |
-2.42% |
+2.10% |
|
|
|
 |
Finished Just Below its 50-Day Average Line
Kenneth J. Gruneisen - Passed the CAN SLIM® Master's Exam
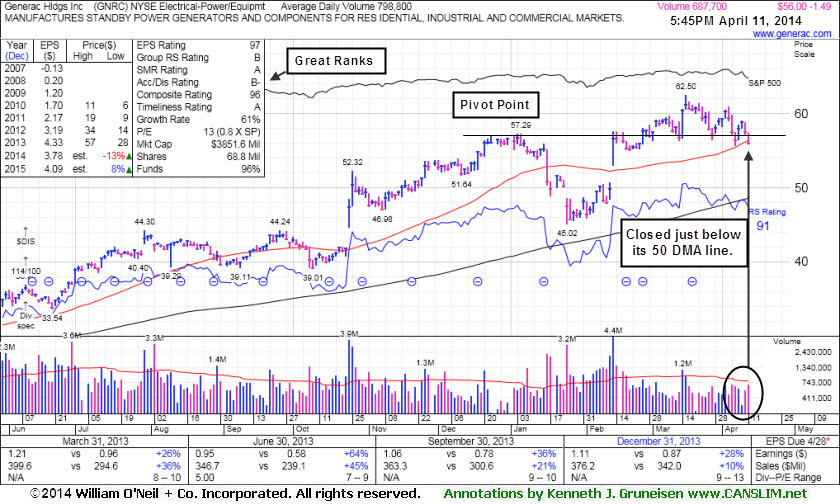
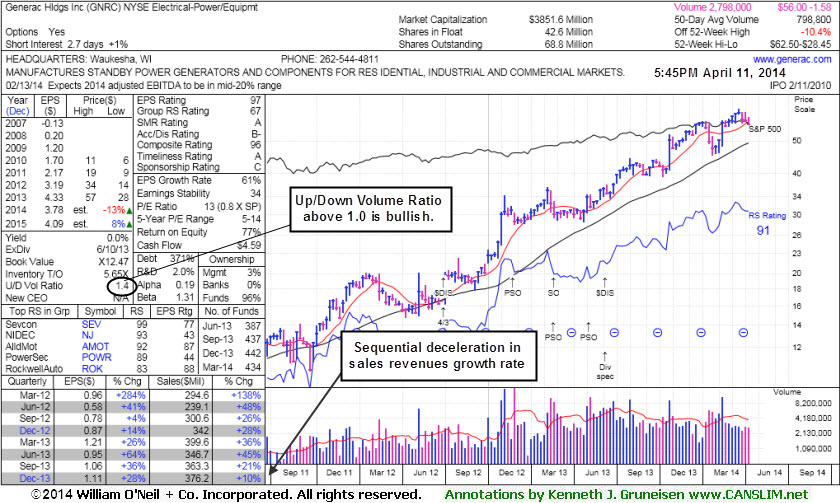
Generac Hldgs Inc (GNRC -$1.49 or -2.59% to $56.00) raised concerns and its color code was changed to green as it finished just below its 50-day moving average (DMA) line after undercutting prior highs in the $57 area. More damaging losses below its recent low ($55.65 on 4/07/14) would raise even greater concerns. It was last shown in this FSU section on 3/31/14 with annotated graphs under the headline, "Perched Near Highs With Mostly Quiet Volume Totals". It did not showing compelling evidence of recent institutional accumulation and made limited headway above prior resistance in the $57 area. The volume totals have not been above average behind its recent gains since its big gap up gain on 2/13/14. Members were previously cautioned - "Volume should be at least +40% above average as a stock rallies above its pivot point to trigger a proper technical buy signal."
It made limited progress since 2/14/14 mid-day report (read here) when highlighted in yellow as it returned to the Featured Stocks list with a new pivot point based on its 1/06/14 high plus 10 cents. Members were previously reminded - "It may likely encounter resistance near prior highs, however, any more convincing volume-driven gains into new high territory may confirm a new technical buy signal."
The high-ranked Electrical - Power/Equipment firm reported earnings +28% on +10% sales revenues for the Dec '13 quarter, continuing its strong earnings history satisfying the C criteria. However, sequential deceleration in the sales revenues growth rate is a cause for concern. Also, consensus estimates are calling for FY '14 earnings down -13%, and its currently low P/E valuation (0.8 X SP) suggests that the market has a timid outlook for future growth. Disciplined investors always limit losses by selling if any stock falls more than -7% from their purchase price.
GNRC has seen little change lately in the number of top-rated funds owning its shares, actually falling slightly from 437 in Sep '13, to 434 in Mar '14. However, its current Up/Down Volume Ratio of 1.4 is an unbiased indication its shares have been under accumulation over the past 50 days. Its small float of only 42.6 million shares (S criteria) can contribute to greater price volatility in the event of institutional buying or selling.
|
|
|
Color Codes Explained :
Y - Better candidates highlighted by our
staff of experts.
G - Previously featured
in past reports as yellow but may no longer be buyable under the
guidelines.
***Last / Change / Volume data in this table is the closing quote data***
Symbol/Exchange
Company Name
Industry Group |
PRICE |
CHANGE
(%Change) |
Day High |
Volume
(% DAV)
(% 50 day avg vol) |
52 Wk Hi
% From Hi |
Featured
Date |
Price
Featured |
Pivot Featured |
|
Max Buy |
EQM
-
NYSE
E Q T Midstream Partners
ENERGY - Oil and Gas Pipelines
|
$71.03
|
+0.11
0.16% |
$71.72
|
116,417
103.02% of 50 DAV
50 DAV is 113,000
|
$73.43
-3.27%
|
12/12/2013
|
$53.17
|
PP = $56.51
|
|
MB = $59.34
|
Most Recent Note - 4/9/2014 5:23:14 PM
G - Still holding its ground and in strong shape, technically, despite fundamental concerns recently noted. Its 50 DMA line defines near-term support where a violation may trigger a technical sell signal. See the latest FSU analysis for more details and new annotated graphs.
>>> FEATURED STOCK ARTICLE : Technical Strength Continues Despite Fundamental Concerns - 4/9/2014
View all notes |
Set NEW NOTE alert |
CANSLIM.net Company Profile |
SEC
News |
Chart |
Request a new note
C
A N
S L
I M


|
GNRC
-
NYSE
Generac Hldgs Inc
Electrical-Power/Equipmt
|
$56.00
|
-1.49
-2.59% |
$57.45
|
687,799
86.19% of 50 DAV
50 DAV is 798,000
|
$62.50
-10.40%
|
2/14/2014
|
$56.50
|
PP = $57.39
|
|
MB = $60.26
|
 Most Recent Note - 4/11/2014 6:09:47 PM
G - Finished just below its 50 DMA line after undercutting prior highs in the $57 area and its color code is changed to green. More damaging losses below its recent low ($55.65 on 4/07/14) would raise greater concerns. See the latest FSU analysis for more details and new annotated graphs.
>>> FEATURED STOCK ARTICLE : Finished Just Below its 50-Day Average Line - 4/11/2014
View all notes |
Set NEW NOTE alert |
CANSLIM.net Company Profile |
SEC
News |
Chart |
Request a new note
C
A N
S L
I M
|
ICON
-
NASDAQ
Iconix Brand Group Inc
CONSUMER NON-DURABLES - Textile - Apparel Footwear
|
$37.16
|
-0.53
-1.41% |
$37.59
|
264,053
43.03% of 50 DAV
50 DAV is 613,700
|
$42.47
-12.50%
|
3/7/2014
|
$41.46
|
PP = $40.88
|
|
MB = $42.92
|
Most Recent Note - 4/10/2014 5:24:37 PM
G - Recently violated its 50 DMA line and prior low triggering technical sell signals. A rebound above the 50 DMA line would help its outlook. See the latest FSU analysis for more details with new annotated graphs.
>>> FEATURED STOCK ARTICLE : Violated 50-Day Average and Relative Strength Rank Fell - 4/10/2014
View all notes |
Set NEW NOTE alert |
CANSLIM.net Company Profile |
SEC
News |
Chart |
Request a new note
C
A N
S L
I M
|
PSIX
-
NASDAQ
Power Solutions Intl Inc
Machinery-Gen Industrial
|
$71.50
|
+0.09
0.13% |
$73.50
|
84,465
134.07% of 50 DAV
50 DAV is 63,000
|
$87.40
-18.19%
|
2/28/2014
|
$74.65
|
PP = $76.93
|
|
MB = $80.78
|
Most Recent Note - 4/11/2014 6:11:19 PM
G - Finished the week below its 50 DMA line and its color code is changed to green. The recent low ($66.03 on 4/07/14) defines important near-term support where further deterioration would raise greater concerns.
>>> FEATURED STOCK ARTICLE : Found Prompt Support Near 50-Day Average After Dip Back Into Prior Base - 4/1/2014
View all notes |
Set NEW NOTE alert |
CANSLIM.net Company Profile |
SEC
News |
Chart |
Request a new note
C
A N
S L
I M
|
SILC
-
NASDAQ
Silicom Ltd
COMPUTER HARDWARE - Networking andamp; Communication Dev
|
$58.58
|
+0.03
0.05% |
$59.20
|
80,444
99.31% of 50 DAV
50 DAV is 81,000
|
$73.44
-20.23%
|
12/23/2013
|
$44.62
|
PP = $46.25
|
|
MB = $48.56
|
Most Recent Note - 4/10/2014 5:27:32 PM
G - Slumped under the recent low ($58.12 on 3/26/14) intra-day yet halted its slide and closed near the middle of the session's trading range. A rebound above its 50 DMA line is needed to help its outlook improve.
>>> FEATURED STOCK ARTICLE : Halted Slide Following 50-Day Moving Average Violation - 4/3/2014
View all notes |
Set NEW NOTE alert |
CANSLIM.net Company Profile |
SEC
News |
Chart |
Request a new note
C
A N
S L
I M
|
Symbol/Exchange
Company Name
Industry Group |
PRICE |
CHANGE
(%Change) |
Day High |
Volume
(% DAV)
(% 50 day avg vol) |
52 Wk Hi
% From Hi |
Featured
Date |
Price
Featured |
Pivot Featured |
|
Max Buy |
|
|
|
THESE ARE NOT BUY RECOMMENDATIONS!
Comments contained in the body of this report are technical
opinions only. The material herein has been obtained
from sources believed to be reliable and accurate, however,
its accuracy and completeness cannot be guaranteed.
This site is not an investment advisor, hence it does
not endorse or recommend any securities or other investments.
Any recommendation contained in this report may not
be suitable for all investors and it is not to be deemed
an offer or solicitation on our part with respect to
the purchase or sale of any securities. All trademarks,
service marks and trade names appearing in this report
are the property of their respective owners, and are
likewise used for identification purposes only.
This report is a service available
only to active Paid Premium Members.
You may opt-out of receiving report notifications
at any time. Questions or comments may be submitted
by writing to Premium Membership Services 665 S.E. 10 Street, Suite 201 Deerfield Beach, FL 33441-5634 or by calling 1-800-965-8307
or 954-785-1121.
|
|
|

