You are not logged in.
This means you
CAN ONLY VIEW reports that were published prior to Saturday, March 29, 2025.
You
MUST UPGRADE YOUR MEMBERSHIP if you want to see any current reports.
AFTER MARKET UPDATE - THURSDAY, APRIL 11TH, 2013
Previous After Market Report Next After Market Report >>>
|
|
|
|
DOW |
+62.90 |
14,865.14 |
+0.42% |
|
Volume |
642,760,080 |
-8% |
|
Volume |
1,768,718,050 |
+4% |
|
NASDAQ |
+2.91 |
3,300.16 |
+0.09% |
|
Advancers |
1,840 |
59% |
|
Advancers |
1,188 |
47% |
|
S&P 500 |
+5.64 |
1,593.37 |
+0.36% |
|
Decliners |
1,168 |
37% |
|
Decliners |
1,240 |
49% |
|
Russell 2000 |
+0.96 |
947.05 |
+0.10% |
|
52 Wk Highs |
384 |
|
|
52 Wk Highs |
179 |
|
|
S&P 600 |
+0.25 |
529.02 |
+0.05% |
|
52 Wk Lows |
10 |
|
|
52 Wk Lows |
15 |
|
|
 |
Indices Extend Rally To New Record Highs
Kenneth J. Gruneisen - Passed the CAN SLIM® Master's Exam
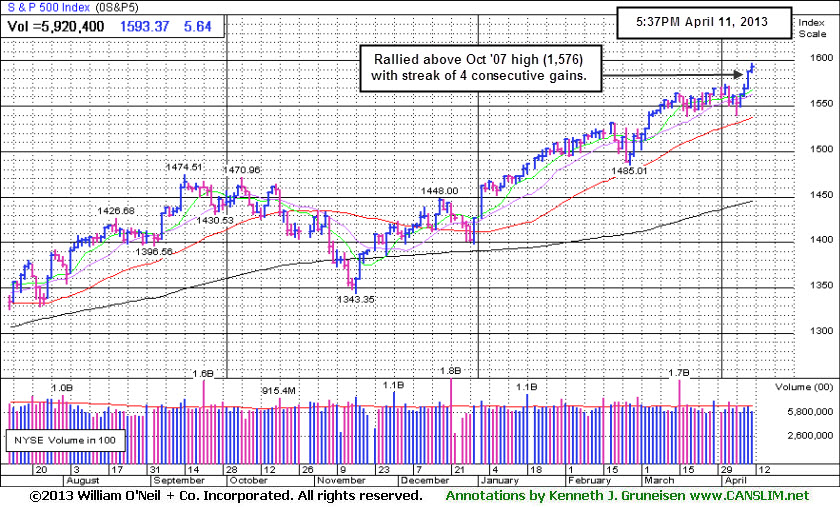
The Dow Jones Industrial Average and the S&P 500 Index rallied further into new all-time high territory as the major averages posted their 4th consecutive gains. Thursday's volume totals on the exchanges were reported mixed, lower than the prior session total on the NYSE and higher on the Nasdaq exchange. Breadth was positive as advancers led decliners by 3 to 2 on the NYSE, however decliners narrowly led advancers on the Nasdaq exchange. New 52-week highs solidly outnumbered new 52-week lows on the NYSE and on the Nasdaq exchange. There were 87 high-ranked companies from the CANSLIM.net Leaders List making new 52-week highs and appearing on the CANSLIM.net BreakOuts Page, up from the prior session total of 69 stocks. There were gains for 7 of the 16 high-ranked companies currently included on the Featured Stocks Page.
A rally in retail stocks helped lift the market higher. Limited Brands (LTD +4.1%) and Ross Stores (ROST +6%) advanced after both companies handily topped same-store-sales expectations. Economic data added to the positive tone. Jobless claims dropped by the most since November, falling by 42,000 last week to 346,000. In addition, inflation remained subdued as import prices fell in March due to a decline in fuel prices.
Overall, almost all sectors closed in positive territory. Telecommunication was the best performing group as AT&T Inc (T +1.2%) and Verizon Communications Inc (VZ +1.4%)rose. Technology lagged behind and limited gains on the tech-heavy Nasdaq Composite Index. A report from research firm IDC showed personal computer sales dropped the most on record in the first-quarter, which dragged Hewlett-Packard Co (HPQ -6.2%) lower.
In fixed-income, Treasuries were higher for the first time this week and a government auction of 30-year bonds drew weak demand. The 10-year note was up 3/32 to yield 1.79% and the 30-year bond gained 4/32 to yield 3.00%.
Recent distribution days and weak action among high-ranked stocks has resulted in a noted shift in the market's (M criteria) stance. Early last week the rally was noted as "under pressure", and Friday's early action had the look of a more worrisome market "correction" before a resilient finish from the major indices provided some encouraging signs. Members have been reminded repeatedly that any sustainable rally requires a healthy crop of companies hitting new 52-week highs, so it is always essential to see meaningful leadership (stocks hitting new 52-week highs). Investors who should be watchful for individual issues flashing sell signals.
Watch for an announcement via email concerning the next WEBCAST. The webcast will also be available via an updated link highlighted at the top of the Premium Member Homepage.
PICTURED: The S&P 500 Index has rallied above its October 2007 all-time high (1,576) with a streak of 4 consecutive gains.
|
 Kenneth J. Gruneisen started out as a licensed stockbroker in August 1987, a couple of months prior to the historic stock market crash that took the Dow Jones Industrial Average down -22.6% in a single day. He has published daily fact-based fundamental and technical analysis on high-ranked stocks online for two decades. Through FACTBASEDINVESTING.COM, Kenneth provides educational articles, news, market commentary, and other information regarding proven investment systems that work in good times and bad.
Comments contained in the body of this report are technical opinions only and are not necessarily those of Gruneisen Growth Corp. The material herein has been obtained from sources believed to be reliable and accurate, however, its accuracy and completeness cannot be guaranteed. Our firm, employees, and customers may effect transactions, including transactions contrary to any recommendation herein, or have positions in the securities mentioned herein or options with respect thereto. Any recommendation contained in this report may not be suitable for all investors and it is not to be deemed an offer or solicitation on our part with respect to the purchase or sale of any securities. |
|
 |
Retail, Energy, Medical Groups Led Gainers
Kenneth J. Gruneisen - Passed the CAN SLIM® Master's Exam
The Retail Index ($RLX +1.22%) posted a solid gain on Thursday and the Broker/Dealer Index ($XBD +0.68%) edged higher while the Bank Index ($BKX -0.05%) finished flat. Energy-related shares had a slightly positive bias as the Integrated Oil Index ($XOI +0.32%) and the Oil Services Index ($OSX +0.42%) posted modest gains. Medical shares also gave the market a lift as the Healthcare Index ($HMO +0.96%) and Biotechnology Index ($BTK +1.23%) rose. The Gold & Silver Index ($XAU -1.55%) fell, making it a standout laggard. The Semiconductor Index ($SOX -0.39%) edged lower while the Networking Index ($NWX +0.13%) and the Internet Index ($IIX +0.21%) posted small gains.
Charts courtesy www.stockcharts.com
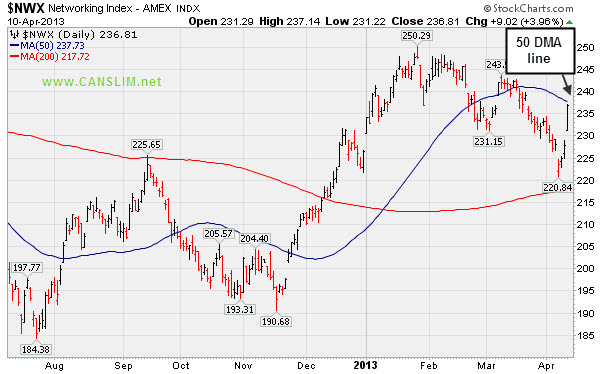
PICTURED: The Broker/Dealer Index ($XBD +0.68%) rallying above its March highs. It is a reassuring sign when the financial groups are strong, as the financial indexes are considered reliable leading indicators for the broader market.
| Oil Services |
$OSX |
253.69 |
+1.07 |
+0.42% |
+15.23% |
| Healthcare |
$HMO |
2,982.28 |
+28.21 |
+0.96% |
+18.62% |
| Integrated Oil |
$XOI |
1,354.10 |
+4.33 |
+0.32% |
+9.04% |
| Semiconductor |
$SOX |
435.63 |
-1.71 |
-0.39% |
+13.43% |
| Networking |
$NWX |
237.12 |
+0.31 |
+0.13% |
+4.66% |
| Internet |
$IIX |
363.69 |
+0.77 |
+0.21% |
+11.22% |
| Broker/Dealer |
$XBD |
113.16 |
+0.76 |
+0.68% |
+19.97% |
| Retail |
$RLX |
747.34 |
+9.01 |
+1.22% |
+14.44% |
| Gold & Silver |
$XAU |
123.33 |
-1.94 |
-1.55% |
-25.53% |
| Bank |
$BKX |
56.84 |
-0.03 |
-0.05% |
+10.84% |
| Biotech |
$BTK |
1,871.80 |
+22.74 |
+1.23% |
+20.99% |
|
|
|
 |
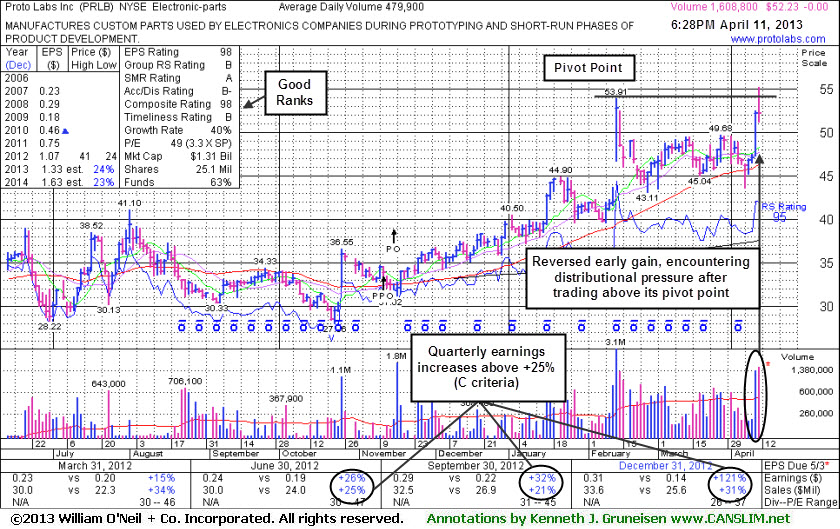
Encountered Distributional Pressure After Trading Above Pivot Point
Kenneth J. Gruneisen - Passed the CAN SLIM® Master's Exam
Often, when a leading stock is setting up to breakout of a solid base it is highlighted in CANSLIM.net's Mid-Day Breakouts Report. The most relevant factors are noted in the report which alerts prudent CANSLIM oriented investors to place the issue in their watch list. After doing any necessary backup research, the investor is prepared to act after the stock triggers a technical buy signal (breaks above its pivot point on more than +50% average turnover) but before it gets too extended from a sound base. In the event the stock fails to trigger a technical buy signal and its price declines then it will simply be removed from the watch list. Disciplined investors know to buy as near as possible to the pivot point and avoid chasing stocks after they have rallied more than +5% above their pivot point. It is crucial to always limit losses whenever any stock heads the wrong direction, and disciplined investors sell if a struggling stock ever falls more than -7% from their purchase price.
Proto Labs Inc (PRLB $52.23) finished unchanged today after making its 2nd consecutive mid-day report appearance. It had finished strong on the prior session after highlighted in yellow in the mid-day report (read here) but didn't trigger a technical buy signal. Then it hit a new 52-week high and traded above the pivot point cited based on its 2/13/13 high plus 10 cents, but it encountered distributional pressure and ended the session flat. A strong finish above the pivot point would have clinched a convincing technical buy signal.
It found support at its 50-day moving average (DMA) line recently. It had been noted in the 2/14/13 mid-day report with caution while retreating following a considerable "breakaway gap". The high-ranked Electronics - Parts firm reported earnings +121% on +31% sales revenues for the quarter ended December 31, 2012 versus the year ago period, marking a 3rd consecutive quarter with earnings increases above the +25% minimum guideline (C criteria) and helping it match up better with the fact-based investment system's winning models. Completed a new Public Offering on 11/15/12. The number opf top-rated funds owning its shares rose from 132 in Jun '12 to 199 in Mar '13, a reassuring sign concerning the I criteria.
|
|
|
Color Codes Explained :
Y - Better candidates highlighted by our
staff of experts.
G - Previously featured
in past reports as yellow but may no longer be buyable under the
guidelines.
***Last / Change / Volume data in this table is the closing quote data***
Symbol/Exchange
Company Name
Industry Group |
PRICE |
CHANGE
(%Change) |
Day High |
Volume
(% DAV)
(% 50 day avg vol) |
52 Wk Hi
% From Hi |
Featured
Date |
Price
Featured |
Pivot Featured |
|
Max Buy |
AMBA
-
NASDAQ
Ambarella Inc
ELECTRONICS - Semiconductor - Specialized
|
$13.30
|
-0.68
-4.86% |
$13.98
|
741,128
219.72% of 50 DAV
50 DAV is 337,300
|
$16.00
-16.88%
|
3/26/2013
|
$15.31
|
PP = $14.83
|
|
MB = $15.57
|
 Most Recent Note - 4/11/2013 2:23:45 PM
Y - Down with above average volume again today. Action has been indicative of more worrisome distributional pressure after a "negative reversal" on 4/01/13. Disciplined investors always limit losses by selling if any stock falls more than -7% from their purchase price.
>>> The latest Featured Stock Update with an annotated graph appeared on 3/26/2013. Click here.
View all notes |
Alert me of new notes |
CANSLIM.net Company Profile |
SEC |
Zacks Reports |
StockTalk |
News |
Chart |
Request a new note
C
A N
S L
I M


|
CELG
-
NASDAQ
Celgene Corp
DRUGS - Drug Manufacturers - Major
|
$122.99
|
+2.18
1.80% |
$123.80
|
3,319,455
105.67% of 50 DAV
50 DAV is 3,141,200
|
$120.84
1.78%
|
3/27/2013
|
$113.24
|
PP = $115.54
|
|
MB = $121.32
|
Most Recent Note - 4/5/2013 6:32:33 PM
Y - It recently wedged to new highs from an advanced "3-weeks tight" base with only average volume behind its gains above the new pivot point cited based on its 3/14/13 high plus 10 cents.
>>> The latest Featured Stock Update with an annotated graph appeared on 3/28/2013. Click here.
View all notes |
Alert me of new notes |
CANSLIM.net Company Profile |
SEC |
Zacks Reports |
StockTalk |
News |
Chart |
Request a new note
C
A N
S L
I M
|
CFNL
-
NASDAQ
Cardinal Financial Corp
BANKING - Regional - Southeast Banks
|
$17.42
|
-0.02
-0.11% |
$17.49
|
171,376
86.60% of 50 DAV
50 DAV is 197,900
|
$18.40
-5.33%
|
3/22/2013
|
$17.99
|
PP = $18.29
|
|
MB = $19.20
|
Most Recent Note - 4/5/2013 6:33:51 PM
Y - Retreated near its 50 DMA line, enduring recent distributional pressure instead of rallying from the previously noted advanced "3-weeks tight" base. Previously noted - "Gains above the pivot point must have at least the bare minimum +40% above average volume, preferably more, to trigger a proper new (or add-on) technical buy signal."
>>> The latest Featured Stock Update with an annotated graph appeared on 4/10/2013. Click here.
View all notes |
Alert me of new notes |
CANSLIM.net Company Profile |
SEC |
Zacks Reports |
StockTalk |
News |
Chart |
Request a new note
C
A N
S L
I M
|
CMCSA
-
NASDAQ
Comcast Corp Cl A
MEDIA - CATV Systems
|
$41.81
|
+0.20
0.47% |
$41.96
|
13,198,868
91.76% of 50 DAV
50 DAV is 14,384,200
|
$42.61
-1.88%
|
12/3/2012
|
$37.08
|
PP = $38.06
|
|
MB = $39.96
|
Most Recent Note - 4/9/2013 12:50:13 PM
G - Hovering near its 52-week high after finding recent support and rallying from its 50 DMA line. Relative Strength Rating is at 82, above the 80+ guideline for buy candidates. However, fundamental concerns remain since it reported earnings +11% on +6% sales revenues for the Dec '12 quarter, below the +25% minimum guideline (C criteria).
>>> The latest Featured Stock Update with an annotated graph appeared on 3/19/2013. Click here.
View all notes |
Alert me of new notes |
CANSLIM.net Company Profile |
SEC |
Zacks Reports |
StockTalk |
News |
Chart |
Request a new note
C
A N
S L
I M
|
EVER
-
NYSE
Everbank Financial Corp
BANKING
|
$15.23
|
+0.16
1.06% |
$15.26
|
717,801
76.40% of 50 DAV
50 DAV is 939,500
|
$17.29
-11.91%
|
3/4/2013
|
$15.38
|
PP = $15.83
|
|
MB = $16.62
|
Most Recent Note - 4/9/2013 12:52:24 PM
G - Still holding its ground near its 50 DMA line ($15.14 now). That important short-term average has acted as support since damaging losses violated prior highs in the $16 area raising concerns while completely negating its prior technical breakout. Its Relative Strength (RS) rating has slumped to 73, below the 80+ minimum guideline for buy candidates.
>>> The latest Featured Stock Update with an annotated graph appeared on 4/2/2013. Click here.
View all notes |
Alert me of new notes |
CANSLIM.net Company Profile |
SEC |
Zacks Reports |
StockTalk |
News |
Chart |
Request a new note
C
A N
S L
I M
|
Symbol/Exchange
Company Name
Industry Group |
PRICE |
CHANGE
(%Change) |
Day High |
Volume
(% DAV)
(% 50 day avg vol) |
52 Wk Hi
% From Hi |
Featured
Date |
Price
Featured |
Pivot Featured |
|
Max Buy |
FLT
-
NYSE
Fleetcor Technologies
DIVERSIFIED SERVICES - Business/Management Services
|
$77.57
|
-0.79
-1.01% |
$78.73
|
534,448
65.46% of 50 DAV
50 DAV is 816,500
|
$78.87
-1.65%
|
3/21/2013
|
$71.14
|
PP = $73.00
|
|
MB = $76.65
|
Most Recent Note - 4/5/2013 12:09:36 PM
Y - Color code is changed to yellow while retreating below its "max buy" level, but recent distributional pressure is raising concerns for the market and all stocks. Prior high in the $72 area defines near-term support to watch on pullbacks.
>>> The latest Featured Stock Update with an annotated graph appeared on 3/21/2013. Click here.
View all notes |
Alert me of new notes |
CANSLIM.net Company Profile |
SEC |
Zacks Reports |
StockTalk |
News |
Chart |
Request a new note
C
A N
S L
I M
|
LNKD
-
NYSE
Linkedin Corp Class A
INTERNET - Internet Information Providers
|
$180.18
|
+2.87
1.62% |
$183.20
|
2,151,477
88.02% of 50 DAV
50 DAV is 2,444,400
|
$184.15
-2.16%
|
2/8/2013
|
$147.04
|
PP = $127.55
|
|
MB = $133.93
|
Most Recent Note - 4/5/2013 6:35:46 PM
G - Consolidating for just a couple of weeks, extended from any sound base pattern and well above its 50 DMA line which defines important near term support to watch. See the latest FSU analysis for more details and a new annotated graph.
>>> The latest Featured Stock Update with an annotated graph appeared on 4/5/2013. Click here.
View all notes |
Alert me of new notes |
CANSLIM.net Company Profile |
SEC |
Zacks Reports |
StockTalk |
News |
Chart |
Request a new note
C
A N
S L
I M
|
MIDD
-
NASDAQ
Middleby Corp
MANUFACTURING - Diversified Machinery
|
$147.48
|
-0.04
-0.03% |
$149.06
|
79,370
86.74% of 50 DAV
50 DAV is 91,500
|
$154.74
-4.69%
|
10/8/2012
|
$118.46
|
PP = $122.67
|
|
MB = $128.80
|
Most Recent Note - 4/8/2013 5:52:53 PM
G - Recently slumping below its 50 DMA line raising concerns with losses on light volume. Fundamental concerns were recently noted.
>>> The latest Featured Stock Update with an annotated graph appeared on 3/25/2013. Click here.
View all notes |
Alert me of new notes |
CANSLIM.net Company Profile |
SEC |
Zacks Reports |
StockTalk |
News |
Chart |
Request a new note
C
A N
S L
I M
|
MNTX
-
NASDAQ
Manitex International
MANUFACTURING - Diversified Machinery
|
$11.42
|
-0.44
-3.71% |
$12.06
|
101,100
50.17% of 50 DAV
50 DAV is 201,500
|
$13.14
-13.09%
|
3/20/2013
|
$11.29
|
PP = $12.05
|
|
MB = $12.65
|
Most Recent Note - 4/9/2013 12:48:19 PM
Y - Rallying up from support at its 50 DMA line. Recent low ($10.21 on 4/04/13) defines important near-term support below its 50 DMA line. Disciplined investors avoid chasing extended stocks and always limit losses by selling if any stock falls more than -7% from their purchase price.
>>> The latest Featured Stock Update with an annotated graph appeared on 3/20/2013. Click here.
View all notes |
Alert me of new notes |
CANSLIM.net Company Profile |
SEC |
Zacks Reports |
StockTalk |
News |
Chart |
Request a new note
C
A N
S L
I M
|
MRLN
-
NASDAQ
Marlin Business Services
DIVERSIFIED SERVICES - Rental and Leasing Services
|
$23.24
|
+0.10
0.43% |
$23.61
|
11,893
49.55% of 50 DAV
50 DAV is 24,000
|
$23.98
-3.09%
|
3/15/2013
|
$22.29
|
PP = $23.18
|
|
MB = $24.34
|
Most Recent Note - 4/9/2013 6:59:18 PM
Y - Consolidating above its 50 DMA line, still perched within close striking distance of its 52-week high. Previously noted - "Subsequent volume-driven gains above the pivot point could help clinch a more convincing technical buy signal." See the latest FSU analysis for more details and a new annotated graph.
>>> The latest Featured Stock Update with an annotated graph appeared on 4/9/2013. Click here.
View all notes |
Alert me of new notes |
CANSLIM.net Company Profile |
SEC |
Zacks Reports |
StockTalk |
News |
Chart |
Request a new note
C
A N
S L
I M
|
Symbol/Exchange
Company Name
Industry Group |
PRICE |
CHANGE
(%Change) |
Day High |
Volume
(% DAV)
(% 50 day avg vol) |
52 Wk Hi
% From Hi |
Featured
Date |
Price
Featured |
Pivot Featured |
|
Max Buy |
MWIV
-
NASDAQ
M W I Veterinary Supply
HEALTH SERVICES - Medical Instruments and; Supplies
|
$128.05
|
-1.74
-1.34% |
$129.97
|
101,421
171.90% of 50 DAV
50 DAV is 59,000
|
$137.18
-6.66%
|
3/4/2013
|
$130.90
|
PP = $129.45
|
|
MB = $135.92
|
Most Recent Note - 4/9/2013 12:56:23 PM
Y - Consolidating above its 50 DMA line and above its pivot point with volume totals cooling while staying in a very tight trading range in recent weeks, building on a base-on-base type pattern.
>>> The latest Featured Stock Update with an annotated graph appeared on 4/4/2013. Click here.
View all notes |
Alert me of new notes |
CANSLIM.net Company Profile |
SEC |
Zacks Reports |
StockTalk |
News |
Chart |
Request a new note
C
A N
S L
I M
|
N
-
NYSE
Netsuite Inc
DIVERSIFIED SERVICES - Business/Management Services
|
$78.57
|
-0.60
-0.76% |
$79.10
|
382,262
100.70% of 50 DAV
50 DAV is 379,600
|
$80.33
-2.19%
|
12/12/2012
|
$64.75
|
PP = $67.12
|
|
MB = $70.48
|
Most Recent Note - 4/8/2013 5:54:49 PM
G - It is extended from its prior base and pulled back from all-time highs last week after a streak of 7 consecutive weekly gains. Its 50 DMA line defines important near-term support to watch.
>>> The latest Featured Stock Update with an annotated graph appeared on 4/1/2013. Click here.
View all notes |
Alert me of new notes |
CANSLIM.net Company Profile |
SEC |
Zacks Reports |
StockTalk |
News |
Chart |
Request a new note
C
A N
S L
I M
|
NSR
-
NYSE
Neustar Inc
TELECOMMUNICATIONS - Diversified Communication Serv
|
$43.75
|
-0.32
-0.73% |
$44.23
|
284,602
60.00% of 50 DAV
50 DAV is 474,300
|
$47.24
-7.39%
|
3/8/2013
|
$44.99
|
PP = $47.34
|
|
MB = $49.71
|
Most Recent Note - 4/4/2013 12:57:48 PM
G - Color code is changed to green while slumping below its 50 DMA line and undercutting its prior lows, weakness raising concerns and triggering technical sell signals. Its Relative Strength rating has slumped to 63, well below the 80+ minimum guideline for buy candidates.
>>> The latest Featured Stock Update with an annotated graph appeared on 3/27/2013. Click here.
View all notes |
Alert me of new notes |
CANSLIM.net Company Profile |
SEC |
Zacks Reports |
StockTalk |
News |
Chart |
Request a new note
C
A N
S L
I M
|
PRLB
-
NYSE
Proto Labs Inc
MANUFACTURING - Small Tools and Accessories
|
$52.23
|
+0.00
0.00% |
$55.23
|
1,608,895
335.26% of 50 DAV
50 DAV is 479,900
|
$53.91
-3.12%
|
4/10/2013
|
$49.97
|
PP = $54.01
|
|
MB = $56.71
|
Most Recent Note - 4/11/2013 6:49:14 PM
Y - Encountered distributional pressure after hitting a new 52-week high and trading above the pivot point cited based on its 2/13/13 high plus 10 cents. A strong finish above the pivot point may clinch a convincing technical buy signal. See the latest FSU analysis for more details and a new annotated graph.
>>> The latest Featured Stock Update with an annotated graph appeared on 4/11/2013. Click here.
View all notes |
Alert me of new notes |
CANSLIM.net Company Profile |
SEC |
Zacks Reports |
StockTalk |
News |
Chart |
Request a new note
C
A N
S L
I M
|
RRTS
-
NYSE
Roadrunner Trans Systems
TRANSPORTATION - Air Delivery and Freight Service
|
$23.64
|
+0.11
0.47% |
$23.88
|
384,407
204.58% of 50 DAV
50 DAV is 187,900
|
$23.71
-0.30%
|
4/3/2013
|
$22.77
|
PP = $23.75
|
|
MB = $24.94
|
Most Recent Note - 4/11/2013 6:51:31 PM
Y - Touched a new 52-week high today and churned heavy volume but finished just below its pivot point. A solid gain is still needed to trigger a new technical buy signal. Fundamentals remain strong enough to still satisfy the C and A criteria, however decelerating sales revenues and earnings increases in sequential quarterly comparisons through the Dec '12 quarter is a concern. Completed a new Public Offering on 12/06/12 and, technically, it broke out above previously stubborn resistance in $19 area with volume-driven gains in January.
>>> The latest Featured Stock Update with an annotated graph appeared on 4/3/2013. Click here.
View all notes |
Alert me of new notes |
CANSLIM.net Company Profile |
SEC |
Zacks Reports |
StockTalk |
News |
Chart |
Request a new note
C
A N
S L
I M
|
Symbol/Exchange
Company Name
Industry Group |
PRICE |
CHANGE
(%Change) |
Day High |
Volume
(% DAV)
(% 50 day avg vol) |
52 Wk Hi
% From Hi |
Featured
Date |
Price
Featured |
Pivot Featured |
|
Max Buy |
VRX
-
NYSE
Valeant Pharmaceuticals
DRUGS - Drug Manufacturers - Other
|
$73.79
|
+0.79
1.08% |
$74.08
|
886,195
63.09% of 50 DAV
50 DAV is 1,404,700
|
$76.56
-3.62%
|
12/20/2012
|
$60.24
|
PP = $61.21
|
|
MB = $64.27
|
Most Recent Note - 4/8/2013 5:51:08 PM
G - Consolidating above its 50 DMA line defining important near term support following loss with heavy volume on M&A news. See latest FSU analysis for more details and a new annotated graph.
>>> The latest Featured Stock Update with an annotated graph appeared on 4/8/2013. Click here.
View all notes |
Alert me of new notes |
CANSLIM.net Company Profile |
SEC |
Zacks Reports |
StockTalk |
News |
Chart |
Request a new note
C
A N
S L
I M
|
|
|
|
THESE ARE NOT BUY RECOMMENDATIONS!
Comments contained in the body of this report are technical
opinions only. The material herein has been obtained
from sources believed to be reliable and accurate, however,
its accuracy and completeness cannot be guaranteed.
This site is not an investment advisor, hence it does
not endorse or recommend any securities or other investments.
Any recommendation contained in this report may not
be suitable for all investors and it is not to be deemed
an offer or solicitation on our part with respect to
the purchase or sale of any securities. All trademarks,
service marks and trade names appearing in this report
are the property of their respective owners, and are
likewise used for identification purposes only.
This report is a service available
only to active Paid Premium Members.
You may opt-out of receiving report notifications
at any time. Questions or comments may be submitted
by writing to Premium Membership Services 665 S.E. 10 Street, Suite 201 Deerfield Beach, FL 33441-5634 or by calling 1-800-965-8307
or 954-785-1121.
|
|
|

