***Last / Change / Volume data in this table is the closing quote data***
Symbol/Exchange
Company Name
Industry Group |
PRICE |
CHANGE
(%Change) |
Day High |
Volume
(% DAV)
(% 50 day avg vol) |
52 Wk Hi
% From Hi |
Featured
Date |
Price
Featured |
Pivot Featured |
|
Max Buy |
ACN
-
NYSE
Accenture Plc
DIVERSIFIED SERVICES - Business/Management Services
|
$63.62
|
+1.15
1.83% |
$63.99
|
3,359,645
104.56% of 50 DAV
50 DAV is 3,213,200
|
$65.89
-3.45%
|
3/23/2012
|
$64.13
|
PP = $63.76
|
|
MB = $66.95
|
 Most Recent Note - 4/11/2012 11:43:47 AM
Y - Sputtering since the gain above the pivot point on 3/23/12 backed by +88% above average volume triggered a new (or add-on) technical buy signal. Prior highs in the $62-63 area define initial support to watch above its 50 DMA line.
>>> The latest Featured Stock Update with an annotated graph appeared on 3/23/2012. Click here.
View all notes |
Alert me of new notes |
CANSLIM.net Company Profile |
SEC |
Zacks Reports |
StockTalk |
News |
Chart |
Request a new note
C
A N
S L
I M


|
ADS
-
NYSE
Alliance Data Sys Corp
COMPUTER SOFTWARE and SERVICES - Information and Delivery Service
|
$123.57
|
+0.42
0.34% |
$124.17
|
453,750
70.58% of 50 DAV
50 DAV is 642,900
|
$127.71
-3.24%
|
1/17/2012
|
$108.24
|
PP = $107.43
|
|
MB = $112.80
|
Most Recent Note - 4/10/2012 6:16:33 PM
G - Pulling back from its all-time high toward its 50 DMA line with today's 4th consecutive loss. Fundamental concerns were raised by earnings reported +9%, well below the +25% minimum guideline in the latest quarter ended December 31, 2011.
>>> The latest Featured Stock Update with an annotated graph appeared on 2/29/2012. Click here.
View all notes |
Alert me of new notes |
CANSLIM.net Company Profile |
SEC |
Zacks Reports |
StockTalk |
News |
Chart |
Request a new note
C
A N
S L
I M
|
ALLT
-
NASDAQ
Allot Communications Ltd
COMPUTER SOFTWARE andamp; SERVICES - Technical andamp; System Software
|
$23.53
|
+0.48
2.08% |
$24.18
|
430,648
90.06% of 50 DAV
50 DAV is 478,200
|
$24.96
-5.73%
|
3/13/2012
|
$19.72
|
PP = $18.91
|
|
MB = $19.86
|
Most Recent Note - 4/11/2012 12:35:13 PM
G - Up today, and perched near its 52-week high, extended from its prior base. Prior highs near $18-19 define initial support to watch on pullbacks.
>>> The latest Featured Stock Update with an annotated graph appeared on 3/19/2012. Click here.
View all notes |
Alert me of new notes |
CANSLIM.net Company Profile |
SEC |
Zacks Reports |
StockTalk |
News |
Chart |
Request a new note
C
A N
S L
I M
|
ALXN
-
NASDAQ
Alexion Pharmaceuticals
DRUGS - Drug Manufacturers - Other
|
$89.81
|
+0.59
0.66% |
$91.13
|
899,708
69.12% of 50 DAV
50 DAV is 1,301,700
|
$95.01
-5.47%
|
3/12/2012
|
$87.87
|
PP = $87.73
|
|
MB = $92.12
|
Most Recent Note - 4/10/2012 6:18:12 PM
G - Down today with higher (near average) volume, encountering profit-taking pressure amid widespread market weakness. Support to watch is at its 50 DMA line ($85.73).
>>> The latest Featured Stock Update with an annotated graph appeared on 2/24/2012. Click here.
View all notes |
Alert me of new notes |
CANSLIM.net Company Profile |
SEC |
Zacks Reports |
StockTalk |
News |
Chart |
Request a new note
C
A N
S L
I M
|
BODY
-
NASDAQ
Body Central Corp
RETAIL - Catalog andamp; Mail Order Houses
|
$27.25
|
+1.01
3.85% |
$27.35
|
248,319
116.58% of 50 DAV
50 DAV is 213,000
|
$29.49
-7.60%
|
1/27/2012
|
$26.69
|
PP = $25.46
|
|
MB = $26.73
|
Most Recent Note - 4/11/2012 4:58:11 PM
G - Promptly rebounded and closed near its 50 DMA line today, an encouraging sign that it was finding support near that important short-term average. Subsequent damaging losses below its recent lows would raise more serious concerns and trigger additional sell signals.
>>> The latest Featured Stock Update with an annotated graph appeared on 3/13/2012. Click here.
View all notes |
Alert me of new notes |
CANSLIM.net Company Profile |
SEC |
Zacks Reports |
StockTalk |
News |
Chart |
Request a new note
C
A N
S L
I M
|
Symbol/Exchange
Company Name
Industry Group |
PRICE |
CHANGE
(%Change) |
Day High |
Volume
(% DAV)
(% 50 day avg vol) |
52 Wk Hi
% From Hi |
Featured
Date |
Price
Featured |
Pivot Featured |
|
Max Buy |
CDNS
-
NASDAQ
Cadence Design Systems
COMPUTER SOFTWARE and SERVICES - Technical and System Software
|
$11.38
|
+0.14
1.25% |
$11.51
|
1,456,950
44.38% of 50 DAV
50 DAV is 3,282,700
|
$12.60
-9.68%
|
2/3/2012
|
$11.66
|
PP = $11.15
|
|
MB = $11.71
|
Most Recent Note - 4/10/2012 6:10:20 PM
G - Volume was higher (near average) today while slumping further below its 50 DMA line, raising concerns. Finished the session at the prior low ($11.24 on 3/06/12) previously noted as the next important support level to watch.
>>> The latest Featured Stock Update with an annotated graph appeared on 3/28/2012. Click here.
View all notes |
Alert me of new notes |
CANSLIM.net Company Profile |
SEC |
Zacks Reports |
StockTalk |
News |
Chart |
Request a new note
C
A N
S L
I M
|
CELG
-
NASDAQ
Celgene Corp
DRUGS - Drug Manufacturers - Major
|
$78.52
|
-0.68
-0.86% |
$80.16
|
2,566,937
92.54% of 50 DAV
50 DAV is 2,773,900
|
$80.42
-2.36%
|
2/2/2012
|
$74.16
|
PP = $75.21
|
|
MB = $78.97
|
Most Recent Note - 4/11/2012 12:27:37 PM
G - Stubbornly holding its ground after rallying above its "max buy" level. Its 50 DMA line defines support to watch.
>>> The latest Featured Stock Update with an annotated graph appeared on 3/26/2012. Click here.
View all notes |
Alert me of new notes |
CANSLIM.net Company Profile |
SEC |
Zacks Reports |
StockTalk |
News |
Chart |
Request a new note
C
A N
S L
I M
|
COO
-
NYSE
Cooper Companies Inc
HEALTH SERVICES - Medical Instruments and Supplies
|
$81.89
|
+0.36
0.44% |
$82.37
|
314,994
74.22% of 50 DAV
50 DAV is 424,400
|
$84.20
-2.74%
|
3/9/2012
|
$83.05
|
PP = $81.02
|
|
MB = $85.07
|
Most Recent Note - 4/10/2012 6:12:27 PM
Y - Small loss today on higher volume. Still perched near its 52-week high and above its pivot point with no resistance remaining. While trading sideways in recent weeks its Relative Strength rating slumped, and now at a mediocre 77, that rating is below the 80+ guideline for buy candidates.
>>> The latest Featured Stock Update with an annotated graph appeared on 3/9/2012. Click here.
View all notes |
Alert me of new notes |
CANSLIM.net Company Profile |
SEC |
Zacks Reports |
StockTalk |
News |
Chart |
Request a new note
C
A N
S L
I M
|
DISH
-
NASDAQ
Dish Network Corp Cl A
CONSUMER DURABLES - Electronic Equipment
|
$31.93
|
+0.53
1.69% |
$32.34
|
1,489,056
57.60% of 50 DAV
50 DAV is 2,585,300
|
$35.64
-10.41%
|
3/7/2012
|
$30.83
|
PP = $30.10
|
|
MB = $31.61
|
Most Recent Note - 4/10/2012 6:14:18 PM
Y - Down today on below average volume. Color code is changed to yellow while consolidating under its "max buy" level and above prior highs in the $30 area defining initial support to watch on pullbacks.
>>> The latest Featured Stock Update with an annotated graph appeared on 3/14/2012. Click here.
View all notes |
Alert me of new notes |
CANSLIM.net Company Profile |
SEC |
Zacks Reports |
StockTalk |
News |
Chart |
Request a new note
C
A N
S L
I M
|
FEIC
-
NASDAQ
F E I Co
ELECTRONICS - Diversified Electronics
|
$47.46
|
+0.61
1.30% |
$47.46
|
213,271
67.07% of 50 DAV
50 DAV is 318,000
|
$49.92
-4.93%
|
12/7/2011
|
$41.41
|
PP = $42.35
|
|
MB = $44.47
|
Most Recent Note - 4/10/2012 6:21:39 PM
G - Down today with higher (near average) volume, slumping toward its 50 DMA line. The latest quarterly report showed +21% earnings for the Dec '11 quarter, below the +25% minimum guideline for earnings growth.
>>> The latest Featured Stock Update with an annotated graph appeared on 3/12/2012. Click here.
View all notes |
Alert me of new notes |
CANSLIM.net Company Profile |
SEC |
Zacks Reports |
StockTalk |
News |
Chart |
Request a new note
C
A N
S L
I M
|
Symbol/Exchange
Company Name
Industry Group |
PRICE |
CHANGE
(%Change) |
Day High |
Volume
(% DAV)
(% 50 day avg vol) |
52 Wk Hi
% From Hi |
Featured
Date |
Price
Featured |
Pivot Featured |
|
Max Buy |
GNC
-
NYSE
G N C Holdings Inc
RETAIL - Drug Stores
|
$34.99
|
+1.06
3.12% |
$35.00
|
898,010
57.05% of 50 DAV
50 DAV is 1,574,200
|
$36.10
-3.07%
|
1/19/2012
|
$28.99
|
PP = $29.60
|
|
MB = $31.08
|
Most Recent Note - 4/11/2012 5:04:47 PM
G - Gain on lighter volume today ended a streak of 4 consecutive losses since hitting its all-time high. Its 50 DMA line defines near-term chart support to watch on pullbacks. It completed Secondary Offerings on 10/25/11 and 3/13/12 after making steady progress following its 4/01/11 IPO.
>>> The latest Featured Stock Update with an annotated graph appeared on 3/5/2012. Click here.
View all notes |
Alert me of new notes |
CANSLIM.net Company Profile |
SEC |
Zacks Reports |
StockTalk |
News |
Chart |
Request a new note
C
A N
S L
I M
|
HLF
-
NYSE
Herbalife Ltd
DRUGS - Nutrition and Weight Management
|
$68.06
|
+0.18
0.27% |
$68.79
|
1,420,799
104.53% of 50 DAV
50 DAV is 1,359,200
|
$72.11
-5.62%
|
2/22/2012
|
$65.90
|
PP = $63.50
|
|
MB = $66.68
|
Most Recent Note - 4/11/2012 12:31:30 PM
G - Hovering only -5.7% off its all-time high today, extended from its prior base pattern. Prior highs in the $63 area define support to watch on pullbacks.
>>> The latest Featured Stock Update with an annotated graph appeared on 2/22/2012. Click here.
View all notes |
Alert me of new notes |
CANSLIM.net Company Profile |
SEC |
Zacks Reports |
StockTalk |
News |
Chart |
Request a new note
C
A N
S L
I M
|
ISRG
-
NASDAQ
Intuitive Surgical Inc
HEALTH SERVICES - Medical Appliances and Equipment
|
$540.01
|
+4.77
0.89% |
$541.74
|
340,900
122.67% of 50 DAV
50 DAV is 277,900
|
$550.47
-1.90%
|
12/20/2011
|
$442.43
|
PP = $449.16
|
|
MB = $471.62
|
Most Recent Note - 4/11/2012 12:33:30 PM
G - Enduring mild distributional pressure but holding its ground following 8 consecutive weekly gains. Extended from any sound base pattern. Previously noted - "The December '11 quarterly earnings increased by just below the borderline +25% minimum guideline for ideal buy candidates."
>>> The latest Featured Stock Update with an annotated graph appeared on 3/1/2012. Click here.
View all notes |
Alert me of new notes |
CANSLIM.net Company Profile |
SEC |
Zacks Reports |
StockTalk |
News |
Chart |
Request a new note
C
A N
S L
I M
|
LULU
-
NASDAQ
Lululemon Athletica
MANUFACTURING - Textile Manufacturing
|
$73.06
|
+1.62
2.27% |
$73.46
|
1,716,007
86.85% of 50 DAV
50 DAV is 1,975,800
|
$77.13
-5.28%
|
1/10/2012
|
$60.97
|
PP = $59.46
|
|
MB = $62.43
|
Most Recent Note - 4/10/2012 5:30:17 PM
G - Down considerably today with above average volume, enduring distributional pressure amid widespread market weakness. The damaging loss violated the previously noted upward trendline connecting January-March lows defining initial near-term chart support above its 50 DMA line, raising concerns.
>>> The latest Featured Stock Update with an annotated graph appeared on 2/21/2012. Click here.
View all notes |
Alert me of new notes |
CANSLIM.net Company Profile |
SEC |
Zacks Reports |
StockTalk |
News |
Chart |
Request a new note
C
A N
S L
I M
|
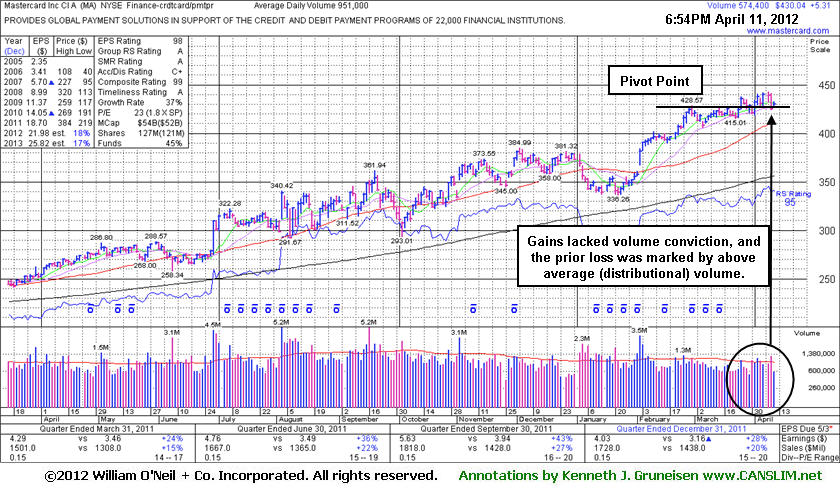
MA
-
NYSE
Mastercard Inc Cl A
DIVERSIFIED SERVICES - Business/Management Services
|
$430.04
|
+5.31
1.25% |
$432.42
|
575,332
60.50% of 50 DAV
50 DAV is 951,000
|
$442.88
-2.90%
|
3/12/2012
|
$419.86
|
PP = $428.67
|
|
MB = $450.10
|
Most Recent Note - 4/11/2012 7:06:38 PM
Y - Its gain today with light volume followed distributional action without a fresh sign of institutional buying demand. Its 50 DMA line defines near-term support to watch. See the latest FSU analysis for more details and a new annotated graph.
>>> The latest Featured Stock Update with an annotated graph appeared on 4/11/2012. Click here.
View all notes |
Alert me of new notes |
CANSLIM.net Company Profile |
SEC |
Zacks Reports |
StockTalk |
News |
Chart |
Request a new note
C
A N
S L
I M
|
Symbol/Exchange
Company Name
Industry Group |
PRICE |
CHANGE
(%Change) |
Day High |
Volume
(% DAV)
(% 50 day avg vol) |
52 Wk Hi
% From Hi |
Featured
Date |
Price
Featured |
Pivot Featured |
|
Max Buy |
MELI
-
NASDAQ
Mercadolibre Inc
INTERNET - Internet Software and; Services
|
$95.29
|
+2.01
2.15% |
$96.33
|
290,286
57.99% of 50 DAV
50 DAV is 500,600
|
$104.50
-8.81%
|
2/6/2012
|
$97.09
|
PP = $95.58
|
|
MB = $100.36
|
Most Recent Note - 4/10/2012 5:59:12 PM
G - Color code is changed to green after it violated its 50 DMA line with a damaging loss today on below average volume, raising concerns and triggering a technical sell signal. Only a prompt rebound above that short-term average would help its outlook improve. The recent low ($91.38 on 3/06/12) defines the next important support area to watch.
>>> The latest Featured Stock Update with an annotated graph appeared on 3/29/2012. Click here.
View all notes |
Alert me of new notes |
CANSLIM.net Company Profile |
SEC |
Zacks Reports |
StockTalk |
News |
Chart |
Request a new note
C
A N
S L
I M
|
MG
-
NYSE
Mistras Group Inc
DIVERSIFIED SERVICES - Bulding and Faci;ity Management Services
|
$23.55
|
+0.25
1.07% |
$23.91
|
92,646
78.85% of 50 DAV
50 DAV is 117,500
|
$26.24
-10.25%
|
3/22/2012
|
$24.96
|
PP = $26.34
|
|
MB = $27.66
|
Most Recent Note - 4/11/2012 12:28:59 PM
G - Finding support near its 50 DMA line. Color code was changed to green, meanwhile gains above its recent chart highs are needed to help its technical stance improve. It has remained below the new pivot point cited in the 3/22/12 mid-day report based on its 52-week high plus 10 cents, not triggering a technical buy signal.
>>> The latest Featured Stock Update with an annotated graph appeared on 4/2/2012. Click here.
View all notes |
Alert me of new notes |
CANSLIM.net Company Profile |
SEC |
Zacks Reports |
StockTalk |
News |
Chart |
Request a new note
C
A N
S L
I M
|
MKTX
-
NASDAQ
Marketaxess Holdings Inc
FINANCIAL SERVICES - Investment Brokerage - Nationa
|
$36.39
|
+0.18
0.50% |
$36.63
|
138,913
48.55% of 50 DAV
50 DAV is 286,100
|
$37.95
-4.11%
|
3/8/2012
|
$35.80
|
PP = $35.52
|
|
MB = $37.30
|
Most Recent Note - 4/11/2012 12:29:46 PM
Y - Volume totals have still been cooling while consolidating near its all-time high. Color code was changed to yellow after quietly dipping just under its "max buy" level. Its 50 DMA line defines important support to watch.
>>> The latest Featured Stock Update with an annotated graph appeared on 3/8/2012. Click here.
View all notes |
Alert me of new notes |
CANSLIM.net Company Profile |
SEC |
Zacks Reports |
StockTalk |
News |
Chart |
Request a new note
C
A N
S L
I M
|
NTES
-
NASDAQ
Netease.Com Inc Adr
INTERNET - Internet Information Providers
|
$57.55
|
+1.97
3.54% |
$57.85
|
490,976
72.11% of 50 DAV
50 DAV is 680,900
|
$60.47
-4.83%
|
3/19/2012
|
$56.18
|
PP = $55.10
|
|
MB = $57.86
|
Most Recent Note - 4/11/2012 5:03:50 PM
Y - Gapped up today and posted a prompt gain on lighter volume, quickly rebounding near its "max buy" level after dipping near its old highs in the $55 area on the prior session. Subsequent losses may raise greater concerns.
>>> The latest Featured Stock Update with an annotated graph appeared on 3/27/2012. Click here.
View all notes |
Alert me of new notes |
CANSLIM.net Company Profile |
SEC |
Zacks Reports |
StockTalk |
News |
Chart |
Request a new note
C
A N
S L
I M
|
RAX
-
NYSE
Rackspace Hosting Inc
INTERNET - Internet Software and; Services
|
$54.75
|
+0.10
0.18% |
$55.88
|
1,428,300
67.37% of 50 DAV
50 DAV is 2,120,100
|
$59.43
-7.87%
|
2/2/2012
|
$46.69
|
PP = $45.55
|
|
MB = $47.83
|
Most Recent Note - 4/10/2012 8:00:22 PM
G - Pulled back today with higher (near average) volume. It remains extended from its prior base. Its 50 DMA line ($53.37) defines important near-term support to watch. See the latest FSU analysis for more details and a new annotated graph.
>>> The latest Featured Stock Update with an annotated graph appeared on 4/10/2012. Click here.
View all notes |
Alert me of new notes |
CANSLIM.net Company Profile |
SEC |
Zacks Reports |
StockTalk |
News |
Chart |
Request a new note
C
A N
S L
I M
|
Symbol/Exchange
Company Name
Industry Group |
PRICE |
CHANGE
(%Change) |
Day High |
Volume
(% DAV)
(% 50 day avg vol) |
52 Wk Hi
% From Hi |
Featured
Date |
Price
Featured |
Pivot Featured |
|
Max Buy |
RGR
-
NYSE
Sturm Ruger & Co Inc
CONSUMER DURABLES - Sporting Goods
|
$49.51
|
+2.32
4.92% |
$49.58
|
504,486
144.39% of 50 DAV
50 DAV is 349,400
|
$53.29
-7.09%
|
3/22/2012
|
$46.49
|
PP = $46.78
|
|
MB = $49.12
|
Most Recent Note - 4/11/2012 12:07:55 PM
G - Rebounding today following a considerable loss on the prior session. As previously noted - "Prior high in the $46 area defines initial chart support to watch on pullbacks toward its 50 DMA line."
>>> The latest Featured Stock Update with an annotated graph appeared on 3/22/2012. Click here.
View all notes |
Alert me of new notes |
CANSLIM.net Company Profile |
SEC |
Zacks Reports |
StockTalk |
News |
Chart |
Request a new note
C
A N
S L
I M
|
RRTS
-
NYSE
Roadrunner Trans Systems
TRANSPORTATION - Air Delivery and Freight Service
|
$17.49
|
+0.71
4.23% |
$17.56
|
61,235
45.03% of 50 DAV
50 DAV is 136,000
|
$18.59
-5.92%
|
2/10/2012
|
$17.40
|
PP = $17.50
|
|
MB = $18.38
|
Most Recent Note - 4/11/2012 4:54:13 PM
G - Its rebound above the 50 DMA today indicated that it was finding prompt support, helping its outlook. Subsequent deterioration below the prior low would raise even greater concerns.
>>> The latest Featured Stock Update with an annotated graph appeared on 4/9/2012. Click here.
View all notes |
Alert me of new notes |
CANSLIM.net Company Profile |
SEC |
Zacks Reports |
StockTalk |
News |
Chart |
Request a new note
C
A N
S L
I M
|
SHFL
-
NASDAQ
Shuffle Master Inc
MANUFACTURING - Diversified Machinery
|
$17.19
|
+0.68
4.12% |
$17.34
|
883,976
134.36% of 50 DAV
50 DAV is 657,900
|
$18.77
-8.42%
|
3/6/2012
|
$17.07
|
PP = $15.25
|
|
MB = $16.01
|
Most Recent Note - 4/11/2012 11:35:52 AM
G - Rebounding today following a slump near its 50 DMA line with 4 consecutive losses since hitting its 52-week high. It is extended from any sound base pattern.
>>> The latest Featured Stock Update with an annotated graph appeared on 3/15/2012. Click here.
View all notes |
Alert me of new notes |
CANSLIM.net Company Profile |
SEC |
Zacks Reports |
StockTalk |
News |
Chart |
Request a new note
C
A N
S L
I M
|
SXCI
-
NASDAQ
S X C Health Solutions
COMPUTER SOFTWARE and SERVICES - Healthcare Information Service
|
$76.98
|
+1.12
1.48% |
$77.50
|
162,283
38.09% of 50 DAV
50 DAV is 426,000
|
$79.26
-2.88%
|
2/23/2012
|
$68.24
|
PP = $66.05
|
|
MB = $69.35
|
Most Recent Note - 4/10/2012 6:23:30 PM
G - Pulled back today with near average volume, consolidating from last week's new 52-week high. Extended from its prior base, its 50 DMA line defines support to watch on pullbacks.
>>> The latest Featured Stock Update with an annotated graph appeared on 3/6/2012. Click here.
View all notes |
Alert me of new notes |
CANSLIM.net Company Profile |
SEC |
Zacks Reports |
StockTalk |
News |
Chart |
Request a new note
C
A N
S L
I M
|
TDG
-
NYSE
Transdigm Group Inc
AEROSPACE/DEFENSE - Aerospace/Defense Products and; Services
|
$114.23
|
+2.30
2.05% |
$114.71
|
327,892
75.81% of 50 DAV
50 DAV is 432,500
|
$121.48
-5.97%
|
2/29/2012
|
$120.10
|
PP = $118.93
|
|
MB = $124.88
|
Most Recent Note - 4/10/2012 1:11:24 PM
G - Slumping further below its latest pivot point cited, not having triggered a new buy signal. Color code is changed to green as concerns are raised while violating its 50 DMA line today. Only a prompt rebound would help its outlook improve, meanwhile, further deterioration below prior lows ($110.60 on 3/20/12) may trigger a more worrisome technical sell signal.
>>> The latest Featured Stock Update with an annotated graph appeared on 3/30/2012. Click here.
View all notes |
Alert me of new notes |
CANSLIM.net Company Profile |
SEC |
Zacks Reports |
StockTalk |
News |
Chart |
Request a new note
C
A N
S L
I M
|
Symbol/Exchange
Company Name
Industry Group |
PRICE |
CHANGE
(%Change) |
Day High |
Volume
(% DAV)
(% 50 day avg vol) |
52 Wk Hi
% From Hi |
Featured
Date |
Price
Featured |
Pivot Featured |
|
Max Buy |
TIBX
-
NASDAQ
Tibco Software Inc
COMPUTER SOFTWARE and SERVICES - Business Software and Services
|
$32.36
|
+0.43
1.33% |
$32.74
|
2,221,698
88.33% of 50 DAV
50 DAV is 2,515,200
|
$33.11
-2.28%
|
3/30/2012
|
$31.01
|
PP = $31.25
|
|
MB = $32.81
|
Most Recent Note - 4/10/2012 6:26:44 PM
Y - Volume was higher and slightly above average behind today's loss and close below its "max buy" level after trading near its 52-week high. Color code is changed to yellow, however more damaging losses may raise greater concerns. Recent low ($30.03 on 4/02/12) defines a near-term support level to watch above its 50 DMA line.
>>> The latest Featured Stock Update with an annotated graph appeared on 4/5/2012. Click here.
View all notes |
Alert me of new notes |
CANSLIM.net Company Profile |
SEC |
Zacks Reports |
StockTalk |
News |
Chart |
Request a new note
C
A N
S L
I M
|
TNGO
-
NASDAQ
Tangoe Inc
COMPUTER SOFTWARE and SERVICES - Technical and System Software
|
$18.21
|
+1.16
6.80% |
$18.34
|
726,393
115.47% of 50 DAV
50 DAV is 629,100
|
$20.05
-9.18%
|
3/27/2012
|
$19.35
|
PP = $20.00
|
|
MB = $21.00
|
Most Recent Note - 4/11/2012 11:40:52 AM
G - Rebounding near its 50 DMA line today. Damaging losses on higher volume led to technical deterioration that recently raised concerns.
>>> The latest Featured Stock Update with an annotated graph appeared on 4/3/2012. Click here.
View all notes |
Alert me of new notes |
CANSLIM.net Company Profile |
SEC |
Zacks Reports |
StockTalk |
News |
Chart |
Request a new note
C
A N
S L
I M
|
TSCO
-
NASDAQ
Tractor Supply Co
SPECIALTY RETAIL - Specialty Retail, Other
|
$92.30
|
+1.46
1.61% |
$92.38
|
724,025
108.45% of 50 DAV
50 DAV is 667,600
|
$93.50
-1.28%
|
1/12/2012
|
$79.12
|
PP = $75.58
|
|
MB = $79.36
|
Most Recent Note - 4/10/2012 1:13:21 PM
G - Pulling back today after recently wedging up with light volume for another new all-time high. Its 50 DMA line defines support to watch on pullbacks.
>>> The latest Featured Stock Update with an annotated graph appeared on 2/27/2012. Click here.
View all notes |
Alert me of new notes |
CANSLIM.net Company Profile |
SEC |
Zacks Reports |
StockTalk |
News |
Chart |
Request a new note
C
A N
S L
I M
|
UA
-
NYSE
Under Armour Inc Cl A
CONSUMER NON-DURABLES - Textile - Apparel Clothing
|
$94.21
|
+1.96
2.12% |
$94.80
|
620,171
61.70% of 50 DAV
50 DAV is 1,005,100
|
$99.35
-5.17%
|
2/15/2012
|
$85.77
|
PP = $84.86
|
|
MB = $89.10
|
Most Recent Note - 4/10/2012 6:28:11 PM
G - Down today on higher (near average) volume, slumping toward its 50 DMA line. Prior gains above its pivot point did not have volume sufficient to trigger a proper technical buy signal, and recent losses on higher volume (near average, but above prior session totals) indicate distributional pressure while working on a possible new base-on-base pattern.
>>> The latest Featured Stock Update with an annotated graph appeared on 4/4/2012. Click here.
View all notes |
Alert me of new notes |
CANSLIM.net Company Profile |
SEC |
Zacks Reports |
StockTalk |
News |
Chart |
Request a new note
C
A N
S L
I M
|
UBNT
-
NASDAQ
Ubiquiti Networks Inc
TELECOMMUNICATIONS - Diversified Communication Serv
|
$32.42
|
+1.18
3.78% |
$32.42
|
553,457
156.48% of 50 DAV
50 DAV is 353,700
|
$33.97
-4.56%
|
1/27/2012
|
$22.25
|
PP = $23.14
|
|
MB = $24.30
|
Most Recent Note - 4/11/2012 5:00:21 PM
G - Posted a solid gain on higher volume. It is extended from the previous base. Its 50 DMA line defines important near-term support to watch on pullbacks.
>>> The latest Featured Stock Update with an annotated graph appeared on 3/21/2012. Click here.
View all notes |
Alert me of new notes |
CANSLIM.net Company Profile |
SEC |
Zacks Reports |
StockTalk |
News |
Chart |
Request a new note
C
A N
S L
I M
|
Symbol/Exchange
Company Name
Industry Group |
PRICE |
CHANGE
(%Change) |
Day High |
Volume
(% DAV)
(% 50 day avg vol) |
52 Wk Hi
% From Hi |
Featured
Date |
Price
Featured |
Pivot Featured |
|
Max Buy |
ULTA
-
NASDAQ
Ulta Salon Cosm & Frag
SPECIALTY RETAIL - Specialty Retail, Other
|
$93.70
|
+1.84
2.00% |
$94.17
|
338,043
48.55% of 50 DAV
50 DAV is 696,300
|
$95.62
-2.01%
|
1/11/2012
|
$71.97
|
PP = $75.80
|
|
MB = $79.59
|
Most Recent Note - 4/10/2012 6:06:19 PM
G - Down today on higher volume, encountering distributional pressure amid widespread market weakness. Its 50 DMA line defines support to watch well above its prior highs in the $75 area. It is extended from any sound base pattern.
>>> The latest Featured Stock Update with an annotated graph appeared on 2/28/2012. Click here.
View all notes |
Alert me of new notes |
CANSLIM.net Company Profile |
SEC |
Zacks Reports |
StockTalk |
News |
Chart |
Request a new note
C
A N
S L
I M
|
V
-
NYSE
Visa Inc Cl A
DIVERSIFIED SERVICES - Business/Management Services
|
$117.38
|
+0.64
0.55% |
$118.95
|
3,542,780
99.51% of 50 DAV
50 DAV is 3,560,400
|
$121.15
-3.11%
|
3/12/2012
|
$116.53
|
PP = $119.46
|
|
MB = $125.43
|
Most Recent Note - 4/10/2012 6:08:09 PM
Y - Pulled back from its all-time high with a loss on below average volume today. Wedged higher without great volume conviction behind gains in recent weeks. Its 50 DMA line defines support to watch well above prior highs in the $103-104 area.
>>> The latest Featured Stock Update with an annotated graph appeared on 3/7/2012. Click here.
View all notes |
Alert me of new notes |
CANSLIM.net Company Profile |
SEC |
Zacks Reports |
StockTalk |
News |
Chart |
Request a new note
C
A N
S L
I M
|