***Last / Change / Volume data in this table is the closing quote data***
Symbol/Exchange
Company Name
Industry Group |
PRICE |
CHANGE
(%Change) |
Day High |
Volume
(% DAV)
(% 50 day avg vol) |
52 Wk Hi
% From Hi |
Featured
Date |
Price
Featured |
Pivot Featured |
|
Max Buy |
AIXG
-
NASDAQ
Aixtron Se
ELECTRONICS - Semiconductor Equipment andamp; Mate
|
$43.40
|
-0.05
-0.12% |
$43.78
|
88,697
36.50% of 50 DAV
50 DAV is 243,000
|
$44.96
-3.47%
|
4/5/2011
|
$44.14
|
PP = $44.64
|
|
MB = $46.87
|
Most Recent Note - 4/8/2011 6:34:34 PM
Y - Small gain down today, closing -3.4% off its 52-week high. Still working on the right side of its base above prior resistance in the $38 area. Color code was changed to yellow when featured in the 4/05/11 mid-day report with pivot point cited based on its 3/03/11 high after an 8-week double bottom base pattern. Volume driven gains above its pivot point may trigger a technical buy signal, but disciplined investors will watch for proof of institutional buying demand and avoid the urge to get in "early". See the latest FSU analysis for details and an annotated graph.
>>> The latest Featured Stock Update with an annotated graph appeared on 4/5/2011. Click here.
View all notes |
Alert me of new notes |
CANSLIM.net Company Profile |
SEC |
Zacks Reports |
StockTalk |
News |
Chart |
Request a new note
C
A N
S L
I M


|
BIDU
-
NASDAQ
Baidu Inc Ads
INTERNET - Internet Information Providers
|
$145.68
|
+3.80
2.68% |
$148.92
|
16,613,635
237.43% of 50 DAV
50 DAV is 6,997,400
|
$143.48
1.53%
|
3/17/2011
|
$121.97
|
PP = $131.73
|
|
MB = $138.32
|
 Most Recent Note - 4/11/2011 11:45:21 AM
G - Gapped up and hit a new all-time high today, getting more extended from its latest base. Prior high near $131 defines initial chart support to watch above its 50 DMA line.
>>> The latest Featured Stock Update with an annotated graph appeared on 4/7/2011. Click here.
View all notes |
Alert me of new notes |
CANSLIM.net Company Profile |
SEC |
Zacks Reports |
StockTalk |
News |
Chart |
Request a new note
C
A N
S L
I M
|
CMG
-
NYSE
Chipotle Mexican Grill
LEISURE - Restaurants
|
$268.41
|
-0.83
-0.31% |
$271.59
|
475,024
42.96% of 50 DAV
50 DAV is 1,105,800
|
$282.00
-4.82%
|
4/1/2011
|
$274.00
|
PP = $275.10
|
|
MB = $288.86
|
Most Recent Note - 4/8/2011 6:13:08 PM
Y - Disciplined investors know to watch for confirming gains with well above average volume to trigger a new (or add-on) technical buy signal. It recently stalled after reaching a new all-time high without triggering a new technical buy signal.
>>> The latest Featured Stock Update with an annotated graph appeared on 3/14/2011. Click here.
View all notes |
Alert me of new notes |
CANSLIM.net Company Profile |
SEC |
Zacks Reports |
StockTalk |
News |
Chart |
Request a new note
C
A N
S L
I M
|
CTCT
-
NASDAQ
Constant Contact Inc
MEDIA - Advertising Services
|
$35.05
|
-0.15
-0.41% |
$35.28
|
223,498
52.59% of 50 DAV
50 DAV is 425,000
|
$36.33
-3.54%
|
3/22/2011
|
$33.59
|
PP = $32.49
|
|
MB = $34.11
|
Most Recent Note - 4/8/2011 6:15:05 PM
G - Holding its ground near its all-time high after enduring distributional pressure this week. Prior highs in the $32 area define support to watch above its 50 DMA line.
>>> The latest Featured Stock Update with an annotated graph appeared on 3/22/2011. Click here.
View all notes |
Alert me of new notes |
CANSLIM.net Company Profile |
SEC |
Zacks Reports |
StockTalk |
News |
Chart |
Request a new note
C
A N
S L
I M
|
CTSH
-
NASDAQ
Cognizant Tech Sol Cl A
COMPUTER SOFTWARE and SERVICES - Business Software and Services
|
$80.50
|
+0.24
0.30% |
$81.13
|
1,421,474
62.38% of 50 DAV
50 DAV is 2,278,600
|
$82.86
-2.85%
|
2/7/2011
|
$75.09
|
PP = $76.46
|
|
MB = $80.28
|
Most Recent Note - 4/8/2011 6:17:31 PM
G - Down today for a 5th consecutive loss on below average volume, consolidating near its "max buy" level above prior highs in the $77-78 area that define chart support to watch above its 50 DMA line. No resistance remains due to overhead supply.
>>> The latest Featured Stock Update with an annotated graph appeared on 3/17/2011. Click here.
View all notes |
Alert me of new notes |
CANSLIM.net Company Profile |
SEC |
Zacks Reports |
StockTalk |
News |
Chart |
Request a new note
C
A N
S L
I M
|
Symbol/Exchange
Company Name
Industry Group |
PRICE |
CHANGE
(%Change) |
Day High |
Volume
(% DAV)
(% 50 day avg vol) |
52 Wk Hi
% From Hi |
Featured
Date |
Price
Featured |
Pivot Featured |
|
Max Buy |
DECK
-
NASDAQ
Deckers Outdoor Corp
CONSUMER NON-DURABLES - Textile - Apparel Footwear
|
$88.48
|
-1.00
-1.12% |
$90.30
|
684,711
51.77% of 50 DAV
50 DAV is 1,322,600
|
$94.70
-6.57%
|
2/3/2011
|
$79.61
|
PP = $82.67
|
|
MB = $86.80
|
Most Recent Note - 4/8/2011 6:18:40 PM
G - Quietly hovering within close striking distance of its all-time high. Its choppy consolidation in recent weeks is not recognized as a sound base pattern. Its 50 DMA line defines initial chart support to watch. See the latest FSU analysis for more details and a new annotated graph.
>>> The latest Featured Stock Update with an annotated graph appeared on 4/6/2011. Click here.
View all notes |
Alert me of new notes |
CANSLIM.net Company Profile |
SEC |
Zacks Reports |
StockTalk |
News |
Chart |
Request a new note
C
A N
S L
I M
|
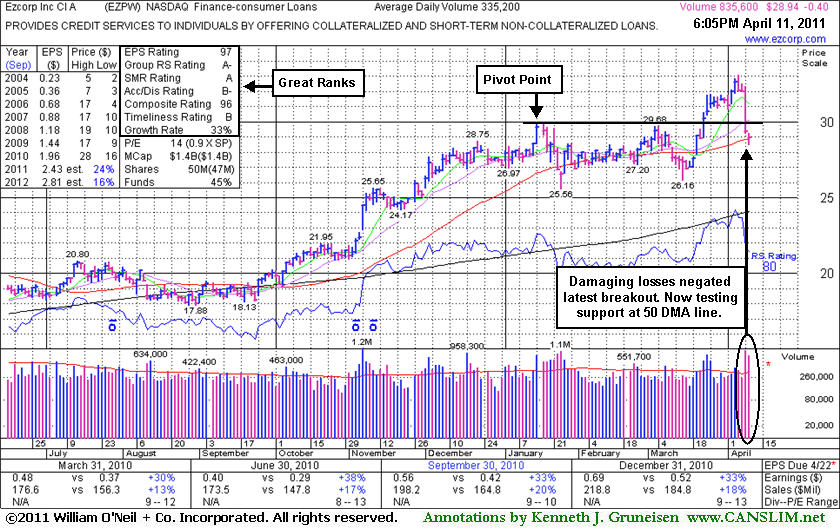
EZPW
-
NASDAQ
Ezcorp Inc Cl A
SPECIALTY RETAIL - Specialty Retail, Other
|
$28.94
|
-0.40
-1.36% |
$29.25
|
835,609
249.29% of 50 DAV
50 DAV is 335,200
|
$33.08
-12.52%
|
2/18/2011
|
$27.94
|
PP = $30.04
|
|
MB = $31.54
|
Most Recent Note - 4/11/2011 4:17:28 PM
G - Down today with above average volume, it closed near its 50 DMA line. A considerable loss on 4/08/11 with three times average volume raised concerns while it slumped below its prior high closes in the $29-30 area previously noted as important support to watch. More damaging losses may trigger more worrisome technical sell signals.
>>> The latest Featured Stock Update with an annotated graph appeared on 4/11/2011. Click here.
View all notes |
Alert me of new notes |
CANSLIM.net Company Profile |
SEC |
Zacks Reports |
StockTalk |
News |
Chart |
Request a new note
C
A N
S L
I M
|
FOSL
-
NASDAQ
Fossil Inc
CONSUMER DURABLES - Recreational Goods, Other
|
$93.32
|
+0.32
0.34% |
$94.14
|
620,176
63.58% of 50 DAV
50 DAV is 975,500
|
$95.39
-2.17%
|
2/1/2011
|
$73.30
|
PP = $74.44
|
|
MB = $78.16
|
Most Recent Note - 4/8/2011 6:21:56 PM
G - Touched a new all-time high today but finished with a small loss on light volume. It has rallied as much as +108% higher in 8 months since first featured in yellow in the 8/10/10 mid-day report (read here). It could produce more climactic gains, but recently it has been noted - "Extended from any sound base. Prior highs in the $83-85 area define chart support to watch above its 50 DMA line."
>>> The latest Featured Stock Update with an annotated graph appeared on 3/30/2011. Click here.
View all notes |
Alert me of new notes |
CANSLIM.net Company Profile |
SEC |
Zacks Reports |
StockTalk |
News |
Chart |
Request a new note
C
A N
S L
I M
|
HMSY
-
NASDAQ
H M S Holdings Corp
COMPUTER SOFTWARE and SERVICES - Healthcare Information Service
|
$81.10
|
-0.18
-0.22% |
$81.89
|
72,671
44.97% of 50 DAV
50 DAV is 161,600
|
$84.82
-4.39%
|
11/19/2010
|
$61.89
|
PP = $63.01
|
|
MB = $66.16
|
Most Recent Note - 4/8/2011 6:23:55 PM
G - Pulling back from its all-time high with a 4th consecutive loss on below average volume. It is extended from any sound base pattern. Its 50 DMA line ($75.83 now) defines support to watch on pullbacks.
>>> The latest Featured Stock Update with an annotated graph appeared on 3/25/2011. Click here.
View all notes |
Alert me of new notes |
CANSLIM.net Company Profile |
SEC |
Zacks Reports |
StockTalk |
News |
Chart |
Request a new note
C
A N
S L
I M
|
HS
-
NYSE
Healthspring Inc
HEALTH SERVICES - Health Care Plans
|
$39.00
|
+0.40
1.04% |
$39.14
|
649,570
78.30% of 50 DAV
50 DAV is 829,600
|
$40.78
-4.36%
|
3/22/2011
|
$38.29
|
PP = $38.85
|
|
MB = $40.79
|
Most Recent Note - 4/8/2011 6:25:27 PM
Y - Loss today on slightly higher volume led to a close back under its pivot point today after rallying to a new all-time high earlier this week following a technical buy signal noted on 4/01/11. Prior highs define support above its 50 DMA line and recent lows in the $35.50 area. The Public Offering completed on 3/25/11 may hinder its upward progress for the near-term, however it has been attracting top-rated funds as owners (I criteria).
>>> The latest Featured Stock Update with an annotated graph appeared on 3/23/2011. Click here.
View all notes |
Alert me of new notes |
CANSLIM.net Company Profile |
SEC |
Zacks Reports |
StockTalk |
News |
Chart |
Request a new note
C
A N
S L
I M
|
Symbol/Exchange
Company Name
Industry Group |
PRICE |
CHANGE
(%Change) |
Day High |
Volume
(% DAV)
(% 50 day avg vol) |
52 Wk Hi
% From Hi |
Featured
Date |
Price
Featured |
Pivot Featured |
|
Max Buy |
INFA
-
NASDAQ
Informatica Corp
COMPUTER SOFTWARE and SERVICES - Business Software and Services
|
$51.20
|
-0.60
-1.16% |
$52.39
|
649,895
73.05% of 50 DAV
50 DAV is 889,700
|
$52.96
-3.32%
|
3/24/2011
|
$50.04
|
PP = $49.86
|
|
MB = $52.35
|
Most Recent Note - 4/8/2011 6:26:37 PM
Y - Volume totals have been light or near average while holding its ground, consolidating within 5% of its pivot point. Triggered a technical buy signal on 3/24/11 with near minimum volume. Prior highs in the $49 area define initial support to watch above its 50 DMA line, where violations would raise concerns and may trigger technical sell signals.
>>> The latest Featured Stock Update with an annotated graph appeared on 3/28/2011. Click here.
View all notes |
Alert me of new notes |
CANSLIM.net Company Profile |
SEC |
Zacks Reports |
StockTalk |
News |
Chart |
Request a new note
C
A N
S L
I M
|
LULU
-
NASDAQ
Lululemon Athletica
MANUFACTURING - Textile Manufacturing
|
$88.71
|
-1.57
-1.74% |
$90.92
|
1,559,942
66.86% of 50 DAV
50 DAV is 2,333,200
|
$94.98
-6.60%
|
3/28/2011
|
$68.11
|
PP = $85.38
|
|
MB = $89.65
|
Most Recent Note - 4/8/2011 6:27:48 PM
G - Holding its ground near its all-time high hit this week. It is slightly extended from its latest sound base pattern. Prior highs in the $85 area define initial chart support to watch.
>>> The latest Featured Stock Update with an annotated graph appeared on 3/31/2011. Click here.
View all notes |
Alert me of new notes |
CANSLIM.net Company Profile |
SEC |
Zacks Reports |
StockTalk |
News |
Chart |
Request a new note
C
A N
S L
I M
|
MG
-
NYSE
Mistras Group Inc
DIVERSIFIED SERVICES - Bulding and Faci;ity Management Services
|
$16.59
|
+0.15
0.91% |
$16.71
|
197,440
176.13% of 50 DAV
50 DAV is 112,100
|
$17.33
-4.27%
|
3/15/2011
|
$15.48
|
PP = $15.90
|
|
MB = $16.70
|
Most Recent Note - 4/11/2011 12:09:29 PM
Y - Consolidating above prior highs and its 50 DMA line defining important support to watch on pullbacks. Its color code was changed to yellow after dipping under its "max buy" level.
>>> The latest Featured Stock Update with an annotated graph appeared on 3/15/2011. Click here.
View all notes |
Alert me of new notes |
CANSLIM.net Company Profile |
SEC |
Zacks Reports |
StockTalk |
News |
Chart |
Request a new note
C
A N
S L
I M
|
MWIV
-
NASDAQ
M W I Veterinary Supply
HEALTH SERVICES - Medical Instruments and; Supplies
|
$77.91
|
+0.89
1.16% |
$78.50
|
44,607
46.27% of 50 DAV
50 DAV is 96,400
|
$80.86
-3.65%
|
11/4/2010
|
$61.79
|
PP = $59.60
|
|
MB = $62.58
|
Most Recent Note - 4/8/2011 6:31:16 PM
G - Pulled back today for a 3rd consecutive loss. Its 50 DMA line defines important support to watch. It has been repeatedly noted - "Extended from any sound base pattern."
>>> The latest Featured Stock Update with an annotated graph appeared on 4/8/2011. Click here.
View all notes |
Alert me of new notes |
CANSLIM.net Company Profile |
SEC |
Zacks Reports |
StockTalk |
News |
Chart |
Request a new note
C
A N
S L
I M
|
OPEN
-
NASDAQ
Opentable Inc
INTERNET - Internet Software and Services
|
$107.84
|
-1.40
-1.28% |
$109.95
|
1,080,544
84.92% of 50 DAV
50 DAV is 1,272,400
|
$112.78
-4.38%
|
3/17/2011
|
$90.71
|
PP = $96.07
|
|
MB = $100.87
|
Most Recent Note - 4/8/2011 6:42:26 PM
G - Quiet gain today for its second best close ever. It is extended from its latest base, and prior highs near $96 define initial support to watch on pullbacks.
>>> The latest Featured Stock Update with an annotated graph appeared on 3/24/2011. Click here.
View all notes |
Alert me of new notes |
CANSLIM.net Company Profile |
SEC |
Zacks Reports |
StockTalk |
News |
Chart |
Request a new note
C
A N
S L
I M
|
Symbol/Exchange
Company Name
Industry Group |
PRICE |
CHANGE
(%Change) |
Day High |
Volume
(% DAV)
(% 50 day avg vol) |
52 Wk Hi
% From Hi |
Featured
Date |
Price
Featured |
Pivot Featured |
|
Max Buy |
PAY
-
NYSE
Verifone Systems Inc
COMPUTER HARDWARE - Transaction Automation Systems
|
$51.99
|
-0.17
-0.33% |
$53.53
|
1,869,169
85.47% of 50 DAV
50 DAV is 2,187,000
|
$58.88
-11.70%
|
1/27/2011
|
$41.77
|
PP = $44.97
|
|
MB = $47.22
|
Most Recent Note - 4/8/2011 6:32:50 PM
G - Loss today on lighter volume after enduring distributional pressure this week. Its 50 DMA line ($48.83 now) defines important chart support to watch.
>>> The latest Featured Stock Update with an annotated graph appeared on 4/4/2011. Click here.
View all notes |
Alert me of new notes |
CANSLIM.net Company Profile |
SEC |
Zacks Reports |
StockTalk |
News |
Chart |
Request a new note
C
A N
S L
I M
|
PCLN
-
NASDAQ
Priceline.Com Inc
INTERNET - Internet Software and Services
|
$512.45
|
+5.63
1.11% |
$512.50
|
1,074,697
89.98% of 50 DAV
50 DAV is 1,194,400
|
$522.00
-1.83%
|
1/3/2011
|
$399.55
|
PP = $428.20
|
|
MB = $449.61
|
Most Recent Note - 4/8/2011 6:37:19 PM
G - Still hovering near its 52-week high with volume totals cooling while it has been noted as extended from any sound base pattern. Its 50 DMA line has defined support throughout its advance.
>>> The latest Featured Stock Update with an annotated graph appeared on 3/21/2011. Click here.
View all notes |
Alert me of new notes |
CANSLIM.net Company Profile |
SEC |
Zacks Reports |
StockTalk |
News |
Chart |
Request a new note
C
A N
S L
I M
|
RAX
-
NYSE
Rackspace Hosting Inc
INTERNET - Internet Software and; Services
|
$42.62
|
-0.36
-0.84% |
$43.17
|
1,178,002
63.88% of 50 DAV
50 DAV is 1,844,000
|
$44.19
-3.55%
|
3/16/2011
|
$36.28
|
PP = $40.72
|
|
MB = $42.76
|
Most Recent Note - 4/8/2011 6:38:06 PM
G - Holding its ground in a tight range near all-time highs. Color code was changed to green after rising back above its "max buy" level. Approximately 40% of successful breakouts pullback and test support at prior resistance before continuing higher. As previously noted, "Prior high near $40 defines chart support to watch on pullbacks."
>>> The latest Featured Stock Update with an annotated graph appeared on 3/16/2011. Click here.
View all notes |
Alert me of new notes |
CANSLIM.net Company Profile |
SEC |
Zacks Reports |
StockTalk |
News |
Chart |
Request a new note
C
A N
S L
I M
|
TIBX
-
NASDAQ
Tibco Software Inc
COMPUTER SOFTWARE and SERVICES - Business Software and Services
|
$26.99
|
+0.15
0.56% |
$27.23
|
1,781,477
73.69% of 50 DAV
50 DAV is 2,417,600
|
$28.31
-4.65%
|
3/18/2011
|
$23.88
|
PP = $26.04
|
|
MB = $27.34
|
Most Recent Note - 4/8/2011 6:40:36 PM
Y - Down for small losses on light or average volume 5 sessions in a row. Color code was changed to yellow after pulling back just under its "max buy" level. Consolidating above prior highs in the $25-26 area defining support to watch on pullbacks.
>>> The latest Featured Stock Update with an annotated graph appeared on 3/18/2011. Click here.
View all notes |
Alert me of new notes |
CANSLIM.net Company Profile |
SEC |
Zacks Reports |
StockTalk |
News |
Chart |
Request a new note
C
A N
S L
I M
|
UA
-
NYSE
Under Armour Inc Cl A
CONSUMER NON-DURABLES - Textile - Apparel Clothing
|
$73.29
|
+1.89
2.65% |
$74.29
|
888,711
111.13% of 50 DAV
50 DAV is 799,700
|
$76.85
-4.63%
|
3/31/2011
|
$68.04
|
PP = $70.79
|
|
MB = $74.33
|
Most Recent Note - 4/11/2011 4:10:12 PM
Y - Up today with higher volume, consolidating above its pivot point and below its "max buy" level No overhead supply remains to act as resistance. Following its 4/01/11 technical breakout, its prior highs in the $70 area define support to watch.
>>> The latest Featured Stock Update with an annotated graph appeared on 4/1/2011. Click here.
View all notes |
Alert me of new notes |
CANSLIM.net Company Profile |
SEC |
Zacks Reports |
StockTalk |
News |
Chart |
Request a new note
C
A N
S L
I M
|
Symbol/Exchange
Company Name
Industry Group |
PRICE |
CHANGE
(%Change) |
Day High |
Volume
(% DAV)
(% 50 day avg vol) |
52 Wk Hi
% From Hi |
Featured
Date |
Price
Featured |
Pivot Featured |
|
Max Buy |
ULTA
-
NASDAQ
Ulta Salon Cosm & Frag
SPECIALTY RETAIL - Specialty Retail, Other
|
$51.12
|
+0.43
0.85% |
$51.82
|
576,586
91.80% of 50 DAV
50 DAV is 628,100
|
$51.72
-1.16%
|
1/6/2011
|
$36.12
|
PP = $37.34
|
|
MB = $39.21
|
Most Recent Note - 4/8/2011 6:43:58 PM
G - Touched another new all-time high today before puling back and closing with a small loss on light volume. Extended from any sound base now, its prior highs and its 50 DMA line define chart support to watch near the $44 level on pullbacks.
>>> The latest Featured Stock Update with an annotated graph appeared on 3/29/2011. Click here.
View all notes |
Alert me of new notes |
CANSLIM.net Company Profile |
SEC |
Zacks Reports |
StockTalk |
News |
Chart |
Request a new note
C
A N
S L
I M
|