You are not logged in.
This means you
CAN ONLY VIEW reports that were published prior to Tuesday, July 9, 2024.
You
MUST UPGRADE YOUR MEMBERSHIP if you want to see any current reports.
AFTER MARKET UPDATE - WEDNESDAY, APRIL 10TH, 2024
Previous After Market Report Next After Market Report >>>
|
|
|
|
DOW |
-422.16 |
38,461.51 |
-1.09% |
|
Volume |
930,533,954 |
+15% |
|
Volume |
5,322,415,800 |
+8% |
|
NASDAQ |
-136.28 |
16,170.36 |
-0.84% |
|
Advancers |
417 |
15% |
|
Advancers |
953 |
22% |
|
S&P 500 |
-49.27 |
5,160.64 |
-0.95% |
|
Decliners |
2,374 |
85% |
|
Decliners |
3,288 |
78% |
|
Russell 2000 |
-52.41 |
2,028.39 |
-2.52% |
|
52 Wk Highs |
35 |
|
|
52 Wk Highs |
36 |
|
|
S&P 600 |
-38.91 |
1,284.79 |
-2.94% |
|
52 Wk Lows |
46 |
|
|
52 Wk Lows |
188 |
|
|
Continued distributional action has signaled a shift in (M criteria) conditions from an "uptrend under pressure" to a market "correction". Use greater caution, raise cash and reduce exposure by selling any weakening stocks on a case-by-case basis.
|
 |
Leadership Waned and Volume Increased Behind Damaging Losses
Kenneth J. Gruneisen - Passed the CAN SLIM® Master's Exam
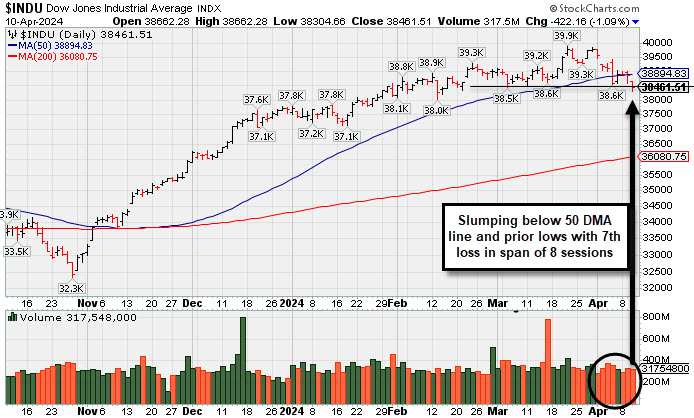
The major indices suffered damaging losses on Wednesday. Volume reported was higher than the prior session totals on the NYSE and on the Nasdaq exchange, action indicative of an increase in institutional selling pressure termed "distribution". Breadth was negative as decliners led advancers by more than a 5-1 margin on the NYSE and more than 3-1 on the Nasdaq exchange. Leadership thinned as there were only 5 high-ranked companies from the Leaders List that hit new 52-week highs and were listed on the BreakOuts Page, versus the total of 31 on the prior session. New 52-week lows totals expanded and outnumbered shrinking new 52-week highs totals on the NYSE and on the Nasdaq exchange. The major indices are in an uptrend that is under pressure (M criteria). Greater caution is important for all investors. Always stand ready to protect against losses.
PICTURED: The Dow Jones Industrial Average has slumped below its 50-day moving average (DMA) line and below recent lows.
Ten of the 11 S&P 500 sectors logged losses ranging from -0.2% to -4.1%. Stocks logged sizable declines and Treasuries settled with sharp losses following the hotter than expected March Consumer Price Index (CPI). Total CPI increased 0.4% month-over-month versus an expected 0.3% increase and core-CPI, which excludes food and energy, increased 0.4% month-over-month versus an expected 0.3% increase.
The 10-yr note yield climbed 19 basis points to 4.56%. The 2-yr note yield jumped 22 basis points to 4.97%.
Meta Platforms (META +0.57%), Amazon.com (AMZN +0.15%), NVIDIA (NVDA +1.97%), and Eli Lilly (LLY +0.63%) were winning standouts. Rocket Companies, Inc. (RKT -12.83%), WD-40 Company (WDFC-8.60%), and RH (RH-9.77%) were big decliners. |
 Kenneth J. Gruneisen started out as a licensed stockbroker in August 1987, a couple of months prior to the historic stock market crash that took the Dow Jones Industrial Average down -22.6% in a single day. He has published daily fact-based fundamental and technical analysis on high-ranked stocks online for two decades. Through FACTBASEDINVESTING.COM, Kenneth provides educational articles, news, market commentary, and other information regarding proven investment systems that work in good times and bad.
Comments contained in the body of this report are technical opinions only and are not necessarily those of Gruneisen Growth Corp. The material herein has been obtained from sources believed to be reliable and accurate, however, its accuracy and completeness cannot be guaranteed. Our firm, employees, and customers may effect transactions, including transactions contrary to any recommendation herein, or have positions in the securities mentioned herein or options with respect thereto. Any recommendation contained in this report may not be suitable for all investors and it is not to be deemed an offer or solicitation on our part with respect to the purchase or sale of any securities. |
|
 |
Energy-Linked Groups Rose Amid Widespread Losses
Kenneth J. Gruneisen - Passed the CAN SLIM® Master's Exam
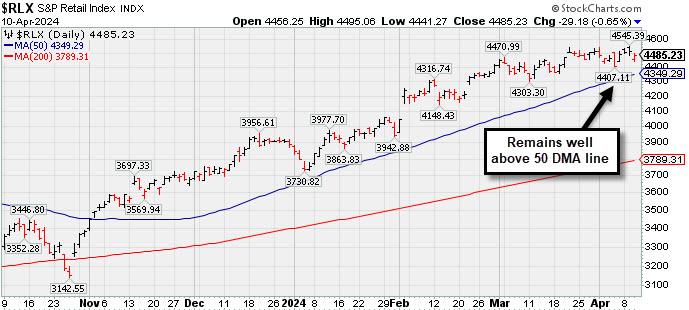
The Broker/Dealer Index ($XBD -1.17%) and the Bank Index ($BKX -3.01%) both outpaced the Retail Index ($RLX -0.65%) to the downside. The tech sector had a negative bias as the Semiconductor Index ($SOX -1.65%), Networking Index ($NWX -2.88%) and the Biotech Index ($BTK -1.60%) each lost ground. Commodity-linked groups were mixed as the Gold & Silver Index ($XAU -1.32%) fell while the Oil Services Index ($OSX +0.21%) and Integrated Oil Index ($XOI +0.43%) both posted small gains.
![]() PICTURED: The Retail Index ($RLX -0.65%) is still consolidating well above its 50-day moving average (DMA) line.
| Oil Services |
$OSX |
93.80 |
+0.20 |
+0.21% |
+11.82% |
| Integrated Oil |
$XOI |
2,247.75 |
+9.70 |
+0.43% |
+20.69% |
| Semiconductor |
$SOX |
4,790.35 |
-80.46 |
-1.65% |
+14.73% |
| Networking |
$NWX |
770.56 |
-22.82 |
-2.88% |
-7.48% |
| Broker/Dealer |
$XBD |
595.91 |
-7.04 |
-1.17% |
+6.93% |
| Retail |
$RLX |
4,485.23 |
-29.18 |
-0.65% |
+15.34% |
| Gold & Silver |
$XAU |
136.79 |
-1.83 |
-1.32% |
+8.83% |
| Bank |
$BKX |
100.30 |
-3.11 |
-3.01% |
+4.46% |
| Biotech |
$BTK |
5,183.56 |
-84.22 |
-1.60% |
-4.34% |
|
|
|
 |
Quietly Slumped Below 50-Day Moving Average Line
Kenneth J. Gruneisen - Passed the CAN SLIM® Master's Exam
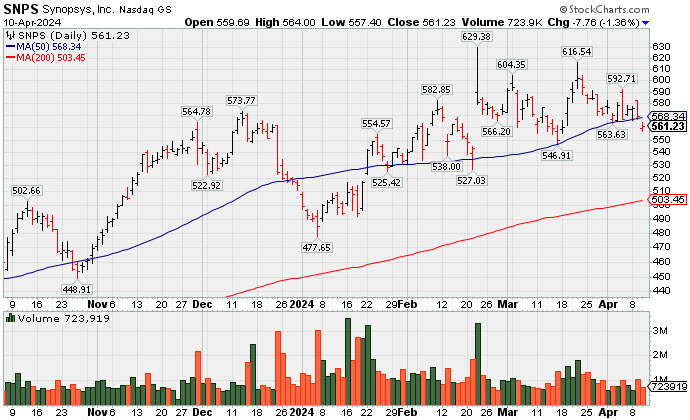
Synopsys Inc (SNPS -$8.02 or -1.41% to $560.97) has seen volume totals cooling and today it quietly slumped below its 50-day moving average (DMA) line ($568) raising concerns. The prior low ($546.91 on 3/15/24) defines the next important support where a more damaging loss would raise serious concerns and trigger a technical sell signal. Since last noted it failed to produce a strong volume-driven gain and close above the pivot point which was needed to clinch a proper technical buy signal.
SNPS reported Jan '24 quarterly earnings +36% on +21% sales revenues versus the year-ago period, its 3rd strong quarter above the +25% minimum earnings guideline (C criteria). Annual earnings growth (A criteria) has been strong and steady. It has a 99 Earnings Per Share Rating, the highest possible. The number of top-rated funds owning its shares rose from 2,896 in Mar '23 to 3,383 in Mar '24, a reassuring sign concerning the I criteria. Its current Up/Down Volume Ratio of 1.1 is an unbiased indication its shares have been under slight accumulation over the past 50 days. It has a Timeliness Rating of B and Sponsorship Rating of B.
SNPS was last shown in this FSU section in detail on 3/19/24 with an annotated graph under the headline, "Rallying From Support at 50-Day Moving Average Line". It was highlighted in yellow in the 2/22/24 mid-day report (read here) with pivot point cited based on its 2/09/24 high after a cup-with-handle base.
|
|
|
Color Codes Explained :
Y - Better candidates highlighted by our
staff of experts.
G - Previously featured
in past reports as yellow but may no longer be buyable under the
guidelines.
***Last / Change / Volume data in this table is the closing quote data***
Symbol/Exchange
Company Name
Industry Group |
PRICE |
CHANGE
(%Change) |
Day High |
Volume
(% DAV)
(% 50 day avg vol) |
52 Wk Hi
% From Hi |
Featured
Date |
Price
Featured |
Pivot Featured |
|
Max Buy |
 ANET
-
NYSE
ANET
-
NYSE
Arista Networks
Computer-Networking
|
$288.22
|
-6.53
-2.22% |
$294.58
|
1,896,880
70.18% of 50 DAV
50 DAV is 2,703,000
|
$307.74
-6.34%
|
3/18/2024
|
$188.84
|
PP = $292.76
|
|
MB = $307.40
|
Most Recent Note - 4/5/2024 7:25:06 PM
Y - Still hovering near its all-time high with recent gains lacking great volume conviction. Found support near prior highs in the $292 area and additional near-term support to watch is its 50 DMA line ($279) and an upward trendline connecting its October-March lows.
>>> FEATURED STOCK ARTICLE : Consolidating Abover Recent Highs and Above 50-Day Average - 3/26/2024 |
View all notes |
Set NEW NOTE alert |
Company Profile |
SEC
News |
Chart |
Request a new note
C
A
S
I |
NVO
-
NYSE
Novo Nordisk ADR
Medical-Ethical Drugs
|
$124.93
|
+0.07
0.06% |
$125.26
|
3,022,102
55.75% of 50 DAV
50 DAV is 5,421,000
|
$138.28
-9.65%
|
3/1/2024
|
$124.23
|
PP = $124.97
|
|
MB = $131.22
|
Most Recent Note - 4/8/2024 5:19:16 PM
Y - Posted a gain today with lighter volume. Quietly pulling back below the pivot point of the previously noted "3-weeks tight" base and testing its 50 DMA line ($124.30) which defines important near-term support.
>>> FEATURED STOCK ARTICLE : Volume Cools While Consolidating Above 50-Day Moving Average Line - 4/3/2024 |
View all notes |
Set NEW NOTE alert |
Company Profile |
SEC
News |
Chart |
Request a new note
C
A
S
I |
AXON
-
NASDAQ
Axon Enterprise
Security/Sfty
|
$318.94
|
+7.67
2.46% |
$320.34
|
502,433
101.50% of 50 DAV
50 DAV is 495,000
|
$325.63
-2.05%
|
4/5/2024
|
$309.90
|
PP = $325.73
|
|
MB = $342.02
|
Most Recent Note - 4/8/2024 5:17:45 PM
Y - Color code was changed to yellow with new pivot point cited based on its 3/04/24 high plus 10 cents. Volume totals have been cooling while hovering in a tight range near its all-time high. Volume-driven gains above the pivot point are needed to trigger a proper technical buy signal. Its 50-day moving average (DMA) line ($291) defines near-term support to watch. Fundamentals remain strong. See the latest FSU analysis for more details and a new annotated graph.
>>> FEATURED STOCK ARTICLE : Volume Totals Cooling While Building a New Base - 4/8/2024 |
View all notes |
Set NEW NOTE alert |
Company Profile |
SEC
News |
Chart |
Request a new note
C
A
S
I |
TDG
-
NYSE
TransDigm Group
Aerospace/Defense
|
$1,219.91
|
+3.98
0.33% |
$1,224.62
|
167,188
78.49% of 50 DAV
50 DAV is 213,000
|
$1,246.22
-2.11%
|
12/12/2023
|
$1,000.39
|
PP = $1,013.18
|
|
MB = $1,063.84
|
Most Recent Note - 4/9/2024 5:23:10 PM
G - Holding its ground following a noted "negative reversal" on 4/04/24 after touching a new all-time high. Its 50 DMA line ($1,173) defines near-term support to watch. See the latest FSU analysis for more details and a new annotated graph.
>>> FEATURED STOCK ARTICLE : Volume Totals Cooling While Perched Near High - 4/9/2024 |
View all notes |
Set NEW NOTE alert |
Company Profile |
SEC
News |
Chart |
Request a new note
C
A
S
I |
CRWD
-
NASDAQ
CrowdStrike Holdings
Computer Sftwr-Security
|
$312.54
|
+1.77
0.57% |
$315.08
|
1,921,378
49.70% of 50 DAV
50 DAV is 3,866,000
|
$365.00
-14.37%
|
1/2/2024
|
$246.42
|
PP = $261.91
|
|
MB = $275.01
|
Most Recent Note - 4/8/2024 5:24:35 PM
G - Still lingering below its 50 DMA ($317.59) with volume totals cooling. A rebound above the 50 DMA line is needed for its outlook to improve. It has not formed a sound base. Fundamentals remain strong after it reported Jan '24 quarterly earnings +102% on +33% sales revenues versus the year-ago period.
>>> FEATURED STOCK ARTICLE : 50-Day Moving Average Line Support Being Tested - 4/1/2024 |
View all notes |
Set NEW NOTE alert |
Company Profile |
SEC
News |
Chart |
Request a new note
C
A
S
I |
Symbol/Exchange
Company Name
Industry Group |
PRICE |
CHANGE
(%Change) |
Day High |
Volume
(% DAV)
(% 50 day avg vol) |
52 Wk Hi
% From Hi |
Featured
Date |
Price
Featured |
Pivot Featured |
|
Max Buy |
PCAR
-
NASDAQ
Paccar
Trucks and Parts-Hvy Duty
|
$118.69
|
-0.49
-0.41% |
$119.39
|
2,402,636
110.06% of 50 DAV
50 DAV is 2,183,000
|
$125.50
-5.43%
|
1/23/2024
|
$100.35
|
PP = $98.57
|
|
MB = $103.50
|
Most Recent Note - 4/9/2024 5:30:11 PM
G - Pulled back today with +13% above-average volume, retreating from its all-time high. Very extended from any sound base, its 50 DMA line ($113.37) defines near-term support to watch. Fundamentals remain strong.
>>> FEATURED STOCK ARTICLE : Hit New High With 5th Consecutive Gain - 3/21/2024 |
View all notes |
Set NEW NOTE alert |
Company Profile |
SEC
News |
Chart |
Request a new note
C
A
S
I |
HUBB
-
NYSE
Hubbell
Electrical-Power/Equipmt
|
$406.91
|
-2.26
-0.55% |
$411.51
|
348,164
78.42% of 50 DAV
50 DAV is 444,000
|
$429.61
-5.28%
|
1/30/2024
|
$343.26
|
PP = $336.83
|
|
MB = $353.67
|
Most Recent Note - 4/8/2024 5:25:52 PM
G - Holding its ground after a noted "negative reversal" at its all-time high on 4/04/24. It is very extended from the previously noted base. Its 50 DMA line ($380.73) defines important support to watch.
>>> FEATURED STOCK ARTICLE : Hubbell Perched at All-Time High After 5 Weekly Gains - 3/22/2024 |
View all notes |
Set NEW NOTE alert |
Company Profile |
SEC
News |
Chart |
Request a new note
C
A
S
I |
MANH
-
NASDAQ
Manhattan Associates
Computer Sftwr-Enterprse
|
$238.30
|
-3.88
-1.60% |
$241.04
|
222,746
58.31% of 50 DAV
50 DAV is 382,000
|
$266.94
-10.73%
|
1/31/2024
|
$240.57
|
PP = $230.71
|
|
MB = $242.25
|
Most Recent Note - 4/5/2024 7:34:27 PM
G - Sputtering beneath its 50 DMA line ($247.20) this week raising concerns. Recent lows in the $239-241 area define important near-term support where violations would raise greater concerns and trigger a worrisome technical sell signal.
>>> FEATURED STOCK ARTICLE : Manhattan Associates Consolidating Above 50-Day Moving Average - 3/25/2024 |
View all notes |
Set NEW NOTE alert |
Company Profile |
SEC
News |
Chart |
Request a new note
C
A
S
I |
USLM
-
NASDAQ
U.S. Lime & Minerals
Bldg-Cement/Concrt/Ag
|
$289.98
|
-11.23
-3.73% |
$300.65
|
34,540
138.16% of 50 DAV
50 DAV is 25,000
|
$308.00
-5.85%
|
2/9/2024
|
$254.68
|
PP = $265.09
|
|
MB = $278.34
|
 Most Recent Note - 4/10/2024 12:48:01 PM
G - Hovering in a tight range in recent weeks near its all-time high, encountering some distributional pressure. Its 50 DMA line ($275.30) defines near-term support to watch.
>>> FEATURED STOCK ARTICLE : Gain With Light Volume for Best Ever Close - 4/5/2024 |
View all notes |
Set NEW NOTE alert |
Company Profile |
SEC
News |
Chart |
Request a new note
C
A
S
I |
NOW
-
NYSE
ServiceNow
Computer Sftwr-Enterprse
|
$769.19
|
-13.03
-1.67% |
$774.95
|
847,265
73.29% of 50 DAV
50 DAV is 1,156,000
|
$815.32
-5.66%
|
2/22/2024
|
$771.75
|
PP = $815.32
|
|
MB = $856.09
|
Most Recent Note - 4/5/2024 7:22:30 PM
Y - Posted a solid gain today with average (higher) volume, finding support near its 50 DMA line ($770). Prior lows in the $730 area define the next important near-term support to watch.
>>> FEATURED STOCK ARTICLE : NOW Quietly Rebounded Above 50-Day Moving Average Line - 3/20/2024 |
View all notes |
Set NEW NOTE alert |
Company Profile |
SEC
News |
Chart |
Request a new note
C
A
S
I |
Symbol/Exchange
Company Name
Industry Group |
PRICE |
CHANGE
(%Change) |
Day High |
Volume
(% DAV)
(% 50 day avg vol) |
52 Wk Hi
% From Hi |
Featured
Date |
Price
Featured |
Pivot Featured |
|
Max Buy |
SNPS
-
NASDAQ
Synopsys
Computer Sftwr-Design
|
$560.97
|
-8.02
-1.41% |
$564.00
|
723,918
67.28% of 50 DAV
50 DAV is 1,076,000
|
$629.38
-10.87%
|
2/22/2024
|
$600.65
|
PP = $582.85
|
|
MB = $611.99
|
Most Recent Note - 4/10/2024 5:40:56 PM
G - Volume totals have been cooling and its color code is changed to green after a quiet slump below its 50 DMA line ($568) today raised concerns. The prior low ($546.91 on 3/15/23) defines the next important support where a damaging loss would raise serious concerns and trigger a more worrisome technical sell signal. See the latest FSU analysis for more details and a new annotated graph.
>>> FEATURED STOCK ARTICLE : Quietly Slumped Below 50-Day Moving Average Line - 4/10/2024 |
View all notes |
Set NEW NOTE alert |
Company Profile |
SEC
News |
Chart |
Request a new note
C
A
S
I |
PAY
-
NYSE
Paymentus Holdings
Finance-CrdtCard/PmtPr
|
$20.88
|
-0.53
-2.48% |
$21.18
|
322,100
85.44% of 50 DAV
50 DAV is 377,000
|
$25.21
-17.18%
|
3/5/2024
|
$19.97
|
PP = $18.89
|
|
MB = $19.83
|
Most Recent Note - 4/10/2024 12:55:27 PM
G - Pulling back today following 3 small gains. It is extended from the previously noted base. Its 50 DMA line ($19) defines important near-term support above prior highs in the $18 range.
>>> FEATURED STOCK ARTICLE : Consolidating After Powerful Breakout and Volume-Driven Gains - 3/27/2024 |
View all notes |
Set NEW NOTE alert |
Company Profile |
SEC
News |
Chart |
Request a new note
C
A
S
I |
HUBS
-
NYSE
HubSpot
Comp Sftwr-Spec Enterprs
|
$657.71
|
-1.42
-0.22% |
$662.78
|
364,416
68.50% of 50 DAV
50 DAV is 532,000
|
$693.85
-5.21%
|
4/4/2024
|
$686.66
|
PP = $660.10
|
|
MB = $693.11
|
Most Recent Note - 4/5/2024 11:51:26 AM
Y - Gapped up today and on track for a solid gain. On the prior session it finished in middle of its intra-day range after highlighted yellow in the mid-day report with pivot point cited based on its 2/09/24 high plus 10 cents. Hit a new 52-week high with a volume-driven gain triggering a technical buy signal after finding prompt support at its 50 DMA line ($617) in recent weeks. Reported Dec '23 quarterly earnings +59% on +24% sales revenues versus the year-ago period, its 6th consecutive quarterly comparison well above the +25% minimum guideline (C criteria). Annual earnings history (A criteria) has been strong. Faces some resistance due to old overhead supply up to the $866 level. See the latest FSU analysis for more details and a new annotated graph.
>>> FEATURED STOCK ARTICLE : Encountered Distributional Pressure and Finished Below Pivot Point - 4/4/2024 |
View all notes |
Set NEW NOTE alert |
Company Profile |
SEC
News |
Chart |
Request a new note
C
A
S
I |
|
|
|
THESE ARE NOT BUY RECOMMENDATIONS!
Comments contained in the body of this report are technical
opinions only. The material herein has been obtained
from sources believed to be reliable and accurate, however,
its accuracy and completeness cannot be guaranteed.
This site is not an investment advisor, hence it does
not endorse or recommend any securities or other investments.
Any recommendation contained in this report may not
be suitable for all investors and it is not to be deemed
an offer or solicitation on our part with respect to
the purchase or sale of any securities. All trademarks,
service marks and trade names appearing in this report
are the property of their respective owners, and are
likewise used for identification purposes only.
This report is a service available
only to active Paid Premium Members.
You may opt-out of receiving report notifications
at any time. Questions or comments may be submitted
by writing to Premium Membership Services 665 S.E. 10 Street, Suite 201 Deerfield Beach, FL 33441-5634 or by calling 1-800-965-8307
or 954-785-1121.
|
|
|