You are not logged in.
This means you
CAN ONLY VIEW reports that were published prior to Monday, April 14, 2025.
You
MUST UPGRADE YOUR MEMBERSHIP if you want to see any current reports.
AFTER MARKET UPDATE - WEDNESDAY, APRIL 10TH, 2013
Previous After Market Report Next After Market Report >>>
|
|
|
|
DOW |
+128.78 |
14,802.24 |
+0.88% |
|
Volume |
700,646,700 |
+5% |
|
Volume |
1,706,350,870 |
+18% |
|
NASDAQ |
+59.39 |
3,297.25 |
+1.83% |
|
Advancers |
2,293 |
73% |
|
Advancers |
1,984 |
77% |
|
S&P 500 |
+19.12 |
1,587.73 |
+1.22% |
|
Decliners |
731 |
23% |
|
Decliners |
531 |
21% |
|
Russell 2000 |
+16.75 |
946.09 |
+1.80% |
|
52 Wk Highs |
312 |
|
|
52 Wk Highs |
171 |
|
|
S&P 600 |
+9.06 |
528.77 |
+1.74% |
|
52 Wk Lows |
7 |
|
|
52 Wk Lows |
13 |
|
|
 |
Major Averages Extend Rally To New Record Highs
Kenneth J. Gruneisen - Passed the CAN SLIM® Master's Exam
The S&P 500 Index finally broke above its all-time high as the major averages posted their 3rd consecutive gains. Wednesday's volume totals on the exchanges were reported higher than the prior session totals on the NYSE and on the Nasdaq exchange, indicating an encouraging pick up in institutional buying demand. Breadth was positive as advancers led decliners by 3 to 1 on the NYSE and by a nearly 4-1 margin on the Nasdaq exchange. New 52-week highs solidly outnumbered new 52-week lows on the NYSE and on the Nasdaq exchange. There were 69 high-ranked companies from the CANSLIM.net Leaders List making new 52-week highs and appearing on the CANSLIM.net BreakOuts Page, up from the prior session total of 43 stocks. There were gains for 15 of the 16 high-ranked companies currently included on the Featured Stocks Page.
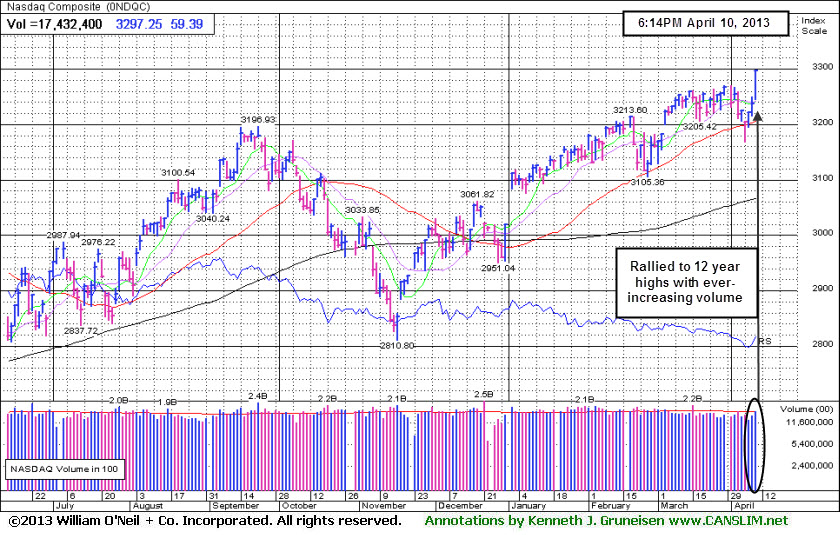
The S&P 500 Index set a record high as it increased 19 points to 1,587. The Dow gained points to 14,802 and the Nasdaq Composite Index touched a fresh 12-year high as it rallied 59 points to 3,297.
Monetary policy was in focus. The March FOMC minutes revealed a majority of the Fed remains opposed to tapering its bond-buying program. In addition, Japan's Prime Minister reiterated the nation's bold stimulus measures and said its central bank will take the needed steps to achieve its 2% inflation target. Pac-Rim economic data added to the positive tone after Chinese imports of key commodities unexpectedly rebounded in March. Meanwhile, Washington's budget battle came back into focus after President Obama's latest budget proposal reignited deficit-reduction talks.
Earnings results were in the spotlight. CarMax Inc (KMX +3.91%) rose after posting a +13% gain in earnings. Fastenal Co (FAST -3.46%) doubled its quarterly dividend, but lost ground after missing on revenue estimates. In addition, Family Dollar Stores Inc (FDO +1.07%) rose although it posted a disappointing profit tally and full-year outlook. Overall, the resurgence of the risk trade pushed all sectors higher. Technology was the best performing group as Apple Inc (AAPL +2.92%) and Intel Corp (INTC +2.78%). Health Care also paced the advance thanks to a rally in pharmaceutical stocks as Merck & Co (MRK +2.9%) and Pfizer Inc (PFE +3%) both rallied.
After the close, a notable earnings report was due out from Bed Bath & Beyond Inc (BBBY +1.55%) and Chevron Corp (CVX +0.84%) was expected to post its interim results.
In fixed-income, Treasury prices declined and a government auction of 10-year debt drew weaker-than-average demand. The 10-year note was down 15/32 to yield 1.81% and the 30-year bond lost over a full point to yield 3.01%.
Recent distribution days and weak action among high-ranked stocks has resulted in a noted shift in the market's (M criteria) stance. Early last week the rally was noted as "under pressure", and Friday's early action had the look of a more worrisome market "correction" before a resilient finish from the major indices provided some encouraging signs. Members have been reminded repeatedly that any sustainable rally requires a healthy crop of companies hitting new 52-week highs, so it is always essential to see meaningful leadership (stocks hitting new 52-week highs). Investors who should be watchful for individual issues flashing sell signals.
Watch for an announcement via email concerning the next WEBCAST. The webcast will also be available via an updated link highlighted at the top of the Premium Member Homepage.
PICTURED: The Nasdaq Composite Index rallied to 12-year highs with ever increasing volume behind its recent 3-day winning streak. It found support near its 50-day moving average (DMA) line during the latest consolidation.
|
 Kenneth J. Gruneisen started out as a licensed stockbroker in August 1987, a couple of months prior to the historic stock market crash that took the Dow Jones Industrial Average down -22.6% in a single day. He has published daily fact-based fundamental and technical analysis on high-ranked stocks online for two decades. Through FACTBASEDINVESTING.COM, Kenneth provides educational articles, news, market commentary, and other information regarding proven investment systems that work in good times and bad.
Comments contained in the body of this report are technical opinions only and are not necessarily those of Gruneisen Growth Corp. The material herein has been obtained from sources believed to be reliable and accurate, however, its accuracy and completeness cannot be guaranteed. Our firm, employees, and customers may effect transactions, including transactions contrary to any recommendation herein, or have positions in the securities mentioned herein or options with respect thereto. Any recommendation contained in this report may not be suitable for all investors and it is not to be deemed an offer or solicitation on our part with respect to the purchase or sale of any securities. |
|
 |
Tech Sector Led Rally
Kenneth J. Gruneisen - Passed the CAN SLIM® Master's Exam
Tech stocks were strong as the Networking Index ($NWX +3.96%), Biotechnology Index ($BTK +2.69%), Internet Index ($IIX +2.04%), and Semiconductor Index ($SOX +2.15%) posted unanimous gains of greater than +2%. The Gold & Silver Index ($XAU -3.41%) was a standout decliner as it erased the bulk of its prior gain. The Retail Index ($RLX +1.03%) was a positive influence on the major averages along with financial shares as the Broker/Dealer Index ($XBD +2.26%) and Bank Index ($BKX +1.37%) tallied solid gains. The Oil Services Index ($OSX +1.45%) posted a decent gain while the Integrated Oil Index ($XOI +0.11%) finished flat. The Healthcare Index ($HMO +1.22%) rounded out the mostly positive session with a gain.
Charts courtesy www.stockcharts.com
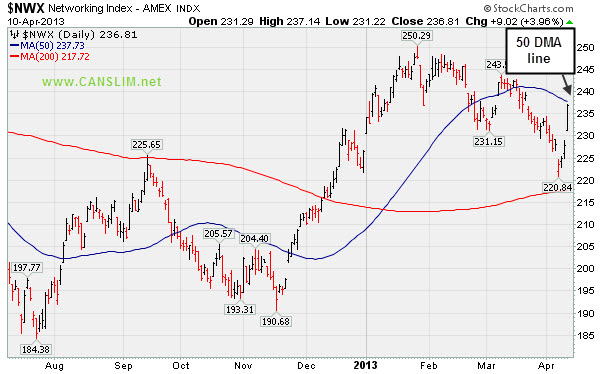
PICTURED: The Networking Index ($NWX +3.96%) rallied toward its 50-day moviong average (DMA) line.
| Oil Services |
$OSX |
252.62 |
+3.62 |
+1.45% |
+14.74% |
| Healthcare |
$HMO |
2,954.07 |
+35.56 |
+1.22% |
+17.50% |
| Integrated Oil |
$XOI |
1,349.77 |
+1.48 |
+0.11% |
+8.69% |
| Semiconductor |
$SOX |
437.34 |
+9.20 |
+2.15% |
+13.87% |
| Networking |
$NWX |
236.81 |
+9.02 |
+3.96% |
+4.53% |
| Internet |
$IIX |
362.93 |
+7.25 |
+2.04% |
+10.99% |
| Broker/Dealer |
$XBD |
112.40 |
+2.48 |
+2.26% |
+19.16% |
| Retail |
$RLX |
738.33 |
+7.54 |
+1.03% |
+13.06% |
| Gold & Silver |
$XAU |
125.27 |
-4.42 |
-3.41% |
-24.35% |
| Bank |
$BKX |
56.87 |
+0.77 |
+1.37% |
+10.90% |
| Biotech |
$BTK |
1,849.06 |
+48.38 |
+2.69% |
+19.52% |
|
|
|
 |
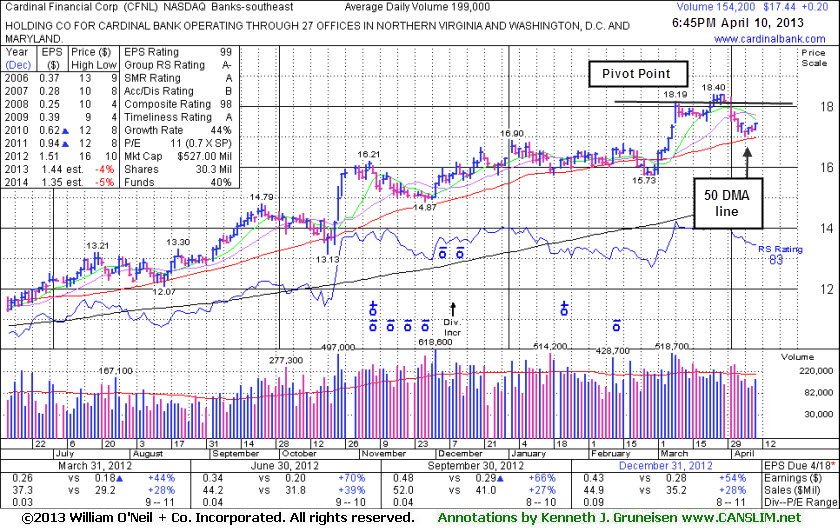
Found Support at 50 DMA Line After No Proper Breakout From "3-Weeks Tight" Base
Kenneth J. Gruneisen - Passed the CAN SLIM® Master's Exam
Cardinal Financial Corp (CFNL +$0.20 or +1.16% to $17.44) recently retreated near its 50-day moving average (DMA) line, enduring distributional pressure instead of rallying from the previously noted advanced "3-weeks tight" base. Previously noted - "Gains above the pivot point must have at least the bare minimum +40% above average volume, preferably more, to trigger a proper new (or add-on) technical buy signal."
It was last shown in this FSU section on 3/18/13 with an annotated graph under the headline, "Holding Ground in Tight Range Following Technical Breakout." The high-ranked leader hailing from the Banks - Southeast industry group reported earnings +54% on +28% sales revenues for the quarter ended December 31, 2012 versus the year ago period, continuing its track record of strong quarterly earnings comparisons underpinned by encouraging sales revenues increases. It has earned the highest possible 99 Earnings Per Share (EPS) rank, and its high ranks and long term earnings history help it match favorably with the C and A criteria. The number of top-rated funds owning its shares rose from 172 in Sep '11 to 219 in Mar '13, a reassuring trend concerning the I criteria. Its small supply (S criteria) of only 30.3 millions shares outstanding is a favorable characteristic, yet it can contribute to greater price volatility in the event of institutional accumulation or distributional pressure.
|
|
|
Color Codes Explained :
Y - Better candidates highlighted by our
staff of experts.
G - Previously featured
in past reports as yellow but may no longer be buyable under the
guidelines.
***Last / Change / Volume data in this table is the closing quote data***
Symbol/Exchange
Company Name
Industry Group |
PRICE |
CHANGE
(%Change) |
Day High |
Volume
(% DAV)
(% 50 day avg vol) |
52 Wk Hi
% From Hi |
Featured
Date |
Price
Featured |
Pivot Featured |
|
Max Buy |
AMBA
-
NASDAQ
Ambarella Inc
ELECTRONICS - Semiconductor - Specialized
|
$13.98
|
-0.19
-1.34% |
$14.30
|
619,705
189.80% of 50 DAV
50 DAV is 326,500
|
$16.00
-12.63%
|
3/26/2013
|
$15.31
|
PP = $14.83
|
|
MB = $15.57
|
Most Recent Note - 4/8/2013 11:52:41 AM
Y - Halted its slide after enduring distributional pressure last week, abruptly retreating from its 52-week high after a "negative reversal" on 4/01/13. Disciplined investors avoid chasing extended stocks and always limit losses by selling if any stock falls more than -7% from their purchase price.
>>> The latest Featured Stock Update with an annotated graph appeared on 3/26/2013. Click here.
View all notes |
Alert me of new notes |
CANSLIM.net Company Profile |
SEC |
Zacks Reports |
StockTalk |
News |
Chart |
Request a new note
C
A N
S L
I M


|
CELG
-
NASDAQ
Celgene Corp
DRUGS - Drug Manufacturers - Major
|
$120.81
|
+4.20
3.60% |
$120.84
|
2,587,370
82.08% of 50 DAV
50 DAV is 3,152,100
|
$118.78
1.71%
|
3/27/2013
|
$113.24
|
PP = $115.54
|
|
MB = $121.32
|
Most Recent Note - 4/5/2013 6:32:33 PM
Y - It recently wedged to new highs from an advanced "3-weeks tight" base with only average volume behind its gains above the new pivot point cited based on its 3/14/13 high plus 10 cents.
>>> The latest Featured Stock Update with an annotated graph appeared on 3/28/2013. Click here.
View all notes |
Alert me of new notes |
CANSLIM.net Company Profile |
SEC |
Zacks Reports |
StockTalk |
News |
Chart |
Request a new note
C
A N
S L
I M
|
CFNL
-
NASDAQ
Cardinal Financial Corp
BANKING - Regional - Southeast Banks
|
$17.44
|
+0.20
1.16% |
$17.44
|
155,165
77.97% of 50 DAV
50 DAV is 199,000
|
$18.40
-5.22%
|
3/22/2013
|
$17.99
|
PP = $18.29
|
|
MB = $19.20
|
Most Recent Note - 4/5/2013 6:33:51 PM
Y - Retreated near its 50 DMA line, enduring recent distributional pressure instead of rallying from the previously noted advanced "3-weeks tight" base. Previously noted - "Gains above the pivot point must have at least the bare minimum +40% above average volume, preferably more, to trigger a proper new (or add-on) technical buy signal."
>>> The latest Featured Stock Update with an annotated graph appeared on 4/10/2013. Click here.
View all notes |
Alert me of new notes |
CANSLIM.net Company Profile |
SEC |
Zacks Reports |
StockTalk |
News |
Chart |
Request a new note
C
A N
S L
I M
|
CMCSA
-
NASDAQ
Comcast Corp Cl A
MEDIA - CATV Systems
|
$41.62
|
+0.34
0.81% |
$41.78
|
13,239,055
92.49% of 50 DAV
50 DAV is 14,314,800
|
$42.61
-2.34%
|
12/3/2012
|
$37.08
|
PP = $38.06
|
|
MB = $39.96
|
Most Recent Note - 4/9/2013 12:50:13 PM
G - Hovering near its 52-week high after finding recent support and rallying from its 50 DMA line. Relative Strength Rating is at 82, above the 80+ guideline for buy candidates. However, fundamental concerns remain since it reported earnings +11% on +6% sales revenues for the Dec '12 quarter, below the +25% minimum guideline (C criteria).
>>> The latest Featured Stock Update with an annotated graph appeared on 3/19/2013. Click here.
View all notes |
Alert me of new notes |
CANSLIM.net Company Profile |
SEC |
Zacks Reports |
StockTalk |
News |
Chart |
Request a new note
C
A N
S L
I M
|
EVER
-
NYSE
Everbank Financial Corp
BANKING
|
$15.07
|
+0.04
0.27% |
$15.45
|
706,989
75.67% of 50 DAV
50 DAV is 934,300
|
$17.29
-12.84%
|
3/4/2013
|
$15.38
|
PP = $15.83
|
|
MB = $16.62
|
Most Recent Note - 4/9/2013 12:52:24 PM
G - Still holding its ground near its 50 DMA line ($15.14 now). That important short-term average has acted as support since damaging losses violated prior highs in the $16 area raising concerns while completely negating its prior technical breakout. Its Relative Strength (RS) rating has slumped to 73, below the 80+ minimum guideline for buy candidates.
>>> The latest Featured Stock Update with an annotated graph appeared on 4/2/2013. Click here.
View all notes |
Alert me of new notes |
CANSLIM.net Company Profile |
SEC |
Zacks Reports |
StockTalk |
News |
Chart |
Request a new note
C
A N
S L
I M
|
Symbol/Exchange
Company Name
Industry Group |
PRICE |
CHANGE
(%Change) |
Day High |
Volume
(% DAV)
(% 50 day avg vol) |
52 Wk Hi
% From Hi |
Featured
Date |
Price
Featured |
Pivot Featured |
|
Max Buy |
FLT
-
NYSE
Fleetcor Technologies
DIVERSIFIED SERVICES - Business/Management Services
|
$78.36
|
+1.28
1.66% |
$78.87
|
882,834
108.68% of 50 DAV
50 DAV is 812,300
|
$78.37
-0.01%
|
3/21/2013
|
$71.14
|
PP = $73.00
|
|
MB = $76.65
|
Most Recent Note - 4/5/2013 12:09:36 PM
Y - Color code is changed to yellow while retreating below its "max buy" level, but recent distributional pressure is raising concerns for the market and all stocks. Prior high in the $72 area defines near-term support to watch on pullbacks.
>>> The latest Featured Stock Update with an annotated graph appeared on 3/21/2013. Click here.
View all notes |
Alert me of new notes |
CANSLIM.net Company Profile |
SEC |
Zacks Reports |
StockTalk |
News |
Chart |
Request a new note
C
A N
S L
I M
|
LNKD
-
NYSE
Linkedin Corp Class A
INTERNET - Internet Information Providers
|
$177.31
|
+5.24
3.05% |
$177.47
|
1,451,057
58.81% of 50 DAV
50 DAV is 2,467,500
|
$184.15
-3.71%
|
2/8/2013
|
$147.04
|
PP = $127.55
|
|
MB = $133.93
|
Most Recent Note - 4/5/2013 6:35:46 PM
G - Consolidating for just a couple of weeks, extended from any sound base pattern and well above its 50 DMA line which defines important near term support to watch. See the latest FSU analysis for more details and a new annotated graph.
>>> The latest Featured Stock Update with an annotated graph appeared on 4/5/2013. Click here.
View all notes |
Alert me of new notes |
CANSLIM.net Company Profile |
SEC |
Zacks Reports |
StockTalk |
News |
Chart |
Request a new note
C
A N
S L
I M
|
MIDD
-
NASDAQ
Middleby Corp
MANUFACTURING - Diversified Machinery
|
$147.52
|
+2.28
1.57% |
$147.78
|
115,582
126.18% of 50 DAV
50 DAV is 91,600
|
$154.74
-4.67%
|
10/8/2012
|
$118.46
|
PP = $122.67
|
|
MB = $128.80
|
Most Recent Note - 4/8/2013 5:52:53 PM
G - Recently slumping below its 50 DMA line raising concerns with losses on light volume. Fundamental concerns were recently noted.
>>> The latest Featured Stock Update with an annotated graph appeared on 3/25/2013. Click here.
View all notes |
Alert me of new notes |
CANSLIM.net Company Profile |
SEC |
Zacks Reports |
StockTalk |
News |
Chart |
Request a new note
C
A N
S L
I M
|
MNTX
-
NASDAQ
Manitex International
MANUFACTURING - Diversified Machinery
|
$11.86
|
+0.53
4.68% |
$11.96
|
110,899
54.60% of 50 DAV
50 DAV is 203,100
|
$13.14
-9.74%
|
3/20/2013
|
$11.29
|
PP = $12.05
|
|
MB = $12.65
|
Most Recent Note - 4/9/2013 12:48:19 PM
Y - Rallying up from support at its 50 DMA line. Recent low ($10.21 on 4/04/13) defines important near-term support below its 50 DMA line. Disciplined investors avoid chasing extended stocks and always limit losses by selling if any stock falls more than -7% from their purchase price.
>>> The latest Featured Stock Update with an annotated graph appeared on 3/20/2013. Click here.
View all notes |
Alert me of new notes |
CANSLIM.net Company Profile |
SEC |
Zacks Reports |
StockTalk |
News |
Chart |
Request a new note
C
A N
S L
I M
|
MRLN
-
NASDAQ
Marlin Business Services
DIVERSIFIED SERVICES - Rental and Leasing Services
|
$23.14
|
+1.16
5.28% |
$23.35
|
16,925
70.52% of 50 DAV
50 DAV is 24,000
|
$23.98
-3.50%
|
3/15/2013
|
$22.29
|
PP = $23.18
|
|
MB = $24.34
|
Most Recent Note - 4/9/2013 6:59:18 PM
Y - Consolidating above its 50 DMA line, still perched within close striking distance of its 52-week high. Previously noted - "Subsequent volume-driven gains above the pivot point could help clinch a more convincing technical buy signal." See the latest FSU analysis for more details and a new annotated graph.
>>> The latest Featured Stock Update with an annotated graph appeared on 4/9/2013. Click here.
View all notes |
Alert me of new notes |
CANSLIM.net Company Profile |
SEC |
Zacks Reports |
StockTalk |
News |
Chart |
Request a new note
C
A N
S L
I M
|
Symbol/Exchange
Company Name
Industry Group |
PRICE |
CHANGE
(%Change) |
Day High |
Volume
(% DAV)
(% 50 day avg vol) |
52 Wk Hi
% From Hi |
Featured
Date |
Price
Featured |
Pivot Featured |
|
Max Buy |
MWIV
-
NASDAQ
M W I Veterinary Supply
HEALTH SERVICES - Medical Instruments and; Supplies
|
$129.79
|
+0.05
0.04% |
$130.72
|
73,329
125.56% of 50 DAV
50 DAV is 58,400
|
$137.18
-5.39%
|
3/4/2013
|
$130.90
|
PP = $129.45
|
|
MB = $135.92
|
Most Recent Note - 4/9/2013 12:56:23 PM
Y - Consolidating above its 50 DMA line and above its pivot point with volume totals cooling while staying in a very tight trading range in recent weeks, building on a base-on-base type pattern.
>>> The latest Featured Stock Update with an annotated graph appeared on 4/4/2013. Click here.
View all notes |
Alert me of new notes |
CANSLIM.net Company Profile |
SEC |
Zacks Reports |
StockTalk |
News |
Chart |
Request a new note
C
A N
S L
I M
|
N
-
NYSE
Netsuite Inc
DIVERSIFIED SERVICES - Business/Management Services
|
$79.17
|
+1.58
2.04% |
$79.40
|
178,752
47.11% of 50 DAV
50 DAV is 379,400
|
$80.33
-1.44%
|
12/12/2012
|
$64.75
|
PP = $67.12
|
|
MB = $70.48
|
Most Recent Note - 4/8/2013 5:54:49 PM
G - It is extended from its prior base and pulled back from all-time highs last week after a streak of 7 consecutive weekly gains. Its 50 DMA line defines important near-term support to watch.
>>> The latest Featured Stock Update with an annotated graph appeared on 4/1/2013. Click here.
View all notes |
Alert me of new notes |
CANSLIM.net Company Profile |
SEC |
Zacks Reports |
StockTalk |
News |
Chart |
Request a new note
C
A N
S L
I M
|
NSR
-
NYSE
Neustar Inc
TELECOMMUNICATIONS - Diversified Communication Serv
|
$44.07
|
+0.43
0.99% |
$44.27
|
384,037
81.47% of 50 DAV
50 DAV is 471,400
|
$47.24
-6.71%
|
3/8/2013
|
$44.99
|
PP = $47.34
|
|
MB = $49.71
|
Most Recent Note - 4/4/2013 12:57:48 PM
G - Color code is changed to green while slumping below its 50 DMA line and undercutting its prior lows, weakness raising concerns and triggering technical sell signals. Its Relative Strength rating has slumped to 63, well below the 80+ minimum guideline for buy candidates.
>>> The latest Featured Stock Update with an annotated graph appeared on 3/27/2013. Click here.
View all notes |
Alert me of new notes |
CANSLIM.net Company Profile |
SEC |
Zacks Reports |
StockTalk |
News |
Chart |
Request a new note
C
A N
S L
I M
|
PRLB
-
NYSE
Proto Labs Inc
MANUFACTURING - Small Tools and Accessories
|
$52.23
|
+5.11
10.84% |
$52.49
|
1,378,056
295.97% of 50 DAV
50 DAV is 465,600
|
$53.91
-3.12%
|
4/10/2013
|
$49.97
|
PP = $54.01
|
|
MB = $56.71
|
 Most Recent Note - 4/10/2013 12:47:00 PM
Y - Color code is changed to yellow with pivot point cited based on its 2/13/13 high plus 10 cents. Volume-driven gains above the pivot point are needed to trigger a technical buy signal. Found support at its 50 DMA line and today's gain is clearing recent highs while rallying toward its 52-week high. Last noted in the 2/14/13 mid-day report with caution while retreating following a considerable "breakaway gap". Reported earnings +121% on +31% sales revenues for the quarter ended December 31, 2012 versus the year ago period, marking a 3rd consecutive quarter with earnings increases above the +25% minimum guideline (C criteria) and helping it match up better with the fact-based investment system's winning models. Completed a new Public Offering on 11/15/12.
b
There are no Featured Stock Updates™ available for this stock at this time. You may request one by clicking the Request a New Note link below
View all notes |
Alert me of new notes |
CANSLIM.net Company Profile |
SEC |
Zacks Reports |
StockTalk |
News |
Chart |
Request a new note
C
A N
S L
I M
|
RRTS
-
NYSE
Roadrunner Trans Systems
TRANSPORTATION - Air Delivery and Freight Service
|
$23.53
|
+0.50
2.17% |
$23.58
|
434,368
239.85% of 50 DAV
50 DAV is 181,100
|
$23.71
-0.76%
|
4/3/2013
|
$22.77
|
PP = $23.75
|
|
MB = $24.94
|
Most Recent Note - 4/5/2013 12:24:26 PM
Y - Holding its ground stubbornly and perched within close striking distance of its 52-week high. Disciplined investors will watch for volume-driven gains above its pivot point which are still needed to trigger a new technical buy signal. Fundamentals remain strong enough to still satisfy the C and A criteria, however decelerating sales revenues and earnings increases in sequential quarterly comparisons through the Dec '12 quarter is a concern. Completed a new Public Offering on 12/06/12 and, technically, it broke out above previously stubborn resistance in $19 area with volume-driven gains in January. See the latest FSU analysis for more details and a new annotated graph.
>>> The latest Featured Stock Update with an annotated graph appeared on 4/3/2013. Click here.
View all notes |
Alert me of new notes |
CANSLIM.net Company Profile |
SEC |
Zacks Reports |
StockTalk |
News |
Chart |
Request a new note
C
A N
S L
I M
|
Symbol/Exchange
Company Name
Industry Group |
PRICE |
CHANGE
(%Change) |
Day High |
Volume
(% DAV)
(% 50 day avg vol) |
52 Wk Hi
% From Hi |
Featured
Date |
Price
Featured |
Pivot Featured |
|
Max Buy |
VRX
-
NYSE
Valeant Pharmaceuticals
DRUGS - Drug Manufacturers - Other
|
$73.00
|
+0.88
1.22% |
$73.19
|
799,729
56.92% of 50 DAV
50 DAV is 1,405,000
|
$76.56
-4.65%
|
12/20/2012
|
$60.24
|
PP = $61.21
|
|
MB = $64.27
|
Most Recent Note - 4/8/2013 5:51:08 PM
G - Consolidating above its 50 DMA line defining important near term support following loss with heavy volume on M&A news. See latest FSU analysis for more details and a new annotated graph.
>>> The latest Featured Stock Update with an annotated graph appeared on 4/8/2013. Click here.
View all notes |
Alert me of new notes |
CANSLIM.net Company Profile |
SEC |
Zacks Reports |
StockTalk |
News |
Chart |
Request a new note
C
A N
S L
I M
|
|
|
|
THESE ARE NOT BUY RECOMMENDATIONS!
Comments contained in the body of this report are technical
opinions only. The material herein has been obtained
from sources believed to be reliable and accurate, however,
its accuracy and completeness cannot be guaranteed.
This site is not an investment advisor, hence it does
not endorse or recommend any securities or other investments.
Any recommendation contained in this report may not
be suitable for all investors and it is not to be deemed
an offer or solicitation on our part with respect to
the purchase or sale of any securities. All trademarks,
service marks and trade names appearing in this report
are the property of their respective owners, and are
likewise used for identification purposes only.
This report is a service available
only to active Paid Premium Members.
You may opt-out of receiving report notifications
at any time. Questions or comments may be submitted
by writing to Premium Membership Services 665 S.E. 10 Street, Suite 201 Deerfield Beach, FL 33441-5634 or by calling 1-800-965-8307
or 954-785-1121.
|
|
|

