You are not logged in.
This means you
CAN ONLY VIEW reports that were published prior to Monday, April 14, 2025.
You
MUST UPGRADE YOUR MEMBERSHIP if you want to see any current reports.
AFTER MARKET UPDATE - TUESDAY, APRIL 9TH, 2013
Previous After Market Report Next After Market Report >>>
|
|
|
|
DOW |
+59.98 |
14,673.46 |
+0.41% |
|
Volume |
669,916,590 |
+15% |
|
Volume |
1,448,217,770 |
+13% |
|
NASDAQ |
+15.61 |
3,237.86 |
+0.48% |
|
Advancers |
1,738 |
56% |
|
Advancers |
1,115 |
43% |
|
S&P 500 |
+5.54 |
1,568.61 |
+0.35% |
|
Decliners |
1,250 |
40% |
|
Decliners |
1,353 |
53% |
|
Russell 2000 |
-2.15 |
929.34 |
-0.23% |
|
52 Wk Highs |
216 |
|
|
52 Wk Highs |
89 |
|
|
S&P 600 |
-2.47 |
519.71 |
-0.47% |
|
52 Wk Lows |
11 |
|
|
52 Wk Lows |
25 |
|
|
 |
Dow Rallies for Another Record High
Kenneth J. Gruneisen - Passed the CAN SLIM® Master's Exam
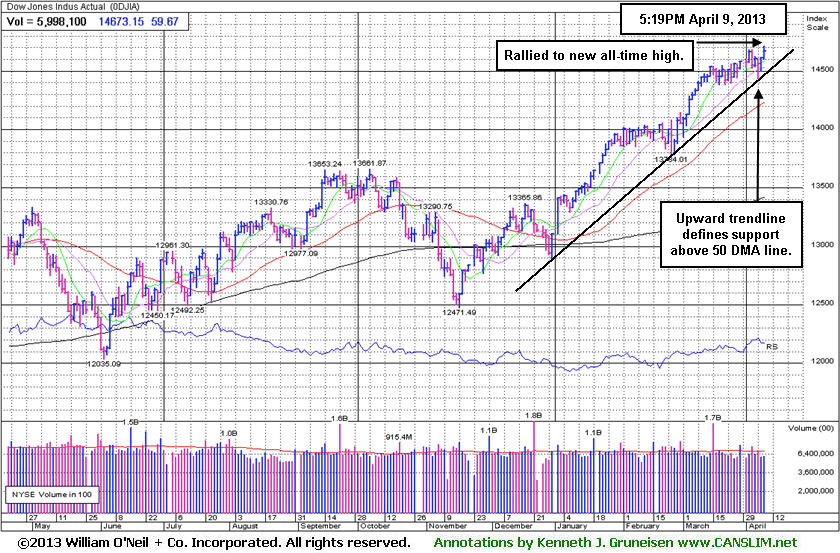
The major averages tallied gains as stocks continued to rebound from last week's losses. The Dow gained nearly 60 points to reach a new record closing high at 14,673. Tuesday's volume totals on the exchanges were reported higher than the prior session totals on the NYSE and on the Nasdaq exchange, indicating an encouraging pick up in institutional buying demand. Breadth was positive on the NYSE as advancers led decliners by 3 to 2, however decliners edged out advancers by a 7-6 margin on the Nasdaq exchange. New 52-week highs solidly outnumbered new 52-week lows on the NYSE and on the Nasdaq exchange. There were 43 high-ranked companies from the CANSLIM.net Leaders List making new 52-week highs and appearing on the CANSLIM.net BreakOuts Page, up from the prior session total of 30 stocks. However, there were gains for only 3 of the 15 high-ranked companies currently included on the Featured Stocks Page.
The major averages finished in positive territory as encouraging economic reports overseas offset disappointing U.S. data. Pressure to tighten monetary policy in China eased after a report showed the increase in consumer prices slowed more-than-anticipated in March. Meanwhile, a rebound in U.K. industrial production reduced fears of a triple-dip recession. On the U.S. economic front, wholesale inventories dropped in February by the most in a year and a half while small business confidence fell in March for the first time in four months.
Seven of 10 sectors in the S&P 500 were higher on the session. Materials were the best performing group with Freeport-McMoRan Copper & Gold inc (FCX +4.13%). Technology stocks also staged a rally as Microsoft Corp (MSFT +3.57%) and Intel Corp (INTC +3.13%). Utilities lagged behind with SCANA Corp (SCG -1.42%) and Duke Energy Corp (DUK -0.53%). Alcoa Inc (AA +1.82%) traded higher after adjusted earnings topped expectations.
The spotlight now turns to Wednesday's release of the FOMC minutes as investors focus on the Fed's future plans for its monthly bond-buying program.
Treasury prices fell and an auction of 3-year government debt drew the lowest demand in over a year. The 10-year note was down 1/32 to yield 1.75% and the 30-year bond lost 13/32 to yield 2.93%.
Recent distribution days and weak action among high-ranked stocks has resulted in a noted shift in the market's (M criteria) stance. Early last week the rally was noted as "under pressure", and Friday's early action had the look of a more worrisome market "correction" before a resilient finish from the major indices provided some encouraging signs. Members have been reminded repeatedly that any sustainable rally requires a healthy crop of companies hitting new 52-week highs, so it is always essential to see meaningful leadership (stocks hitting new 52-week highs). Investors who should be watchful for individual issues flashing sell signals.
Watch for an announcement via email concerning the next WEBCAST. The webcast will also be available via an updated link highlighted at the top of the Premium Member Homepage.
PICTURED: The Dow Jones Industrial Average rallied for a new all-time high. It has formed an upward trendline which defines initial support above its 50-day moving average (DMA) line.
|
 Kenneth J. Gruneisen started out as a licensed stockbroker in August 1987, a couple of months prior to the historic stock market crash that took the Dow Jones Industrial Average down -22.6% in a single day. He has published daily fact-based fundamental and technical analysis on high-ranked stocks online for two decades. Through FACTBASEDINVESTING.COM, Kenneth provides educational articles, news, market commentary, and other information regarding proven investment systems that work in good times and bad.
Comments contained in the body of this report are technical opinions only and are not necessarily those of Gruneisen Growth Corp. The material herein has been obtained from sources believed to be reliable and accurate, however, its accuracy and completeness cannot be guaranteed. Our firm, employees, and customers may effect transactions, including transactions contrary to any recommendation herein, or have positions in the securities mentioned herein or options with respect thereto. Any recommendation contained in this report may not be suitable for all investors and it is not to be deemed an offer or solicitation on our part with respect to the purchase or sale of any securities. |
|
 |
Defensive, Financial, Energy, and Tech Groups Posted Gains
Kenneth J. Gruneisen - Passed the CAN SLIM® Master's Exam
Defensive groups were standout gainers on Tuesday as the Gold & Silver Index ($XAU +4.01%) set a strong pace coming off last week's lows and the Healthcare Index ($HMO +1.41%) rallied toward its recent high. The Bank Index ($BKX +0.65%) and the Broker/Dealer Index ($XBD +0.41%) also posted gains as the financial sector provided a positive influence on the major averages. Energy-related stock rallied and gave the Oil Services Index ($OSX +0.46%) and the Integrated Oil Index ($XOI +0.96%) a boost. The Semiconductor Index ($SOX +0.94%) and the Networking Index ($NWX +1.27%) led the tech sector higher while the Internet Index ($IIX +0.54%) posted a smaller gain. Meanwhile, the Biotechnology Index ($BTK -0.70%) lost ground and the Retail Index ($RLX -0.16%) edged lower.
Charts courtesy www.stockcharts.com
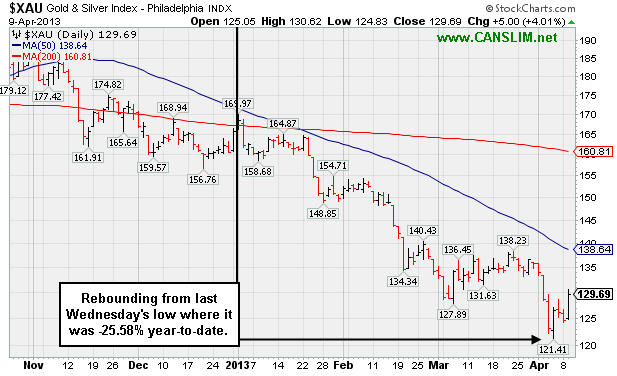
PICTURED: The Gold & Silver Index ($XAU +4.01%) was a standout gainer on Tuesday, rebounding from last Wednesday's low close where it was -25.58% year-to-date.
| Oil Services |
$OSX |
249.00 |
+1.14 |
+0.46% |
+13.10% |
| Healthcare |
$HMO |
2,918.51 |
+40.57 |
+1.41% |
+16.08% |
| Integrated Oil |
$XOI |
1,348.29 |
+12.77 |
+0.96% |
+8.57% |
| Semiconductor |
$SOX |
428.14 |
+3.97 |
+0.94% |
+11.48% |
| Networking |
$NWX |
227.79 |
+2.86 |
+1.27% |
+0.55% |
| Internet |
$IIX |
355.68 |
+1.92 |
+0.54% |
+8.77% |
| Broker/Dealer |
$XBD |
109.92 |
+0.45 |
+0.41% |
+16.53% |
| Retail |
$RLX |
730.79 |
-1.18 |
-0.16% |
+11.90% |
| Gold & Silver |
$XAU |
129.69 |
+5.00 |
+4.01% |
-21.68% |
| Bank |
$BKX |
56.10 |
+0.36 |
+0.65% |
+9.40% |
| Biotech |
$BTK |
1,800.68 |
-12.63 |
-0.70% |
+16.40% |
|
|
|
 |
Consolidating Following "Negative Reversal" at 52-Week High
Kenneth J. Gruneisen - Passed the CAN SLIM® Master's Exam
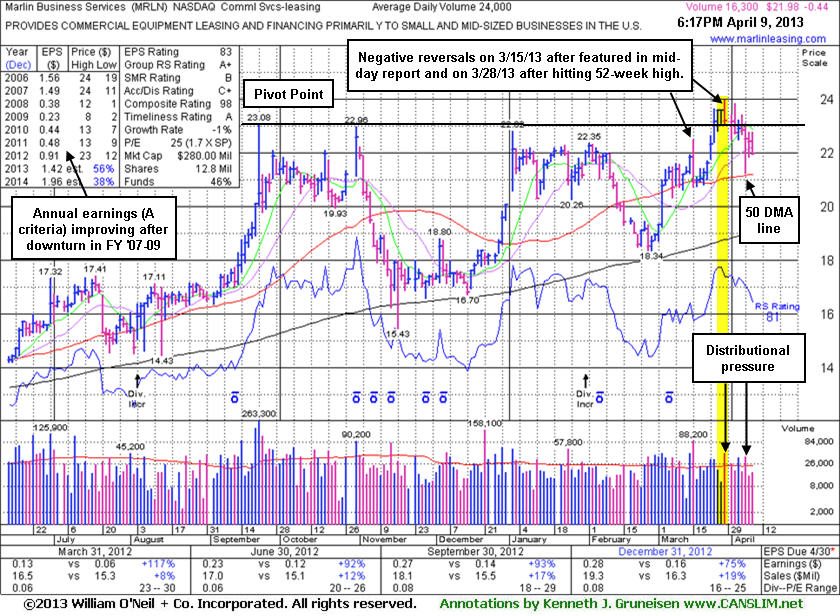
Marlin Business Services (MRLN -$0.44 or -1.96% to $21.98) has been holding its ground well above its 50-day moving average (DMA) line, still perched within close striking distance of its 52-week high. It has endured distributional pressure in recent weeks and was repeatedly noted - "Subsequent volume-driven gains above the pivot point could help clinch a more convincing technical buy signal."
When approaching its 52-week high it tallied volume-driven gains, but it was noted on 3/25/13 - "Action is indicative of institutional accumulation, however it closed the session 2 cents below the pivot point cited". Subsequent gains lacked volume conviction (see yellow highlighted area) and on 3/28/13 it erased early gains for a "negative reversal" and worrisome loss on above average volume. Negative reversals as a stock reaches new highs are signs of distributional pressure, when plenty of institutional selling pressure offsets all buying demand, instead of seeing a powerful momentum-driven breakout.
MRLN was last seen in this FSU section on 3/15/13 with an annotated graph under the headline, "Worrisome Negative Reversal After Strong Start Challenging Highs". It had been highlighted in yellow with pivot point cited based on its 9/21/12 high plus 10 cents in the 3/15/13 mid-day report but erased early gains for a "negative reversal" and worrisome loss on above average volume. Members were previously reminded - "Disciplined investors know that there is no advantage to getting in "early" before a technical breakout proves that fresh institutional buying demand is lurking. Watch for for it to make a stand and produce subsequent volume-driven gains for new high (N criteria) above the pivot point to trigger a technical buy signal before action may be justified under the fact-based investment system."
It found support near its 200-day moving average (DMA) line in recent months. Recent quarterly comparisons through Dec '12 show strong earnings increases above the +25% minimum guideline satisfying the C criteria. Annual earnings (A criteria) growth has improved following the downturn in FY '08 and '09. The Commercial Services - Leasing group has a high 96 Group Relative Strength Rating, a good sign concerning the L criteria. With only 9.18 million shares (S criteria) in the publicly traded float it may be particularly volatile in the event of any institutional buying or selling. The number of top-rated funds owning its shares rose from 111 in Mar '12 to 143 in Mar '13, a reassuring sign concerning the I criteria. Its current Up/Down Volume Ratio of 1.3 is also an unbiased bullish indication that its shares have been under accumulation over the past 50 days.
|
|
|
Color Codes Explained :
Y - Better candidates highlighted by our
staff of experts.
G - Previously featured
in past reports as yellow but may no longer be buyable under the
guidelines.
***Last / Change / Volume data in this table is the closing quote data***
Symbol/Exchange
Company Name
Industry Group |
PRICE |
CHANGE
(%Change) |
Day High |
Volume
(% DAV)
(% 50 day avg vol) |
52 Wk Hi
% From Hi |
Featured
Date |
Price
Featured |
Pivot Featured |
|
Max Buy |
AMBA
-
NASDAQ
Ambarella Inc
ELECTRONICS - Semiconductor - Specialized
|
$14.17
|
-0.19
-1.32% |
$14.36
|
375,490
117.16% of 50 DAV
50 DAV is 320,500
|
$16.00
-11.44%
|
3/26/2013
|
$15.31
|
PP = $14.83
|
|
MB = $15.57
|
Most Recent Note - 4/8/2013 11:52:41 AM
Y - Halted its slide after enduring distributional pressure last week, abruptly retreating from its 52-week high after a "negative reversal" on 4/01/13. Disciplined investors avoid chasing extended stocks and always limit losses by selling if any stock falls more than -7% from their purchase price.
>>> The latest Featured Stock Update with an annotated graph appeared on 3/26/2013. Click here.
View all notes |
Alert me of new notes |
CANSLIM.net Company Profile |
SEC |
Zacks Reports |
StockTalk |
News |
Chart |
Request a new note
C
A N
S L
I M


|
CELG
-
NASDAQ
Celgene Corp
DRUGS - Drug Manufacturers - Major
|
$116.61
|
-0.11
-0.09% |
$117.31
|
1,634,599
50.72% of 50 DAV
50 DAV is 3,223,000
|
$118.78
-1.83%
|
3/27/2013
|
$113.24
|
PP = $115.54
|
|
MB = $121.32
|
Most Recent Note - 4/5/2013 6:32:33 PM
Y - It recently wedged to new highs from an advanced "3-weeks tight" base with only average volume behind its gains above the new pivot point cited based on its 3/14/13 high plus 10 cents.
>>> The latest Featured Stock Update with an annotated graph appeared on 3/28/2013. Click here.
View all notes |
Alert me of new notes |
CANSLIM.net Company Profile |
SEC |
Zacks Reports |
StockTalk |
News |
Chart |
Request a new note
C
A N
S L
I M
|
CFNL
-
NASDAQ
Cardinal Financial Corp
BANKING - Regional - Southeast Banks
|
$17.24
|
-0.04
-0.23% |
$17.38
|
114,018
56.81% of 50 DAV
50 DAV is 200,700
|
$18.40
-6.30%
|
3/22/2013
|
$17.99
|
PP = $18.29
|
|
MB = $19.20
|
Most Recent Note - 4/5/2013 6:33:51 PM
Y - Retreated near its 50 DMA line, enduring recent distributional pressure instead of rallying from the previously noted advanced "3-weeks tight" base. Previously noted - "Gains above the pivot point must have at least the bare minimum +40% above average volume, preferably more, to trigger a proper new (or add-on) technical buy signal."
>>> The latest Featured Stock Update with an annotated graph appeared on 3/18/2013. Click here.
View all notes |
Alert me of new notes |
CANSLIM.net Company Profile |
SEC |
Zacks Reports |
StockTalk |
News |
Chart |
Request a new note
C
A N
S L
I M
|
CMCSA
-
NASDAQ
Comcast Corp Cl A
MEDIA - CATV Systems
|
$41.28
|
-0.35
-0.84% |
$41.82
|
11,575,702
81.00% of 50 DAV
50 DAV is 14,291,200
|
$42.61
-3.12%
|
12/3/2012
|
$37.08
|
PP = $38.06
|
|
MB = $39.96
|
 Most Recent Note - 4/9/2013 12:50:13 PM
G - Hovering near its 52-week high after finding recent support and rallying from its 50 DMA line. Relative Strength Rating is at 82, above the 80+ guideline for buy candidates. However, fundamental concerns remain since it reported earnings +11% on +6% sales revenues for the Dec '12 quarter, below the +25% minimum guideline (C criteria).
>>> The latest Featured Stock Update with an annotated graph appeared on 3/19/2013. Click here.
View all notes |
Alert me of new notes |
CANSLIM.net Company Profile |
SEC |
Zacks Reports |
StockTalk |
News |
Chart |
Request a new note
C
A N
S L
I M
|
EVER
-
NYSE
Everbank Financial Corp
BANKING
|
$15.03
|
+0.03
0.20% |
$15.19
|
289,749
30.90% of 50 DAV
50 DAV is 937,700
|
$17.29
-13.07%
|
3/4/2013
|
$15.38
|
PP = $15.83
|
|
MB = $16.62
|
Most Recent Note - 4/9/2013 12:52:24 PM
G - Still holding its ground near its 50 DMA line ($15.14 now). That important short-term average has acted as support since damaging losses violated prior highs in the $16 area raising concerns while completely negating its prior technical breakout. Its Relative Strength (RS) rating has slumped to 73, below the 80+ minimum guideline for buy candidates.
>>> The latest Featured Stock Update with an annotated graph appeared on 4/2/2013. Click here.
View all notes |
Alert me of new notes |
CANSLIM.net Company Profile |
SEC |
Zacks Reports |
StockTalk |
News |
Chart |
Request a new note
C
A N
S L
I M
|
Symbol/Exchange
Company Name
Industry Group |
PRICE |
CHANGE
(%Change) |
Day High |
Volume
(% DAV)
(% 50 day avg vol) |
52 Wk Hi
% From Hi |
Featured
Date |
Price
Featured |
Pivot Featured |
|
Max Buy |
FLT
-
NYSE
Fleetcor Technologies
DIVERSIFIED SERVICES - Business/Management Services
|
$77.08
|
+0.64
0.84% |
$77.52
|
616,794
75.99% of 50 DAV
50 DAV is 811,700
|
$78.37
-1.65%
|
3/21/2013
|
$71.14
|
PP = $73.00
|
|
MB = $76.65
|
Most Recent Note - 4/5/2013 12:09:36 PM
Y - Color code is changed to yellow while retreating below its "max buy" level, but recent distributional pressure is raising concerns for the market and all stocks. Prior high in the $72 area defines near-term support to watch on pullbacks.
>>> The latest Featured Stock Update with an annotated graph appeared on 3/21/2013. Click here.
View all notes |
Alert me of new notes |
CANSLIM.net Company Profile |
SEC |
Zacks Reports |
StockTalk |
News |
Chart |
Request a new note
C
A N
S L
I M
|
LNKD
-
NYSE
Linkedin Corp Class A
INTERNET - Internet Information Providers
|
$172.07
|
-0.05
-0.03% |
$175.50
|
2,247,808
91.40% of 50 DAV
50 DAV is 2,459,400
|
$184.15
-6.56%
|
2/8/2013
|
$147.04
|
PP = $127.55
|
|
MB = $133.93
|
Most Recent Note - 4/5/2013 6:35:46 PM
G - Consolidating for just a couple of weeks, extended from any sound base pattern and well above its 50 DMA line which defines important near term support to watch. See the latest FSU analysis for more details and a new annotated graph.
>>> The latest Featured Stock Update with an annotated graph appeared on 4/5/2013. Click here.
View all notes |
Alert me of new notes |
CANSLIM.net Company Profile |
SEC |
Zacks Reports |
StockTalk |
News |
Chart |
Request a new note
C
A N
S L
I M
|
MIDD
-
NASDAQ
Middleby Corp
MANUFACTURING - Diversified Machinery
|
$145.24
|
-1.21
-0.83% |
$147.34
|
32,584
35.11% of 50 DAV
50 DAV is 92,800
|
$154.74
-6.14%
|
10/8/2012
|
$118.46
|
PP = $122.67
|
|
MB = $128.80
|
Most Recent Note - 4/8/2013 5:52:53 PM
G - Recently slumping below its 50 DMA line raising concerns with losses on light volume. Fundamental concerns were recently noted.
>>> The latest Featured Stock Update with an annotated graph appeared on 3/25/2013. Click here.
View all notes |
Alert me of new notes |
CANSLIM.net Company Profile |
SEC |
Zacks Reports |
StockTalk |
News |
Chart |
Request a new note
C
A N
S L
I M
|
MNTX
-
NASDAQ
Manitex International
MANUFACTURING - Diversified Machinery
|
$11.33
|
+0.46
4.23% |
$11.50
|
75,514
37.13% of 50 DAV
50 DAV is 203,400
|
$13.14
-13.77%
|
3/20/2013
|
$11.29
|
PP = $12.05
|
|
MB = $12.65
|
Most Recent Note - 4/9/2013 12:48:19 PM
Y - Rallying up from support at its 50 DMA line. Recent low ($10.21 on 4/04/13) defines important near-term support below its 50 DMA line. Disciplined investors avoid chasing extended stocks and always limit losses by selling if any stock falls more than -7% from their purchase price.
>>> The latest Featured Stock Update with an annotated graph appeared on 3/20/2013. Click here.
View all notes |
Alert me of new notes |
CANSLIM.net Company Profile |
SEC |
Zacks Reports |
StockTalk |
News |
Chart |
Request a new note
C
A N
S L
I M
|
MRLN
-
NASDAQ
Marlin Business Services
DIVERSIFIED SERVICES - Rental and Leasing Services
|
$21.98
|
-0.44
-1.96% |
$22.77
|
16,344
68.10% of 50 DAV
50 DAV is 24,000
|
$23.98
-8.34%
|
3/15/2013
|
$22.29
|
PP = $23.18
|
|
MB = $24.34
|
Most Recent Note - 4/9/2013 6:59:18 PM
Y - Consolidating above its 50 DMA line, still perched within close striking distance of its 52-week high. Previously noted - "Subsequent volume-driven gains above the pivot point could help clinch a more convincing technical buy signal." See the latest FSU analysis for more details and a new annotated graph.
>>> The latest Featured Stock Update with an annotated graph appeared on 4/9/2013. Click here.
View all notes |
Alert me of new notes |
CANSLIM.net Company Profile |
SEC |
Zacks Reports |
StockTalk |
News |
Chart |
Request a new note
C
A N
S L
I M
|
Symbol/Exchange
Company Name
Industry Group |
PRICE |
CHANGE
(%Change) |
Day High |
Volume
(% DAV)
(% 50 day avg vol) |
52 Wk Hi
% From Hi |
Featured
Date |
Price
Featured |
Pivot Featured |
|
Max Buy |
MWIV
-
NASDAQ
M W I Veterinary Supply
HEALTH SERVICES - Medical Instruments and; Supplies
|
$129.74
|
-0.92
-0.70% |
$132.78
|
56,679
97.55% of 50 DAV
50 DAV is 58,100
|
$137.18
-5.42%
|
3/4/2013
|
$130.90
|
PP = $129.45
|
|
MB = $135.92
|
Most Recent Note - 4/9/2013 12:56:23 PM
Y - Consolidating above its 50 DMA line and above its pivot point with volume totals cooling while staying in a very tight trading range in recent weeks, building on a base-on-base type pattern.
>>> The latest Featured Stock Update with an annotated graph appeared on 4/4/2013. Click here.
View all notes |
Alert me of new notes |
CANSLIM.net Company Profile |
SEC |
Zacks Reports |
StockTalk |
News |
Chart |
Request a new note
C
A N
S L
I M
|
N
-
NYSE
Netsuite Inc
DIVERSIFIED SERVICES - Business/Management Services
|
$77.59
|
-0.06
-0.08% |
$78.09
|
206,143
53.70% of 50 DAV
50 DAV is 383,900
|
$80.33
-3.41%
|
12/12/2012
|
$64.75
|
PP = $67.12
|
|
MB = $70.48
|
Most Recent Note - 4/8/2013 5:54:49 PM
G - It is extended from its prior base and pulled back from all-time highs last week after a streak of 7 consecutive weekly gains. Its 50 DMA line defines important near-term support to watch.
>>> The latest Featured Stock Update with an annotated graph appeared on 4/1/2013. Click here.
View all notes |
Alert me of new notes |
CANSLIM.net Company Profile |
SEC |
Zacks Reports |
StockTalk |
News |
Chart |
Request a new note
C
A N
S L
I M
|
NSR
-
NYSE
Neustar Inc
TELECOMMUNICATIONS - Diversified Communication Serv
|
$43.64
|
-0.06
-0.14% |
$43.98
|
290,861
61.54% of 50 DAV
50 DAV is 472,600
|
$47.24
-7.62%
|
3/8/2013
|
$44.99
|
PP = $47.34
|
|
MB = $49.71
|
Most Recent Note - 4/4/2013 12:57:48 PM
G - Color code is changed to green while slumping below its 50 DMA line and undercutting its prior lows, weakness raising concerns and triggering technical sell signals. Its Relative Strength rating has slumped to 63, well below the 80+ minimum guideline for buy candidates.
>>> The latest Featured Stock Update with an annotated graph appeared on 3/27/2013. Click here.
View all notes |
Alert me of new notes |
CANSLIM.net Company Profile |
SEC |
Zacks Reports |
StockTalk |
News |
Chart |
Request a new note
C
A N
S L
I M
|
RRTS
-
NYSE
Roadrunner Trans Systems
TRANSPORTATION - Air Delivery and Freight Service
|
$23.03
|
-0.12
-0.52% |
$23.29
|
84,053
46.34% of 50 DAV
50 DAV is 181,400
|
$23.71
-2.87%
|
4/3/2013
|
$22.77
|
PP = $23.75
|
|
MB = $24.94
|
Most Recent Note - 4/5/2013 12:24:26 PM
Y - Holding its ground stubbornly and perched within close striking distance of its 52-week high. Disciplined investors will watch for volume-driven gains above its pivot point which are still needed to trigger a new technical buy signal. Fundamentals remain strong enough to still satisfy the C and A criteria, however decelerating sales revenues and earnings increases in sequential quarterly comparisons through the Dec '12 quarter is a concern. Completed a new Public Offering on 12/06/12 and, technically, it broke out above previously stubborn resistance in $19 area with volume-driven gains in January. See the latest FSU analysis for more details and a new annotated graph.
>>> The latest Featured Stock Update with an annotated graph appeared on 4/3/2013. Click here.
View all notes |
Alert me of new notes |
CANSLIM.net Company Profile |
SEC |
Zacks Reports |
StockTalk |
News |
Chart |
Request a new note
C
A N
S L
I M
|
VRX
-
NYSE
Valeant Pharmaceuticals
DRUGS - Drug Manufacturers - Other
|
$72.12
|
+0.00
0.00% |
$72.26
|
1,034,198
73.34% of 50 DAV
50 DAV is 1,410,100
|
$76.56
-5.80%
|
12/20/2012
|
$60.24
|
PP = $61.21
|
|
MB = $64.27
|
Most Recent Note - 4/8/2013 5:51:08 PM
G - Consolidating above its 50 DMA line defining important near term support following loss with heavy volume on M&A news. See latest FSU analysis for more details and a new annotated graph.
>>> The latest Featured Stock Update with an annotated graph appeared on 4/8/2013. Click here.
View all notes |
Alert me of new notes |
CANSLIM.net Company Profile |
SEC |
Zacks Reports |
StockTalk |
News |
Chart |
Request a new note
C
A N
S L
I M
|
Symbol/Exchange
Company Name
Industry Group |
PRICE |
CHANGE
(%Change) |
Day High |
Volume
(% DAV)
(% 50 day avg vol) |
52 Wk Hi
% From Hi |
Featured
Date |
Price
Featured |
Pivot Featured |
|
Max Buy |
|
|
|
THESE ARE NOT BUY RECOMMENDATIONS!
Comments contained in the body of this report are technical
opinions only. The material herein has been obtained
from sources believed to be reliable and accurate, however,
its accuracy and completeness cannot be guaranteed.
This site is not an investment advisor, hence it does
not endorse or recommend any securities or other investments.
Any recommendation contained in this report may not
be suitable for all investors and it is not to be deemed
an offer or solicitation on our part with respect to
the purchase or sale of any securities. All trademarks,
service marks and trade names appearing in this report
are the property of their respective owners, and are
likewise used for identification purposes only.
This report is a service available
only to active Paid Premium Members.
You may opt-out of receiving report notifications
at any time. Questions or comments may be submitted
by writing to Premium Membership Services 665 S.E. 10 Street, Suite 201 Deerfield Beach, FL 33441-5634 or by calling 1-800-965-8307
or 954-785-1121.
|
|
|

