You are not logged in.
This means you
CAN ONLY VIEW reports that were published prior to Monday, April 14, 2025.
You
MUST UPGRADE YOUR MEMBERSHIP if you want to see any current reports.
AFTER MARKET UPDATE - FRIDAY, APRIL 9TH, 2010
Previous After Market Report Next After Market Report >>>
|
|
|
|
DOW |
+70.28 |
10,997.35 |
+0.64% |
|
Volume |
967,760,910 |
-7% |
|
Volume |
2,119,459,910 |
-10% |
|
NASDAQ |
+17.24 |
2,454.05 |
+0.71% |
|
Advancers |
2,050 |
65% |
|
Advancers |
1,470 |
52% |
|
S&P 500 |
+7.93 |
1,194.37 |
+0.67% |
|
Decliners |
966 |
31% |
|
Decliners |
1,206 |
43% |
|
Russell 2000 |
+3.31 |
702.95 |
+0.47% |
|
52 Wk Highs |
368 |
|
|
52 Wk Highs |
181 |
|
|
S&P 600 |
+1.80 |
372.41 |
+0.49% |
|
52 Wk Lows |
5 |
|
|
52 Wk Lows |
3 |
|
|
 |
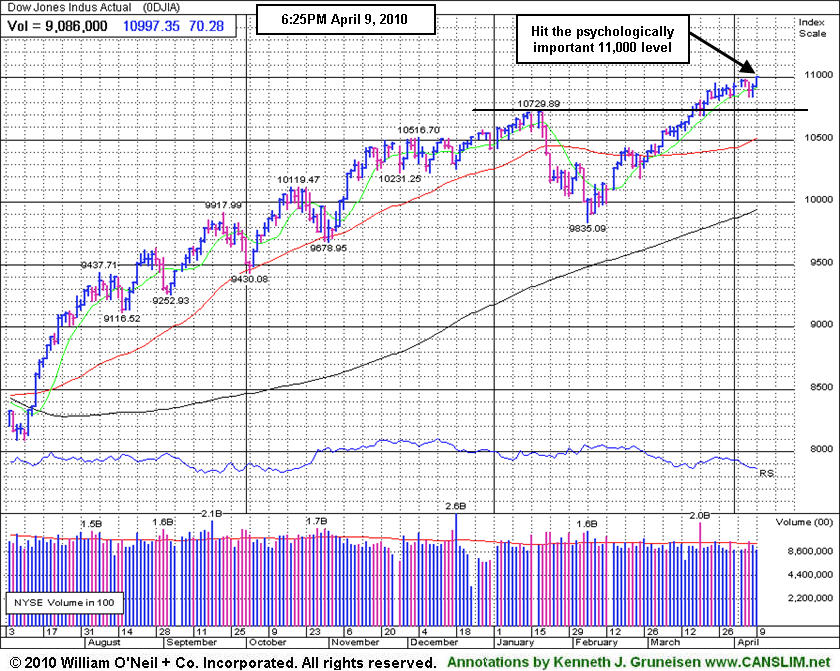
Dow Touches 11,000 Level With Light Volume Behind Recent Gains
Adam Sarhan, Contributing Writer,
Stocks closed higher for the week and overcame the latest round of mild distribution as leading stocks continued to act well and the Dow Jones Industrial Average briefly touched the 11,000 mark. Volume totals on the NYSE and on the Nasdaq exchange were reported lower compared to Thursday's totals, revealing a lack of buying conviction from the institutional crowd after recent distributional pressure. Breadth was positive as advancers led decliners by a 2-to-1 ratio on the NYSE and by a 7-to-6 ratio on the Nasdaq exchange. New 52-week highs trumped new lows on both exchanges yet again. There were 48 high-ranked companies from the CANSLIM.net Leaders List that made a new 52-week high and appeared on the CANSLIM.net BreakOuts Page, higher from the 36 issues that appeared on the prior session. A healthy crop of new leaders making new highs bodes well for any market rally, so the recent expansion in leadership has been a welcome post-holiday improvement. However, the rising number of distribution days has raised some concerns.
Stocks closed higher on Monday as investors returned from a long holiday weekend and the latest round of stronger-than-expected economic data was released. Monday was the first trading day after March's non-farm payrolls report was released. Stocks rallied around the world after the Labor Department reported the strongest monthly reading in payrolls since Q1 2007. Elsewhere, the ISM released its service index which topped analysts' estimates. Separately, pending home sales unexpectedly rose which bodes well for the ailing housing market. The healthy housing data helped a slew of housing stocks rally as investors believe "the worst" is over concerning the housing market's downturn.
On Tuesday, stocks ended mixed after the Australian Central Bank raised interest rates for a 5th time by a quarter point to +4.25% and Greece rejected an EU-IMF aid package. The euro tanked (greenback rallied) after Greece denied an EU-IMF backed plan to help it recovery from its worst financial crisis since WWII. Stateside, the Federal Reserve released the minutes of its latest meeting which showed a stronger, not weaker economic outlook.
Stocks suffered a mild distribution day on Wednesday after consumer credit fell and concern about Greece defaulting accelerated. The Federal Reserve said consumer borrowing slid by a larger than expected reading of $11.5 billion in February. The fear that lower consumer spending may curtail economic growth played a pivotal role in sending stocks lower on Wednesday. The major averages edged higher on Thursday after US retailers reported stronger than expected same store sales last month. In addition, the Labor Department said initial jobless claims unexpectedly rose +18,000 to +460,000 last week. In Europe, the Greece fears subsided after European Central Bank President Jean-Claude Trichet said he does not expect Greece to default. On Friday, a slew of asset classes ranging from stocks to commodities rose on speculation that deeply indebted European nations will receive an international bailout. Only time will tell whether or not this plays out.
In recent weeks, fewer high-ranked leaders have emerged from sound bases while many leaders have consolidated after earlier breakouts in a mostly healthy fashion. The benchmark S&P 500 Index currently has 5 distribution days while the Nasdaq Composite and Dow Jones Industrial Average have 4 since the March 1, 2010 follow-though-day (FTD). These distribution days have not been damaging, however the simple fact that we currently have 5 distribution days for the S&P 500 suggests a more cautious approach may be prudent. Trade accordingly.
Don't miss your opportunity to view CANSLIM.net's Q1 2010 Webcast - Available free of charge now to all active StockNews (pay premium) members! The link to access the webcast is posted at the top of the white portion of the Premium Membership Homepage (click here). You may take advantage of the SPRING SPECIAL to reactivate an expired membership, start a new membership, or upgrade from your free membership level so you can access this informative webcast.
PICTURED: The Dow Jones Industrial Average hit the psychologically important 11,000 level.
|
|
|
 |
Internet Index Has Rallied Impressively To New Recovery Highs
Kenneth J. Gruneisen - Passed the CAN SLIM® Master's Exam
Modest gains from the Retail Index ($RLX +0.42%) and a positive bias in the Bank Index ($BKX +0.45%) and Broker/Dealer Index ($XBD +0.51%) provided some underlying influence lifting to the major averages on Friday. Tech shares had a positive bias as the Semiconductor Index ($SOX +1.15%) outpaced the Networking Index ($NWX +0.59%), Internet Index ($IIX +0.63%), and Biotechnology Index ($BTK +0.51%). The Integrated Oil Index ($XOI +1.41%) and Gold & Silver Index ($XAU +0.60%) posted gains, meanwhile the Healthcare Index ($HMO -0.65%) and Oil Services Index ($OSX -0.15%) lagged.
Charts courtesy www.stockcharts.com
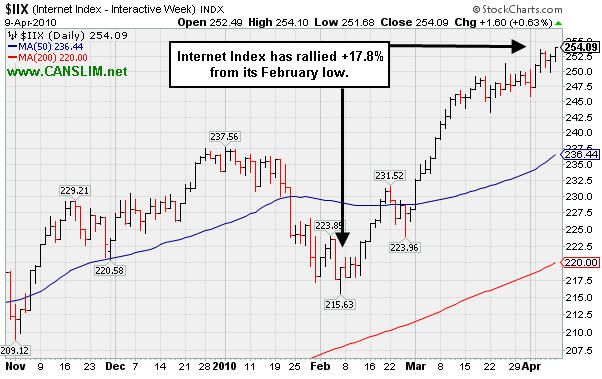
PICTURED: The Internet Index ($IIX +0.63%) has rallied +17.8% from its February low and it is now perched at a recovery high.
| Oil Services |
$OSX |
213.15 |
-0.33 |
-0.15% |
+9.35% |
| Healthcare |
$HMO |
1,542.74 |
-10.06 |
-0.65% |
+4.74% |
| Integrated Oil |
$XOI |
1,119.60 |
+15.57 |
+1.41% |
+4.81% |
| Semiconductor |
$SOX |
375.76 |
+4.29 |
+1.15% |
+4.40% |
| Networking |
$NWX |
262.65 |
+1.53 |
+0.59% |
+13.67% |
| Internet |
$IIX |
254.08 |
+1.59 |
+0.63% |
+8.65% |
| Broker/Dealer |
$XBD |
121.79 |
+0.62 |
+0.51% |
+5.86% |
| Retail |
$RLX |
468.26 |
+1.98 |
+0.42% |
+13.90% |
| Gold & Silver |
$XAU |
177.00 |
+1.05 |
+0.60% |
+5.20% |
| Bank |
$BKX |
55.31 |
+0.25 |
+0.45% |
+29.50% |
| Biotech |
$BTK |
1,246.93 |
+6.31 |
+0.51% |
+32.35% |
|
|
|
 |
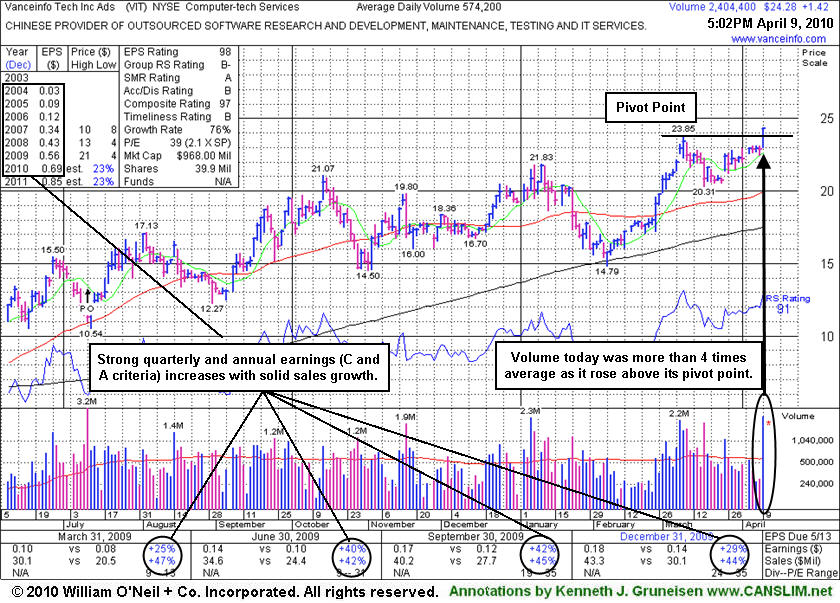
Strong Finish Today Met Guidelines For Technical Buy Signal
Kenneth J. Gruneisen - Passed the CAN SLIM® Master's Exam
Vanceinfo Tech Inc Ads (VIT +$1.42 or +6.21% to $24.28) blasted to a new 52-week high today and triggered a technical buy signal as a solid gain with heavy volume more than 4 times average helped it trade above its pivot point after a 5-week consolidation. It was color coded yellow with new pivot point and "max buy" levels noted in today's mid-day report (read here). It recently found support after undercutting prior chart highs in the $21 area. Recent lows and its 50-day moving average (DMA) line define an important support level to watch on pullbacks. Data now provided by the service used by our experts shows +25% quarterly earnings increases in the 5 most current comparisons while sales revenues increases have been very strong and steady (above +40%).
VIT rebounded impressively since it was dropped from the Featured Stocks list on 2/02/10. The 1/22/10 violation of its 50-day moving average (DMA) line had triggered a technical sell signal. It continued to struggle until finding support at its 200 DMA line. Its eventual rebound back above its 50 DMA was proof of institutional (I criteria) support and buying demand, especially as it went on rallying to overcome all resistance due to overhead supply. When the high-ranked Computer - Tech Services firm was featured in yellow in the 12/24/09 mid-day report (read here) it had come a long way in the past year, yet it had built a sufficient length base following its steep ascent from its March low ($4.31). Its small supply of only 11.6 million shares (the S criteria) in the publicly traded float could be a factor leading to greater volatility, especially in the event of mutual funds accumulating or distributing (selling) shares. This heightens the need for caution when buying and the discipline to limit losses, as always, if any stock ever falls more than -7% from your buy price.
|
|
|
Color Codes Explained :
Y - Better candidates highlighted by our
staff of experts.
G - Previously featured
in past reports as yellow but may no longer be buyable under the
guidelines.
***Last / Change / Volume quote data in this table corresponds with the timestamp on the note***
Symbol/Exchange
Company Name
Industry Group |
Last |
Chg. |
Vol
% DAV |
Date Featured |
Price Featured |
Latest Pivot Point
Featured |
Status |
| Latest Max Buy Price |
ARUN
- NASDAQ
Aruba Networks Inc
COMPUTER HARDWARE - Networking & Communication Dev
|
$13.62
|
+0.14
|
937,905
59% DAV
1,597,100
|
2/19/2010
(Date
Featured) |
$12.71
(Price
Featured) |
PP = $11.94 |
G |
| MB = $12.54 |
Most Recent Note - 4/9/2010 5:37:32 PM
G - Holding its ground, consolidating near its 52-week high. Support to watch is defined by prior chart highs and its 50 DMA line in the upper $11 area.
>>> The latest Featured Stock Update with an annotated graph appeared on 3/31/2010. click here.
|
|
C
A
S
I |
News |
Chart |
SEC
View all notes Alert
me of new notes
Company
Profile
|
BIDU
- NASDAQ
Baidu Inc Ads
INTERNET - Internet Information Providers
|
$625.47
|
+5.62
|
1,059,163
64% DAV
1,657,500
|
1/13/2010
(Date
Featured) |
$431.25
(Price
Featured) |
PP = $426.75 |
G |
| MB = $448.09 |
Most Recent Note - 4/9/2010 5:55:48 PM
G - Finished at a new high close, extended from any sound base after 10 consecutive weekly gains.
>>> The latest Featured Stock Update with an annotated graph appeared on 3/24/2010. click here.
|
|
C
A
S
I |
News |
Chart |
SEC
View all notes Alert
me of new notes
Company
Profile
|
BRLI
- NASDAQ
Bio Reference Labs Inc
HEALTH SERVICES - Medical Laboratories & Researc
|
$45.59
|
+0.27
|
70,757
73% DAV
97,400
|
2/12/2010
(Date
Featured) |
$39.02
(Price
Featured) |
PP = $40.97 |
G |
| MB = $43.02 |
Most Recent Note - 4/9/2010 5:57:03 PM
G - Rallied for a third consecutive gain and its best ever close today after consolidating for a few weeks well above its 50 DMA line. Its recent chart low ($42.54 on 3/26/10) is an initial support level to watch.
>>> The latest Featured Stock Update with an annotated graph appeared on 3/22/2010. click here.
|
|
C
A
S
I |
News |
Chart |
SEC
View all notes Alert
me of new notes
Company
Profile
|
CISG
- NASDAQ
Cninsure Inc Ads
INSURANCE - Insurance Brokers
|
$28.30
|
+0.39
|
284,984
123% DAV
232,500
|
3/3/2010
(Date
Featured) |
$24.38
(Price
Featured) |
PP = $23.10 |
G |
| MB = $24.26 |
Most Recent Note - 4/9/2010 6:00:15 PM
G - Gain today with slightly above average volume for a new high close. Recently noted as "extended from a sound base, yet no overhead supply remains to act as resistance." It has traded up +16% since featured in yellow in the 3/03/10 mid-day report (read here).
>>> The latest Featured Stock Update with an annotated graph appeared on 3/23/2010. click here.
|
|
C
A
S
I |
News |
Chart |
SEC
View all notes Alert
me of new notes
Company
Profile
|
CRM
- NYSE
Salesforce.com Inc
INTERNET - Internet Software & Services
|
$79.77
|
+1.82
|
1,920,554
111% DAV
1,736,000
|
3/5/2010
(Date
Featured) |
$72.28
(Price
Featured) |
PP = $75.53 |
G |
| MB = $79.31 |
Most Recent Note - 4/9/2010 6:05:10 PM
G - Gain today with +10% above average volume for a new all-time high above its "max buy" level. Color code is changed to green. No gain above the latest pivot point came with volume at least +50% above average. It did not trigger a proper technical buy signal within the investment system's guidelines.
>>> The latest Featured Stock Update with an annotated graph appeared on 3/25/2010. click here.
|
|
C
A
S
I |
News |
Chart |
SEC
View all notes Alert
me of new notes
Company
Profile
|
CTRP
- NASDAQ
Ctrip.com Intl Ltd Adr
LEISURE - Resorts & Casinos
|
$37.96
|
-1.09
|
2,196,425
101% DAV
2,178,200
|
3/25/2010
(Date
Featured) |
$40.74
(Price
Featured) |
PP = $39.40 |
Y |
| MB = $41.37 |
Most Recent Note - 4/9/2010 6:09:38 PM
Y - Today marked its 4th consecutive loss with average volume. On 4/01/10 it gapped up and surged to a new high, briefly trading above its "max buy" level, but while its gain above its pivot point was backed by +72% above average volume, it encountered distributional pressure and quickly reversed a large part of its early gain to ultimately close in the lower part of its intra-day range. CTRP has been stalled at all-time highs since 3/25/10 when a detailed Stock Bulletin with annotated graph and expert analysis was published (read here).
>>> The latest Featured Stock Update with an annotated graph appeared on 3/25/2010. click here.
|
|
C
A
S
I |
News |
Chart |
SEC
View all notes Alert
me of new notes
Company
Profile
|
EZPW
- NASDAQ
Ezcorp Inc Cl A
SPECIALTY RETAIL - Specialty Retail, Other
|
$20.96
|
-0.18
|
345,576
67% DAV
515,200
|
2/19/2010
(Date
Featured) |
$19.03
(Price
Featured) |
PP = $18.80 |
G |
| MB = $19.74 |
Most Recent Note - 4/9/2010 6:13:20 PM
G - Quietly consolidating well above its 50 DMA line and its recent chart low ($19.73 on 3/16/10) that define near-term support. This high-ranked Finance - Consumer/Commercial Loans firm is within close striking distance of its all-time high and has no overhead supply to act as resistance.
>>> The latest Featured Stock Update with an annotated graph appeared on 3/29/2010. click here.
|
|
C
A
S
I |
News |
Chart |
SEC
View all notes Alert
me of new notes
Company
Profile
|
GMCR
- NASDAQ
Green Mtn Coffee Roastrs
FOOD & BEVERAGE - Processed & Packaged Goods
|
$96.57
|
+0.20
|
965,079
85% DAV
1,137,700
|
2/26/2010
(Date
Featured) |
$84.39
(Price
Featured) |
PP = $88.75 |
G |
| MB = $93.19 |
Most Recent Note - 4/9/2010 6:14:10 PM
G - This high-ranked leader is extended from an ideal base and trading above the "max buy" level previously cited, stubbornly holding its ground. Support to watch on pullbacks is at prior chart highs and its 50-day moving average (DMA) line now coinciding in the $88 area.
>>> The latest Featured Stock Update with an annotated graph appeared on 4/5/2010. click here.
|
|
C
A
S
I |
News |
Chart |
SEC
View all notes Alert
me of new notes
Company
Profile
|
PCLN
- NASDAQ
Priceline.com Inc
INTERNET - Internet Software & Services
|
$399.55
|
-4.72
|
584,812
N/A
|
11/1/2002
(Date
Featured) |
$399.55
(Price
Featured) |
PP = $428.20 |
Y |
| MB = $449.61 |
Most Recent Note - 1/2/2011
Y - Returns to Featured Stocks list with its appearance in the January 2011 CANSLIM.net News including detailed analysis and annotated daily and weekly graphs.
>>> The latest Featured Stock Update with an annotated graph appeared on 3/30/2010. click here.
|
|
C
A
S
I |
News |
Chart |
SEC
View all notes Alert
me of new notes
Company
Profile
|
PEGA
- NASDAQ
Pegasystems Inc
COMPUTER SOFTWARE & SERVICES - Business Software & Services
|
$37.31
|
-0.43
|
101,078
49% DAV
208,100
|
2/26/2010
(Date
Featured) |
$36.00
(Price
Featured) |
PP = $38.55 |
Y |
| MB = $40.48 |
Most Recent Note - 4/9/2010 6:18:50 PM
Y - Quietly consolidating near support at prior chart highs and its 50 DMA line which coincide in the $37 area. Its Relative Strength rank has been slumping while it has failed to follow through with any confirming gains with above average volume since its considerable gap up gain on 3/15/10 triggered a technical buy signal.
>>> The latest Featured Stock Update with an annotated graph appeared on 4/6/2010. click here.
|
|
C
A
S
I |
News |
Chart |
SEC
View all notes Alert
me of new notes
Company
Profile
|
ROVI
- NASDAQ
Rovi Corp
COMPUTER SOFTWARE & SERVICES - Security Software & Services
|
$36.79
|
+0.41
|
764,941
57% DAV
1,349,700
|
2/25/2010
(Date
Featured) |
$33.54
(Price
Featured) |
PP = $34.87 |
Y |
| MB = $36.61 |
Most Recent Note - 4/9/2010
Y - Consolidating near its "max buy" level after 4 weeks of trading in a tight range with volume cooling. Color code was changed to yellow. Prior chart highs and its 50 DMA line, coinciding in the $34 area, define an important support level to watch on pullbacks.
>>> The latest Featured Stock Update with an annotated graph appeared on 4/8/2010. click here.
|
|
C
A
S
I |
News |
Chart |
SEC
View all notes Alert
me of new notes
Company
Profile
|
SIRO
- NASDAQ
Sirona Dental Systems
HEALTH SERVICES - Medical Instruments & Supplies
|
$38.44
|
+0.54
|
233,919
39% DAV
603,800
|
2/16/2010
(Date
Featured) |
$36.43
(Price
Featured) |
PP = $36.15 |
G |
| MB = $37.96 |
Most Recent Note - 4/9/2010 6:20:30 PM
G - Hovering near all-time highs. Prior chart highs and its 50 DMA line in the $36 area define important support to watch.
>>> The latest Featured Stock Update with an annotated graph appeared on 3/26/2010. click here.
|
|
C
A
S
I |
News |
Chart |
SEC
View all notes Alert
me of new notes
Company
Profile
|
ULTA
- NASDAQ
Ulta Salon Cosm & Frag
SPECIALTY RETAIL - Specialty Retail, Other
|
$23.20
|
+1.05
|
428,320
115% DAV
373,100
|
3/12/2010
(Date
Featured) |
$22.81
(Price
Featured) |
PP = $21.72 |
G |
| MB = $22.81 |
Most Recent Note - 4/9/2010 6:22:17 PM
G - Color code was changed to green as it rose back well above its "max buy" level, with today's solid gain leaving it -1% off its 52-week high. A detailed Stock Bulletin with annotated graph was published soon after it was featured in the 3/12/10 mid-day report.
>>> The latest Featured Stock Update with an annotated graph appeared on 4/1/2010. click here.
|
|
C
A
S
I |
News |
Chart |
SEC
View all notes Alert
me of new notes
Company
Profile
|
VIT
-
|
$24.28
|
+1.42
|
2,404,838
419% DAV
574,200
|
4/9/2010
(Date
Featured) |
$23.79
(Price
Featured) |
PP = $23.95 |
Y |
| MB = $25.15 |
Most Recent Note - 4/9/2010 6:24:03 PM
Y - Blasted to a new 52-week high today and triggered a technical buy signal as a solid gain with heavy volume more than 4 times average helped it trade above its pivot point after a 5-week consolidation. Color code was yellow with new pivot point and "max buy" levels noted in the 4/09/10 mid-day report (read here). It recently found support after undercutting prior chart highs in the $21 area. Recent lows and its 50 DMA line define an important support level to watch on pullbacks. Data now provided by the service used by our experts shows +25% quarterly earnings increases in the 5 most current comparisons while sales revenues increases have been very strong and steady (above +40%). Rebounded impressively rebounded since it was dropped from the Featured Stocks list on 2/02/10.
>>> The latest Featured Stock Update with an annotated graph appeared on 4/9/2010. click here.
|
|
C
A
S
I |
News |
Chart |
SEC
View all notes Alert
me of new notes
Company
Profile
|
VPRT
- NASDAQ
Vistaprint Nv
DIVERSIFIED SERVICES - Business/Management Services
|
$58.65
|
-0.15
|
163,343
39% DAV
421,500
|
3/1/2010
(Date
Featured) |
$57.72
(Price
Featured) |
PP = $59.70 |
G |
| MB = $62.69 |
Most Recent Note - 4/9/2010 6:24:33 PM
G - Still quietly holding its ground above its 50 DMA line. Distributional action recently pressured it near that short-term average line, raising concerns. Color code was changed to green. It did not trigger a technical buy signal since it was featured in the March 2010 CANSLIM.net News monthly newsletter (read here). As previously noted, "Its gain on 3/02/10 was below the volume guidelines for buyable breakouts under the investment system."
>>> The latest Featured Stock Update with an annotated graph appeared on 3/19/2010. click here.
|
|
C
A
S
I |
News |
Chart |
SEC
View all notes Alert
me of new notes
Company
Profile
|
|
|
|
THESE ARE NOT BUY RECOMMENDATIONS!
Comments contained in the body of this report are technical
opinions only. The material herein has been obtained
from sources believed to be reliable and accurate, however,
its accuracy and completeness cannot be guaranteed.
This site is not an investment advisor, hence it does
not endorse or recommend any securities or other investments.
Any recommendation contained in this report may not
be suitable for all investors and it is not to be deemed
an offer or solicitation on our part with respect to
the purchase or sale of any securities. All trademarks,
service marks and trade names appearing in this report
are the property of their respective owners, and are
likewise used for identification purposes only.
This report is a service available
only to active Paid Premium Members.
You may opt-out of receiving report notifications
at any time. Questions or comments may be submitted
by writing to Premium Membership Services 665 S.E. 10 Street, Suite 201 Deerfield Beach, FL 33441-5634 or by calling 1-800-965-8307
or 954-785-1121.
|
|
|


