You are not logged in.
This means you
CAN ONLY VIEW reports that were published prior to Monday, February 26, 2024.
You
MUST UPGRADE YOUR MEMBERSHIP if you want to see any current reports.
AFTER MARKET UPDATE - FRIDAY, APRIL 8TH, 2022
Previous After Market Report Next After Market Report >>>
|
|
|
|
DOW |
+137.55 |
34,721.12 |
+0.40% |
|
Volume |
846,190,100 |
-16% |
|
Volume |
4,448,118,500 |
-6% |
|
NASDAQ |
-186.30 |
13,711.00 |
-1.34% |
|
Advancers |
1,373 |
43% |
|
Advancers |
1,721 |
39% |
|
S&P 500 |
-11.93 |
4,488.28 |
-0.27% |
|
Decliners |
1,789 |
57% |
|
Decliners |
2,687 |
61% |
|
Russell 2000 |
-15.24 |
1,994.56 |
-0.76% |
|
52 Wk Highs |
117 |
|
|
52 Wk Highs |
81 |
|
|
S&P 600 |
-7.67 |
1,272.84 |
-0.60% |
|
52 Wk Lows |
215 |
|
|
52 Wk Lows |
266 |
|
|
 |
Sputtering Major Indices Were Mixed With Lighter Volume Totals
Kenneth J. Gruneisen - Passed the CAN SLIM® Master's Exam
The S&P 500 dipped 0.3% to end 1.3% lower for the week. The Nasdaq Composite fell 1.3%, dragging its five-day rout to 3.9%--its worst weekly performance since January 21. Both benchmarks snapped their first three-week winning streak since November. The Dow added 137 points, down marginally on the week (-0.3%). Volume totals reported were lighter than the prior session on the NYSE and on the Nasdaq exchange, revealing lackluster institutional buying demand. Breadth was negative as decliners led advancers by a 9-7 margin on the NYSE and by a 3-2 margin on the Nasdaq exchange. There were 38 high-ranked companies from the Leaders List that hit new 52-week highs and were listed on the BreakOuts Page, versus 33 on the prior session. New 52-week lows totals solidly outnumbered new 52-week highs on the NYSE and on the Nasdaq exchange. The major indices are in an uptrend that has come under pressure (M criteria). Strict followers of the fact-based investment system only buy stocks fitting all key fundamental and technical investment criteria.
Chart courtesy of www.stockcharts.com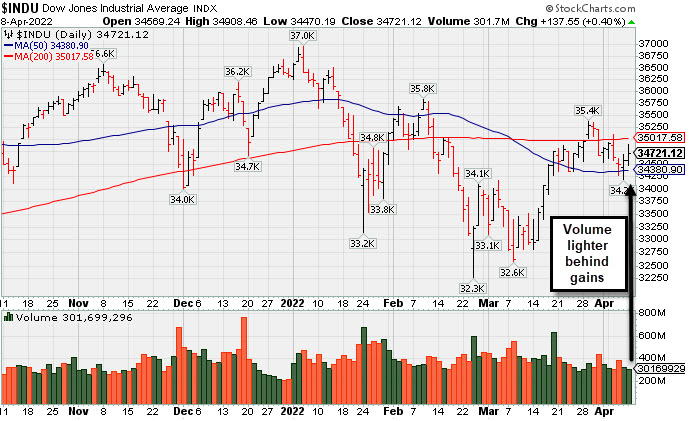 PICTURED: The Dow Jones Industrial Average posted gains with lighter volume, lingering below its 200-day moving average (DMA) line while sputtering above its 50 DMA line.
U.S. stocks finished mixed on Friday, ending a downbeat week as Wall Street assessed a number of market headwinds. The Dow Jones Transportation Average weathered its largest five-day slide since June 2020 (-6.7%).
Prospects of aggressive monetary policy tightening, the ongoing Russian-Ukraine war, and COVID-19 lockdowns in China all continued to cloud the economic outlook. Inflationary concerns also pressured sentiment. Next week, data is expected to show the U.S. Consumer Price Index (CPI) peaked at 8.4% year-over-year in March.
Treasuries extended their slump as investors weighed an increasingly hawkish Federal Reserve. This yield on the 10-year note advanced for a sixth consecutive session, up six basis points (0.06%) to 2.70%. Notably, the benchmark yield spiked 33 basis points (0.33%) on the week to touch its highest level since March 2019. In commodities, West Texas Intermediate crude rebounded 2% to $97.95/barrel, though still logged a second straight weekly decline. In FOREX trading, a measure of the U.S. dollar rose for a seventh consecutive day, hovering near a peak not seen since July 2020.
Seven of 11 S&P 500 sectors closed in positive territory, with Energy leading the advance. Financials also outperformed ahead of earnings reports from some of Wall Street’s biggest banks next week. Technology lagged amid weakness in chipmakers.
|
 Kenneth J. Gruneisen started out as a licensed stockbroker in August 1987, a couple of months prior to the historic stock market crash that took the Dow Jones Industrial Average down -22.6% in a single day. He has published daily fact-based fundamental and technical analysis on high-ranked stocks online for two decades. Through FACTBASEDINVESTING.COM, Kenneth provides educational articles, news, market commentary, and other information regarding proven investment systems that work in good times and bad.
Comments contained in the body of this report are technical opinions only and are not necessarily those of Gruneisen Growth Corp. The material herein has been obtained from sources believed to be reliable and accurate, however, its accuracy and completeness cannot be guaranteed. Our firm, employees, and customers may effect transactions, including transactions contrary to any recommendation herein, or have positions in the securities mentioned herein or options with respect thereto. Any recommendation contained in this report may not be suitable for all investors and it is not to be deemed an offer or solicitation on our part with respect to the purchase or sale of any securities. |
|
 |
Commodity-Linked Groups and Bank Index Rose
Kenneth J. Gruneisen - Passed the CAN SLIM® Master's Exam
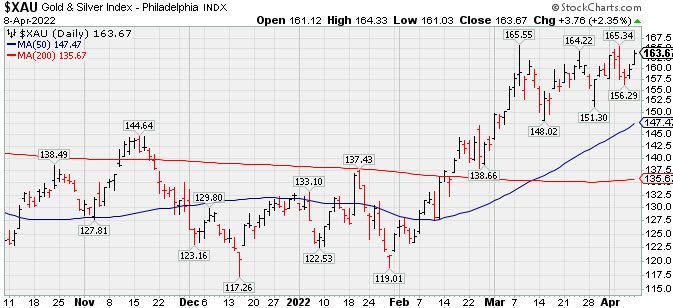
The.Oil Services Index ($OSX +3.38%), Integrated Oil Index ($XOI +2.50%), and Gold & Silver Index ($XAU +2.35%) each posted a soiid gain on Friday. The Semiconductor Index ($SOX -2.42%) and Networking Index ($NWX -1.34%) both lost ground while the Biotech Index ($BTK +0.01%) finished flat. The Bank Index ($BKX +0.81%) posted a small gain while the Broker/Dealer Index ($XBD +0.03%) finished flat and the Retail Index ($RLX -0.35%) edged lower. PICTURED: The Gold & Silver Index ($XAU +2.35%) stayed well above its 50-day moving average (DMA) line in recent weeks and it is perched within striking distance of its 2022 high.
| Oil Services |
$OSX |
82.27 |
+2.69 |
+3.38% |
+56.04% |
| Integrated Oil |
$XOI |
1,628.80 |
+39.67 |
+2.50% |
+38.24% |
| Semiconductor |
$SOX |
3,120.16 |
-77.28 |
-2.42% |
-20.93% |
| Networking |
$NWX |
849.57 |
-11.55 |
-1.34% |
-12.51% |
| Broker/Dealer |
$XBD |
444.45 |
+0.12 |
+0.03% |
-8.71% |
| Retail |
$RLX |
3,752.41 |
-13.22 |
-0.35% |
-11.22% |
| Gold & Silver |
$XAU |
163.67 |
+3.76 |
+2.35% |
+23.57% |
| Bank |
$BKX |
119.79 |
+0.97 |
+0.81% |
-9.40% |
| Biotech |
$BTK |
5,305.67 |
+0.34 |
+0.01% |
-3.86% |
|
|
|
 |
Featured Stocks
Kenneth J. Gruneisen - Passed the CAN SLIM® Master's Exam
|
|
|
Color Codes Explained :
Y - Better candidates highlighted by our
staff of experts.
G - Previously featured
in past reports as yellow but may no longer be buyable under the
guidelines.
***Last / Change / Volume data in this table is the closing quote data***
Symbol/Exchange
Company Name
Industry Group |
PRICE |
CHANGE
(%Change) |
Day High |
Volume
(% DAV)
(% 50 day avg vol) |
52 Wk Hi
% From Hi |
Featured
Date |
Price
Featured |
Pivot Featured |
|
Max Buy |
 REGN
-
NASDAQ
REGN
-
NASDAQ
Regeneron Pharmaceutical
DRUGS - Biotechnology
|
$738.84
|
+17.04
2.36% |
$747.42
|
1,026,394
142.75% of 50 DAV
50 DAV is 719,000
|
$725.97
1.77%
|
3/14/2022
|
$647.95
|
PP = $673.96
|
|
MB = $707.66
|
 Most Recent Note - 4/8/2022 4:33:41 PM
G - Hit another new all-time high today with +41% above average volume, getting extended from any sound base. Prior highs ($686 and $673) define initial support to watch above its 50 DMA line ($648).
>>> FEATURED STOCK ARTICLE : Volume Totals Have Been Light While Hovering at All-Time High - 4/4/2022 |
View all notes |
Set NEW NOTE alert |
Company Profile |
SEC
News |
Chart |
Request a new note
C
A
S
I |
TGH
-
NYSE
Textainer Group Holdings
TRANSPORTATION - Logistics
|
$33.64
|
-1.40
-4.00% |
$35.23
|
856,523
177.33% of 50 DAV
50 DAV is 483,000
|
$41.89
-19.69%
|
1/31/2022
|
$36.68
|
PP = $41.34
|
|
MB = $43.41
|
Most Recent Note - 4/8/2022 4:37:39 PM
Fell further below its 200 DMA line ($35.54) and below prior lows in the $34 area with above average volume behind its 5th consecutive gain. It will be dropped from the Featured Stocks list tonight. A rebound above the 50 DMA line is needed for its outlook improve.
>>> FEATURED STOCK ARTICLE : Recently Perched Within Striking Distance of Prior Highs - 3/30/2022 |
View all notes |
Set NEW NOTE alert |
Company Profile |
SEC
News |
Chart |
Request a new note
C
A
S
I |
HWKN
-
NASDAQ
Hawkins Inc
CHEMICALS - Basic Chemicals
|
$41.72
|
-0.75
-1.77% |
$42.80
|
49,074
61.34% of 50 DAV
50 DAV is 80,000
|
$48.12
-13.30%
|
2/3/2022
|
$39.81
|
PP = $41.07
|
|
MB = $43.12
|
Most Recent Note - 4/8/2022 4:30:42 PM
Failed to rebound above its 50 DMA line ($43.51) and today it suffered a 7th consecutive loss after a noted "negative reversal" at its all-time high. A rebound above the 50 DMA line is needed for its outlook to improve. It will be dropped from the Featured Stocks list tonight.
>>> FEATURED STOCK ARTICLE : 50-Day Moving Average Violation Triggered Technical Sell Signal - 4/5/2022 |
View all notes |
Set NEW NOTE alert |
Company Profile |
SEC
News |
Chart |
Request a new note
C
A
S
I |
IMXI
-
NASDAQ
International Money Exp
Financial Svcs-Specialty
|
$20.04
|
-0.27
-1.33% |
$20.65
|
290,760
83.55% of 50 DAV
50 DAV is 348,000
|
$21.98
-8.83%
|
3/8/2022
|
$18.64
|
PP = $19.06
|
|
MB = $20.01
|
Most Recent Note - 4/8/2022 4:32:05 PM
G - Consolidating still well above prior highs in the high $18 area which define initial support to watch above its 50 DMA line ($18.03).
>>> FEATURED STOCK ARTICLE : Holding Ground After Rallying From Prior Base - 3/24/2022 |
View all notes |
Set NEW NOTE alert |
Company Profile |
SEC
News |
Chart |
Request a new note
C
A
S
I |
|
|
|
THESE ARE NOT BUY RECOMMENDATIONS!
Comments contained in the body of this report are technical
opinions only. The material herein has been obtained
from sources believed to be reliable and accurate, however,
its accuracy and completeness cannot be guaranteed.
This site is not an investment advisor, hence it does
not endorse or recommend any securities or other investments.
Any recommendation contained in this report may not
be suitable for all investors and it is not to be deemed
an offer or solicitation on our part with respect to
the purchase or sale of any securities. All trademarks,
service marks and trade names appearing in this report
are the property of their respective owners, and are
likewise used for identification purposes only.
This report is a service available
only to active Paid Premium Members.
You may opt-out of receiving report notifications
at any time. Questions or comments may be submitted
by writing to Premium Membership Services 665 S.E. 10 Street, Suite 201 Deerfield Beach, FL 33441-5634 or by calling 1-800-965-8307
or 954-785-1121.
|
|
|