You are not logged in.
This means you
CAN ONLY VIEW reports that were published prior to Monday, April 14, 2025.
You
MUST UPGRADE YOUR MEMBERSHIP if you want to see any current reports.
AFTER MARKET UPDATE - MONDAY, APRIL 8TH, 2013
Previous After Market Report Next After Market Report >>>
|
|
|
|
DOW |
+48.23 |
14,613.48 |
+0.33% |
|
Volume |
582,756,440 |
-20% |
|
Volume |
1,284,884,630 |
-17% |
|
NASDAQ |
+18.39 |
3,222.25 |
+0.57% |
|
Advancers |
2,069 |
66% |
|
Advancers |
1,463 |
57% |
|
S&P 500 |
+9.79 |
1,563.07 |
+0.63% |
|
Decliners |
933 |
30% |
|
Decliners |
987 |
38% |
|
Russell 2000 |
+8.21 |
931.49 |
+0.89% |
|
52 Wk Highs |
176 |
|
|
52 Wk Highs |
68 |
|
|
S&P 600 |
+4.71 |
522.18 |
+0.91% |
|
52 Wk Lows |
12 |
|
|
52 Wk Lows |
32 |
|
|
 |
Major Averages Rise on Very Light Volume
Kenneth J. Gruneisen - Passed the CAN SLIM® Master's Exam
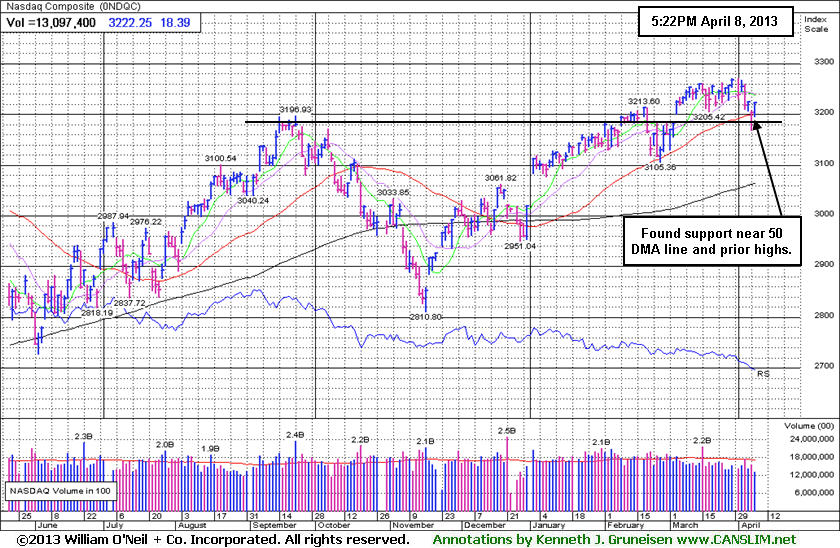
The market fluctuated between positive and negative territory for much of the day before climbing in the final hour of trading, starting the week with unanimous gains for the Dow Jones Industrial Average, S&P 500 Index, and the Nasdaq Composite Index. Monday's volume totals on the exchanges were reported much lighter than the prior session totals and lighter than average on the NYSE and on the Nasdaq exchange, revealing a lack of institutional buying demand following recent distributional pressure. New 52-week highs outnumbered new 52-week lows on the NYSE and on the Nasdaq exchange. Breadth was positive as advancers led decliners on the Nasdaq by nearly 3 to 2, and advancers had a 2-1 lead over decliners on the NYSE. There were 30 high-ranked companies from the CANSLIM.net Leaders List making new 52-week highs and appearing on the CANSLIM.net BreakOuts Page, up from the prior session total of 5 stocks. The totals are down considerably from 103 stocks on Friday, March 28th (read here). There were gains for 10 of the 15 high-ranked companies currently included on the Featured Stocks Page.
Stocks ended a choppy session higher on Monday as investors looked ahead to an earnings season expected to show modest growth despite concerns about macroeconomic conditions. Forecasts for first-quarter earnings have been scaled back in 2013, with profits seen rising just +1.6% from the year-ago quarter, according to Thomson Reuters. In January, earnings were seen rising +4.3%. The lower expectations come as economic figures suggest the recovery could be less robust than previously thought. Weak corporate results could give investors further reasons to sell, pushing both the Dow and the S&P 500 back from recent all-time closing highs.
The Bank of Japan started its bond purchases on Monday after it announced last week that it will inject about $1.4 trillion into the economy in less than two years. Fed Chairman Ben Bernanke was scheduled to give a speech later after markets closed Monday. Investors have been watching signals from the Fed on how long the central bank will keep its asset purchase program in place as it tries to boost the economic recovery.
The Dow's gains were limited by a sell-off of Johnson & Johnson (JNJ -1.13%) shares after a JP Morgan Chase & Co (JPM +1.40%) analyst downgraded the healthcare company's stock, saying it faced "a messy first quarter and a likely downward revision to 2013 guidance." Most active names included Advanced Micro Devices Inc (AMD +13.10%) as the S&P 500's biggest percentage gainer, and Monster Beverage Corp (MNST +4.69%). General Electric Co (GE +0.8%) edged higher after announcing plans to buy oilfield pump maker Lufkin Industries Inc (LUFK +37.6%) for about $2.98 billion. The news lifted other energy-related names in sympathy including WPX Energy Inc (WPX +5.3%). Earnings season unofficially started after the market closed with results from Alcoa Inc (AA +1.82%) which traded higher in extended-hours trading after adjusted earnings topped expectations.
Recent distribution days and weak action among high-ranked stocks has resulted in a noted shift in the market's (M criteria) stance. Early last week the rally was noted as "under pressure", and Friday's early action had the look of a more worrisome market "correction" before a resilient finish from the major indices provided some encouraging signs. Members have been reminded repeatedly that any sustainable rally requires a healthy crop of companies hitting new 52-week highs, so it is always essential to see meaningful leadership (stocks hitting new 52-week highs). Investors who should be watchful for individual issues flashing sell signals.
Watch for an announcement via email concerning the next WEBCAST. The webcast will also be available via an updated link highlighted at the top of the Premium Member Homepage.
PICTURED: The Nasdaq Composite Index found encouraging support near its 50-day moving average (DMA) line and prior highs recently, however light volume behind recent gains indicates a lack of buying demand from the institutional crowd.
|
 Kenneth J. Gruneisen started out as a licensed stockbroker in August 1987, a couple of months prior to the historic stock market crash that took the Dow Jones Industrial Average down -22.6% in a single day. He has published daily fact-based fundamental and technical analysis on high-ranked stocks online for two decades. Through FACTBASEDINVESTING.COM, Kenneth provides educational articles, news, market commentary, and other information regarding proven investment systems that work in good times and bad.
Comments contained in the body of this report are technical opinions only and are not necessarily those of Gruneisen Growth Corp. The material herein has been obtained from sources believed to be reliable and accurate, however, its accuracy and completeness cannot be guaranteed. Our firm, employees, and customers may effect transactions, including transactions contrary to any recommendation herein, or have positions in the securities mentioned herein or options with respect thereto. Any recommendation contained in this report may not be suitable for all investors and it is not to be deemed an offer or solicitation on our part with respect to the purchase or sale of any securities. |
|
 |
Oil Services Index Outpaced Positive Retail, Financial, and Semiconductor Indexes
Kenneth J. Gruneisen - Passed the CAN SLIM® Master's Exam
The Retail Index ($RLX +1.02%) helped underpin the major averages' gains along with the influential financial groups as the Broker/Dealer Index ($XBD +1.06%) and the Bank Index ($BKX +1.09%) both rose. Defensive groups lagged as the Gold & Silver Index ($XAU -1.14%) slumped and the Healthcare Index ($HMO +0.25%) eked out a small gain. The Semiconductor Index ($SOX +1.25%) led the tech sector while the Networking Index ($NWX +0.57%), Internet Index ($IIX +0.47%), and the Biotechnology Index ($BTK +0.28%) posted smaller gains.
Charts courtesy www.stockcharts.com
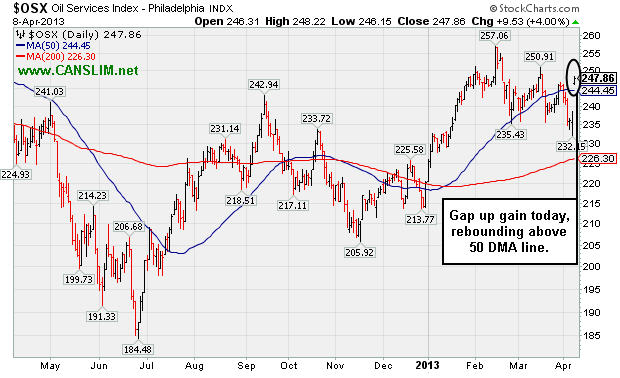
PICTURED: The Oil Services Index ($OSX +4.00%) was a standout gainer as it gapped up above its 50-day moving average (DMA) line.
| Oil Services |
$OSX |
247.86 |
+9.53 |
+4.00% |
+12.58% |
| Healthcare |
$HMO |
2,877.94 |
+7.24 |
+0.25% |
+14.47% |
| Integrated Oil |
$XOI |
1,335.52 |
+4.84 |
+0.36% |
+7.54% |
| Semiconductor |
$SOX |
424.17 |
+5.24 |
+1.25% |
+10.44% |
| Networking |
$NWX |
224.92 |
+1.27 |
+0.57% |
-0.72% |
| Internet |
$IIX |
353.77 |
+1.65 |
+0.47% |
+8.19% |
| Broker/Dealer |
$XBD |
109.47 |
+1.15 |
+1.06% |
+16.06% |
| Retail |
$RLX |
731.97 |
+7.42 |
+1.02% |
+12.08% |
| Gold & Silver |
$XAU |
124.69 |
-1.44 |
-1.14% |
-24.70% |
| Bank |
$BKX |
55.74 |
+0.60 |
+1.09% |
+8.70% |
| Biotech |
$BTK |
1,813.31 |
+5.12 |
+0.28% |
+17.21% |
|
|
|
 |
Pullback Near 50-day Moving Average on M&A News
Kenneth J. Gruneisen - Passed the CAN SLIM® Master's Exam
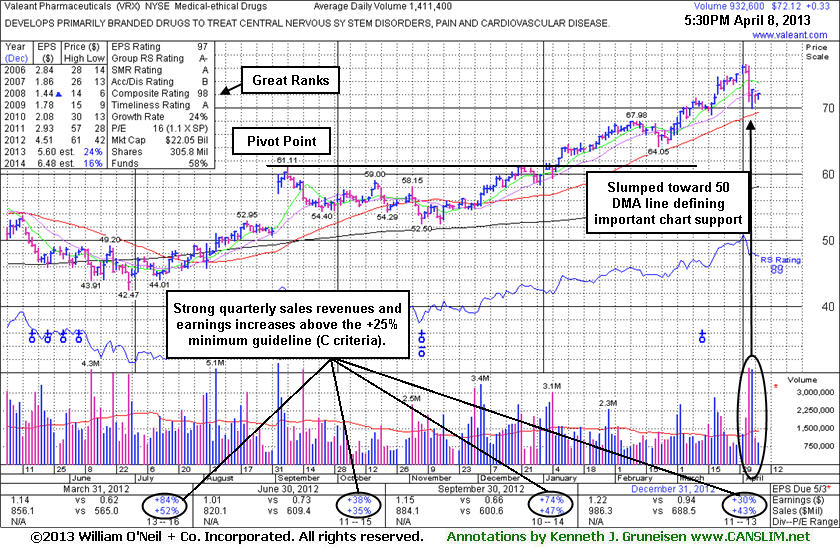
Valeant Pharmaceuticals (VRX +$0.33 or +0.46% to $72.12) is consolidating above its 50-day moving average (DMA) line. It is extended from its prior base and no new base of sufficient length has formed, yet it has stayed above its 50-day moving average (DMA) line during prior consolidations. That important short-term average defines near-term support to watch where a violation may raise concerns and trigger a technical sell signal. On 4/03/13 it pulled back on heavy volume after agreeing to an increased offer price of $24.00 cash for it to acquire Obagi Medical Products.
After the high-ranked Medical - Ethical Drugs firm was last shown in this FSU section on 3/12/13 with an annotated graph under the headline, "Following Test Of Support a Valid Chance to Accumulate", it rallied further into new high territory. The number of top-rated funds owning its shares rose from 818 in Mar '12 in to 938 in Mar '13, a reassuring trend concerning the I criteria. Its current Up/Down Volume Ratio of 1.5 is also an unbiased indication that its shares have been under accumulation over the past 50 days. Quarterly earnings increases (C criteria) have been strong and well above the +25% guideline. A downturn in FY '07 and '08 earnings (A criteria) has been followed by a strong earnings rebound in recent years.
|
|
|
Color Codes Explained :
Y - Better candidates highlighted by our
staff of experts.
G - Previously featured
in past reports as yellow but may no longer be buyable under the
guidelines.
***Last / Change / Volume data in this table is the closing quote data***
Symbol/Exchange
Company Name
Industry Group |
PRICE |
CHANGE
(%Change) |
Day High |
Volume
(% DAV)
(% 50 day avg vol) |
52 Wk Hi
% From Hi |
Featured
Date |
Price
Featured |
Pivot Featured |
|
Max Buy |
AMBA
-
NASDAQ
Ambarella Inc
ELECTRONICS - Semiconductor - Specialized
|
$14.36
|
+0.36
2.57% |
$14.45
|
533,104
170.65% of 50 DAV
50 DAV is 312,400
|
$16.00
-10.25%
|
3/26/2013
|
$15.31
|
PP = $14.83
|
|
MB = $15.57
|
 Most Recent Note - 4/8/2013 11:52:41 AM
Y - Halted its slide after enduring distributional pressure last week, abruptly retreating from its 52-week high after a "negative reversal" on 4/01/13. Disciplined investors avoid chasing extended stocks and always limit losses by selling if any stock falls more than -7% from their purchase price.
>>> The latest Featured Stock Update with an annotated graph appeared on 3/26/2013. Click here.
View all notes |
Alert me of new notes |
CANSLIM.net Company Profile |
SEC |
Zacks Reports |
StockTalk |
News |
Chart |
Request a new note
C
A N
S L
I M


|
CELG
-
NASDAQ
Celgene Corp
DRUGS - Drug Manufacturers - Major
|
$116.72
|
+0.29
0.25% |
$116.79
|
2,218,789
68.33% of 50 DAV
50 DAV is 3,247,000
|
$118.78
-1.73%
|
3/27/2013
|
$113.24
|
PP = $115.54
|
|
MB = $121.32
|
Most Recent Note - 4/5/2013 6:32:33 PM
Y - It recently wedged to new highs from an advanced "3-weeks tight" base with only average volume behind its gains above the new pivot point cited based on its 3/14/13 high plus 10 cents.
>>> The latest Featured Stock Update with an annotated graph appeared on 3/28/2013. Click here.
View all notes |
Alert me of new notes |
CANSLIM.net Company Profile |
SEC |
Zacks Reports |
StockTalk |
News |
Chart |
Request a new note
C
A N
S L
I M
|
CFNL
-
NASDAQ
Cardinal Financial Corp
BANKING - Regional - Southeast Banks
|
$17.28
|
+0.11
0.64% |
$17.30
|
106,163
52.07% of 50 DAV
50 DAV is 203,900
|
$18.40
-6.09%
|
3/22/2013
|
$17.99
|
PP = $18.29
|
|
MB = $19.20
|
Most Recent Note - 4/5/2013 6:33:51 PM
Y - Retreated near its 50 DMA line, enduring recent distributional pressure instead of rallying from the previously noted advanced "3-weeks tight" base. Previously noted - "Gains above the pivot point must have at least the bare minimum +40% above average volume, preferably more, to trigger a proper new (or add-on) technical buy signal."
>>> The latest Featured Stock Update with an annotated graph appeared on 3/18/2013. Click here.
View all notes |
Alert me of new notes |
CANSLIM.net Company Profile |
SEC |
Zacks Reports |
StockTalk |
News |
Chart |
Request a new note
C
A N
S L
I M
|
CMCSA
-
NASDAQ
Comcast Corp Cl A
MEDIA - CATV Systems
|
$41.63
|
+0.07
0.17% |
$41.71
|
9,523,157
66.35% of 50 DAV
50 DAV is 14,353,100
|
$42.61
-2.30%
|
12/3/2012
|
$37.08
|
PP = $38.06
|
|
MB = $39.96
|
Most Recent Note - 4/2/2013 4:36:31 PM
G - Finished near the session high with a gain on average volume for a new 52-week high. Found recent support and rallied from its 50 DMA line. Relative Strength Rating is at 79, just below the 80+ guideline for buy candidates. Fundamental concerns also remain since it reported earnings +11% on +6% sales revenues for the Dec '12 quarter, below the +25% minimum guideline (C criteria).
>>> The latest Featured Stock Update with an annotated graph appeared on 3/19/2013. Click here.
View all notes |
Alert me of new notes |
CANSLIM.net Company Profile |
SEC |
Zacks Reports |
StockTalk |
News |
Chart |
Request a new note
C
A N
S L
I M
|
EVER
-
NYSE
Everbank Financial Corp
BANKING
|
$15.00
|
-0.07
-0.46% |
$15.10
|
450,844
47.57% of 50 DAV
50 DAV is 947,800
|
$17.29
-13.24%
|
3/4/2013
|
$15.38
|
PP = $15.83
|
|
MB = $16.62
|
Most Recent Note - 4/2/2013 4:40:04 PM
G - Slumped to a close just below its 50 DMA line ($15.16 now) today. That important short-term average has acted as support since damaging losses violated prior highs in the $16 area raising concerns while completely negating its prior technical breakout.
>>> The latest Featured Stock Update with an annotated graph appeared on 4/2/2013. Click here.
View all notes |
Alert me of new notes |
CANSLIM.net Company Profile |
SEC |
Zacks Reports |
StockTalk |
News |
Chart |
Request a new note
C
A N
S L
I M
|
Symbol/Exchange
Company Name
Industry Group |
PRICE |
CHANGE
(%Change) |
Day High |
Volume
(% DAV)
(% 50 day avg vol) |
52 Wk Hi
% From Hi |
Featured
Date |
Price
Featured |
Pivot Featured |
|
Max Buy |
FLT
-
NYSE
Fleetcor Technologies
DIVERSIFIED SERVICES - Business/Management Services
|
$76.44
|
+1.19
1.58% |
$76.57
|
480,989
59.06% of 50 DAV
50 DAV is 814,400
|
$78.37
-2.46%
|
3/21/2013
|
$71.14
|
PP = $73.00
|
|
MB = $76.65
|
Most Recent Note - 4/5/2013 12:09:36 PM
Y - Color code is changed to yellow while retreating below its "max buy" level, but recent distributional pressure is raising concerns for the market and all stocks. Prior high in the $72 area defines near-term support to watch on pullbacks.
>>> The latest Featured Stock Update with an annotated graph appeared on 3/21/2013. Click here.
View all notes |
Alert me of new notes |
CANSLIM.net Company Profile |
SEC |
Zacks Reports |
StockTalk |
News |
Chart |
Request a new note
C
A N
S L
I M
|
LNKD
-
NYSE
Linkedin Corp Class A
INTERNET - Internet Information Providers
|
$172.12
|
-0.65
-0.38% |
$173.42
|
928,473
37.50% of 50 DAV
50 DAV is 2,475,900
|
$184.15
-6.53%
|
2/8/2013
|
$147.04
|
PP = $127.55
|
|
MB = $133.93
|
Most Recent Note - 4/5/2013 6:35:46 PM
G - Consolidating for just a couple of weeks, extended from any sound base pattern and well above its 50 DMA line which defines important near term support to watch. See the latest FSU analysis for more details and a new annotated graph.
>>> The latest Featured Stock Update with an annotated graph appeared on 4/5/2013. Click here.
View all notes |
Alert me of new notes |
CANSLIM.net Company Profile |
SEC |
Zacks Reports |
StockTalk |
News |
Chart |
Request a new note
C
A N
S L
I M
|
MIDD
-
NASDAQ
Middleby Corp
MANUFACTURING - Diversified Machinery
|
$146.45
|
-0.81
-0.55% |
$147.84
|
66,518
71.83% of 50 DAV
50 DAV is 92,600
|
$154.74
-5.36%
|
10/8/2012
|
$118.46
|
PP = $122.67
|
|
MB = $128.80
|
Most Recent Note - 4/8/2013 5:52:53 PM
G - Recently slumping below its 50 DMA line raising concerns with losses on light volume. Fundamental concerns were recently noted.
>>> The latest Featured Stock Update with an annotated graph appeared on 3/25/2013. Click here.
View all notes |
Alert me of new notes |
CANSLIM.net Company Profile |
SEC |
Zacks Reports |
StockTalk |
News |
Chart |
Request a new note
C
A N
S L
I M
|
MNTX
-
NASDAQ
Manitex International
MANUFACTURING - Diversified Machinery
|
$10.87
|
+0.05
0.46% |
$10.97
|
128,069
62.93% of 50 DAV
50 DAV is 203,500
|
$13.14
-17.28%
|
3/20/2013
|
$11.29
|
PP = $12.05
|
|
MB = $12.65
|
Most Recent Note - 4/8/2013 5:58:04 PM
Y - Quietly holding its ground near its 50 DMA line. Recent low ($10.21 on 4/04/13) defines important near-term support below its 50 DMA line. Disciplined investors avoid chasing extended stocks and always limit losses by selling if any stock falls more than -7% from their purchase price.
>>> The latest Featured Stock Update with an annotated graph appeared on 3/20/2013. Click here.
View all notes |
Alert me of new notes |
CANSLIM.net Company Profile |
SEC |
Zacks Reports |
StockTalk |
News |
Chart |
Request a new note
C
A N
S L
I M
|
MRLN
-
NASDAQ
Marlin Business Services
DIVERSIFIED SERVICES - Rental and Leasing Services
|
$22.42
|
-0.10
-0.44% |
$22.77
|
13,929
55.94% of 50 DAV
50 DAV is 24,900
|
$23.98
-6.51%
|
3/15/2013
|
$22.29
|
PP = $23.18
|
|
MB = $24.34
|
Most Recent Note - 4/4/2013 12:54:49 PM
Y - Volume was above average on the prior session as it tallied a small gain against a mostly negative market backdrop. Stubbornly holding its ground within close striking distance of its 52-week high. Previously noted - "Subsequent volume-driven gains above the pivot point could help clinch a more convincing technical buy signal."
>>> The latest Featured Stock Update with an annotated graph appeared on 3/15/2013. Click here.
View all notes |
Alert me of new notes |
CANSLIM.net Company Profile |
SEC |
Zacks Reports |
StockTalk |
News |
Chart |
Request a new note
C
A N
S L
I M
|
Symbol/Exchange
Company Name
Industry Group |
PRICE |
CHANGE
(%Change) |
Day High |
Volume
(% DAV)
(% 50 day avg vol) |
52 Wk Hi
% From Hi |
Featured
Date |
Price
Featured |
Pivot Featured |
|
Max Buy |
MWIV
-
NASDAQ
M W I Veterinary Supply
HEALTH SERVICES - Medical Instruments and; Supplies
|
$130.66
|
-0.68
-0.52% |
$132.68
|
48,317
83.59% of 50 DAV
50 DAV is 57,800
|
$137.18
-4.75%
|
3/4/2013
|
$130.90
|
PP = $129.45
|
|
MB = $135.92
|
Most Recent Note - 4/4/2013 6:34:36 PM
Y - Consolidating above its 50 DMA line and above its pivot point with volume totals cooling in recent weeks. See the latest FSU analysis for more details an a new annotated graph.
>>> The latest Featured Stock Update with an annotated graph appeared on 4/4/2013. Click here.
View all notes |
Alert me of new notes |
CANSLIM.net Company Profile |
SEC |
Zacks Reports |
StockTalk |
News |
Chart |
Request a new note
C
A N
S L
I M
|
N
-
NYSE
Netsuite Inc
DIVERSIFIED SERVICES - Business/Management Services
|
$77.65
|
+0.27
0.35% |
$78.05
|
211,054
54.98% of 50 DAV
50 DAV is 383,900
|
$80.33
-3.34%
|
12/12/2012
|
$64.75
|
PP = $67.12
|
|
MB = $70.48
|
Most Recent Note - 4/8/2013 5:54:49 PM
G - It is extended from its prior base and pulled back from all-time highs last week after a streak of 7 consecutive weekly gains. Its 50 DMA line defines important near-term support to watch.
>>> The latest Featured Stock Update with an annotated graph appeared on 4/1/2013. Click here.
View all notes |
Alert me of new notes |
CANSLIM.net Company Profile |
SEC |
Zacks Reports |
StockTalk |
News |
Chart |
Request a new note
C
A N
S L
I M
|
NSR
-
NYSE
Neustar Inc
TELECOMMUNICATIONS - Diversified Communication Serv
|
$43.70
|
+0.69
1.60% |
$43.72
|
293,076
62.18% of 50 DAV
50 DAV is 471,300
|
$47.24
-7.49%
|
3/8/2013
|
$44.99
|
PP = $47.34
|
|
MB = $49.71
|
Most Recent Note - 4/4/2013 12:57:48 PM
G - Color code is changed to green while slumping below its 50 DMA line and undercutting its prior lows, weakness raising concerns and triggering technical sell signals. Its Relative Strength rating has slumped to 63, well below the 80+ minimum guideline for buy candidates.
>>> The latest Featured Stock Update with an annotated graph appeared on 3/27/2013. Click here.
View all notes |
Alert me of new notes |
CANSLIM.net Company Profile |
SEC |
Zacks Reports |
StockTalk |
News |
Chart |
Request a new note
C
A N
S L
I M
|
RRTS
-
NYSE
Roadrunner Trans Systems
TRANSPORTATION - Air Delivery and Freight Service
|
$23.15
|
+0.13
0.56% |
$23.18
|
131,914
73.53% of 50 DAV
50 DAV is 179,400
|
$23.71
-2.36%
|
4/3/2013
|
$22.77
|
PP = $23.75
|
|
MB = $24.94
|
Most Recent Note - 4/5/2013 12:24:26 PM
Y - Holding its ground stubbornly and perched within close striking distance of its 52-week high. Disciplined investors will watch for volume-driven gains above its pivot point which are still needed to trigger a new technical buy signal. Fundamentals remain strong enough to still satisfy the C and A criteria, however decelerating sales revenues and earnings increases in sequential quarterly comparisons through the Dec '12 quarter is a concern. Completed a new Public Offering on 12/06/12 and, technically, it broke out above previously stubborn resistance in $19 area with volume-driven gains in January. See the latest FSU analysis for more details and a new annotated graph.
>>> The latest Featured Stock Update with an annotated graph appeared on 4/3/2013. Click here.
View all notes |
Alert me of new notes |
CANSLIM.net Company Profile |
SEC |
Zacks Reports |
StockTalk |
News |
Chart |
Request a new note
C
A N
S L
I M
|
VRX
-
NYSE
Valeant Pharmaceuticals
DRUGS - Drug Manufacturers - Other
|
$72.12
|
+0.33
0.46% |
$72.18
|
934,206
66.19% of 50 DAV
50 DAV is 1,411,400
|
$76.56
-5.80%
|
12/20/2012
|
$60.24
|
PP = $61.21
|
|
MB = $64.27
|
Most Recent Note - 4/8/2013 5:51:08 PM
G - Consolidating above its 50 DMA line defining important near term support following loss with heavy volume on M&A news. See latest FSU analysis for more details and a new annotated graph.
>>> The latest Featured Stock Update with an annotated graph appeared on 4/8/2013. Click here.
View all notes |
Alert me of new notes |
CANSLIM.net Company Profile |
SEC |
Zacks Reports |
StockTalk |
News |
Chart |
Request a new note
C
A N
S L
I M
|
Symbol/Exchange
Company Name
Industry Group |
PRICE |
CHANGE
(%Change) |
Day High |
Volume
(% DAV)
(% 50 day avg vol) |
52 Wk Hi
% From Hi |
Featured
Date |
Price
Featured |
Pivot Featured |
|
Max Buy |
|
|
|
THESE ARE NOT BUY RECOMMENDATIONS!
Comments contained in the body of this report are technical
opinions only. The material herein has been obtained
from sources believed to be reliable and accurate, however,
its accuracy and completeness cannot be guaranteed.
This site is not an investment advisor, hence it does
not endorse or recommend any securities or other investments.
Any recommendation contained in this report may not
be suitable for all investors and it is not to be deemed
an offer or solicitation on our part with respect to
the purchase or sale of any securities. All trademarks,
service marks and trade names appearing in this report
are the property of their respective owners, and are
likewise used for identification purposes only.
This report is a service available
only to active Paid Premium Members.
You may opt-out of receiving report notifications
at any time. Questions or comments may be submitted
by writing to Premium Membership Services 665 S.E. 10 Street, Suite 201 Deerfield Beach, FL 33441-5634 or by calling 1-800-965-8307
or 954-785-1121.
|
|
|

