You are not logged in.
This means you
CAN ONLY VIEW reports that were published prior to Monday, April 14, 2025.
You
MUST UPGRADE YOUR MEMBERSHIP if you want to see any current reports.
AFTER MARKET UPDATE - THURSDAY, APRIL 8TH, 2010
Previous After Market Report Next After Market Report >>>
|
|
|
|
DOW |
+29.55 |
10,927.07 |
+0.27% |
|
Volume |
1,045,370,880 |
-9% |
|
Volume |
2,367,140,250 |
-18% |
|
NASDAQ |
+5.65 |
2,436.81 |
+0.23% |
|
Advancers |
1,557 |
50% |
|
Advancers |
1,376 |
49% |
|
S&P 500 |
+3.99 |
1,186.44 |
+0.34% |
|
Decliners |
1,437 |
46% |
|
Decliners |
1,302 |
46% |
|
Russell 2000 |
+0.18 |
699.64 |
+0.03% |
|
52 Wk Highs |
220 |
|
|
52 Wk Highs |
126 |
|
|
S&P 600 |
-0.61 |
370.61 |
-0.16% |
|
52 Wk Lows |
8 |
|
|
52 Wk Lows |
7 |
|
|
 |
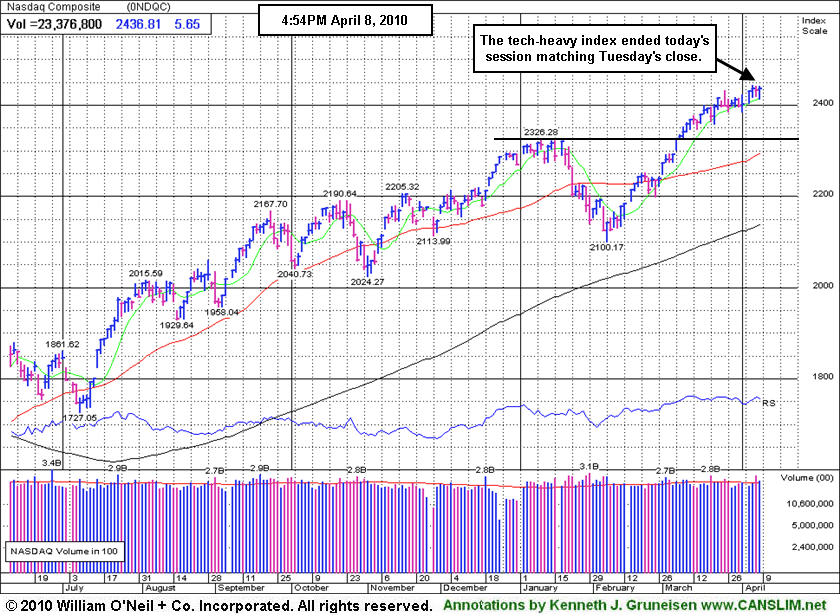
Volume Light And Breadth Unimpressive As Indices Posted Small Gains
Adam Sarhan, Contributing Writer,
The major averages rallied on Thursday after a slew of US retailers reported stronger than expected same store sales. Volume totals on the NYSE and on the Nasdaq exchange were reported lower compared to Wednesday's totals, revealing a lack of buying conviction from the institutional crowd after recent distributional pressure. Breadth was only slightly positive as advancers led decliners by very narrow margins on the NYSE and on the Nasdaq exchange. New 52-week highs trumped new lows on both exchanges yet again. There were 36 high-ranked companies from the CANSLIM.net Leaders List that made a new 52-week high and appeared on the CANSLIM.net BreakOuts Page, lower from the 52 issues that appeared on the prior session. A healthy crop of new leaders making new highs bodes well for any market rally, so the recent expansion in leadership has been a welcome post-holiday improvement. However, the rising number of distribution days has raised some concerns.
Stocks were under pressure as concern spread that Greece’s debt crisis may intensify and spread to other European nations which may hinder the global economic recovery. However, the fears subsided after European Central Bank President Jean-Claude Trichet said he does not expect Greece to default. In the US, same store sales from many of the nation's largest retailers topped estimates which bodes well for the economy. A slew of retailers hit fresh 52-week highs which bodes well for the entire retail sector. Elsewhere, the Labor Department said initial jobless claims unexpectedly rose +18,000 to +460,000 last week.
In recent weeks, fewer high-ranked leaders have emerged from sound bases while many leaders have consolidated after earlier breakouts in a mostly healthy fashion. The benchmark S&P 500 Index currently has 5 distribution days while the Nasdaq Composite and Dow Jones Industrial Average have 4 since the March 1, 2010 follow-though-day (FTD). These distribution days have not been damaging, however the simple fact that we currently have 5 distribution days for the S&P 500 suggests a more cautious approach may be prudent. Trade accordingly.
Don't miss your opportunity to view CANSLIM.net's Q1 2010 Webcast - Available free of charge now to all active StockNews (pay premium) members! The link to access the webcast is posted at the top of the white portion of the Premium Membership Homepage (click here). You may take advantage of the SPRING SPECIAL to reactivate an expired membership, start a new membership, or upgrade from your free membership level so you can access this informative webcast.
PICTURED: The tech-heavy Nasdaq Composite Index ended the session matching Tuesday's close.
|
|
|
 |
Influential Retail and Financial Groups Underpinning Market's Latest Gains
Kenneth J. Gruneisen - Passed the CAN SLIM® Master's Exam
The financial groups provided a positive influence behind the major averages' gains on Thursday as the Broker/Dealer Index ($XBD +0.60%) and Bank Index ($BKX +0.97%) both posted small gains. The tech sector showed mixed action again as the Semiconductor Index ($SOX -1.44%) and Networking Index ($NWX -0.61%) lost ground, meanwhile the Internet Index ($IIX +0.25%) and Biotechnology Index ($BTK +0.48%) posted small gains. The Integrated Oil Index ($XOI +0.61%) tallied a modest gain while the Oil Services Index ($OSX -0.28%) and Gold & Silver Index ($XAU -0.06%) inched lower, and the Healthcare Index ($HMO -0.96%) was also among the session's laggard groups.
Charts courtesy www.stockcharts.com
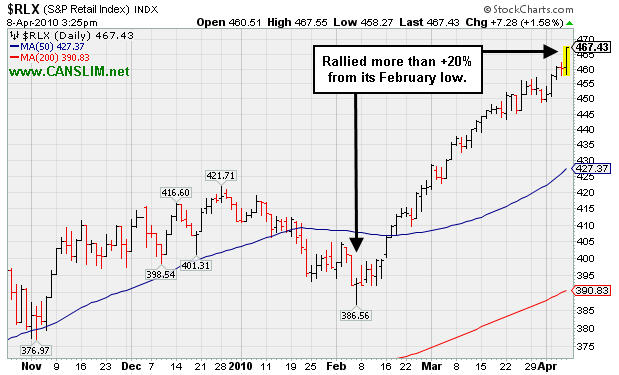
PICTURED: The Retail Index ($RLX +1.33%) tallied another solid gain, and it has rallied +20% from its February low.
| Oil Services |
$OSX |
213.48 |
-0.60 |
-0.28% |
+9.52% |
| Healthcare |
$HMO |
1,552.80 |
-15.10 |
-0.96% |
+5.42% |
| Integrated Oil |
$XOI |
1,104.03 |
+6.69 |
+0.61% |
+3.35% |
| Semiconductor |
$SOX |
371.47 |
-5.42 |
-1.44% |
+3.21% |
| Networking |
$NWX |
261.12 |
-1.60 |
-0.61% |
+13.01% |
| Internet |
$IIX |
252.49 |
+0.63 |
+0.25% |
+7.97% |
| Broker/Dealer |
$XBD |
121.17 |
+0.72 |
+0.60% |
+5.32% |
| Retail |
$RLX |
466.28 |
+6.13 |
+1.33% |
+13.42% |
| Gold & Silver |
$XAU |
175.95 |
-0.10 |
-0.06% |
+4.58% |
| Bank |
$BKX |
55.06 |
+0.53 |
+0.97% |
+28.92% |
| Biotech |
$BTK |
1,240.62 |
+5.94 |
+0.48% |
+31.68% |
|
|
|
 |
Downward Drift On Light Volume Considered Healthy Consolidation
Kenneth J. Gruneisen - Passed the CAN SLIM® Master's Exam
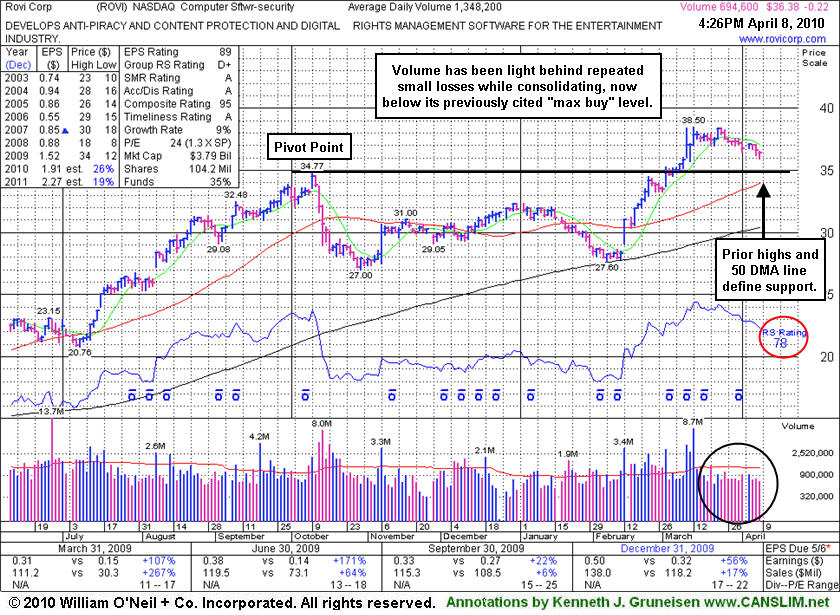
Rovi Corp (ROVI -$0.22 or -0.60% to $36.38) has been consolidating in a tight range with volume cooling for the past 4 weeks, hovering within close striking distance of its all-time high. Now it has drifted under its "max buy" level, so disciplined investors might consider it an ideal time to accumulate shares. Its color code was changed to yellow. Prior chart highs and its 50-day moving average (DMA) line coincide in the $34 area, defining an important support level to watch on pullbacks. Since its last appearance with an annotated graph in this FSU section on 3/17/10 under the headline Software - Security Firm Extended After Volume Driven Gains the high-ranked Computer Software - Security firm has been consolidating in a tight trading range.
ROVI triggered a technical buy signal with a high volume gain on 3/02/10. That was followed by a streak of 8 consecutive gains that included 3 consecutive gains into new high ground on heavy volume. It was featured in yellow with pivot point based upon its 10/09/09 high noted during its 2/25/10 mid-day report appearance (read here). Its subsequent breakout and ability to rally to a new 52-week high with at least +50% above average volume behind the gain may have signaled the beginning of a substantial advance. Earnings per share increases in 3 of the past 4 quarterly comparisons versus the year ago period showed better than +25% growth.
|
|
|
Color Codes Explained :
Y - Better candidates highlighted by our
staff of experts.
G - Previously featured
in past reports as yellow but may no longer be buyable under the
guidelines.
***Last / Change / Volume quote data in this table corresponds with the timestamp on the note***
Symbol/Exchange
Company Name
Industry Group |
Last |
Chg. |
Vol
% DAV |
Date Featured |
Price Featured |
Latest Pivot Point
Featured |
Status |
| Latest Max Buy Price |
ARUN
- NASDAQ
Aruba Networks Inc
COMPUTER HARDWARE - Networking & Communication Dev
|
$13.48
|
+0.08
|
1,044,690
66% DAV
1,580,600
|
2/19/2010
(Date
Featured) |
$12.71
(Price
Featured) |
PP = $11.94 |
G |
| MB = $12.54 |
Most Recent Note - 4/8/2010 4:07:41 PM
G - Consolidating near its 52-week high. Support to watch is defined by prior chart highs and its 50 DMA line in the upper $11 area.
>>> The latest Featured Stock Update with an annotated graph appeared on 3/31/2010. click here.
|
|
C
A
S
I |
News |
Chart |
SEC
View all notes Alert
me of new notes
Company
Profile
|
BIDU
- NASDAQ
Baidu Inc Ads
INTERNET - Internet Information Providers
|
$619.85
|
+2.11
|
1,053,778
64% DAV
1,655,300
|
1/13/2010
(Date
Featured) |
$431.25
(Price
Featured) |
PP = $426.75 |
G |
| MB = $448.09 |
Most Recent Note - 4/8/2010 4:08:57 PM
G - Holding its ground near all-time highs, extended from any sound base while on track for its 10th consecutive weekly gain. Recently noted that its sideways action led to a violation of an upward trendline, which may be an early sign of waning strength after a great run up.
>>> The latest Featured Stock Update with an annotated graph appeared on 3/24/2010. click here.
|
|
C
A
S
I |
News |
Chart |
SEC
View all notes Alert
me of new notes
Company
Profile
|
BRLI
- NASDAQ
Bio Reference Labs Inc
HEALTH SERVICES - Medical Laboratories & Researc
|
$45.32
|
+1.22
|
119,798
126% DAV
95,300
|
2/12/2010
(Date
Featured) |
$39.02
(Price
Featured) |
PP = $40.97 |
G |
| MB = $43.02 |
Most Recent Note - 4/8/2010 4:10:27 PM
G - Rallied toward prior chart highs for its second best close today after consolidating for a few weeks well above its 50 DMA line. Its recent chart low ($42.54 on 3/26/10) is an initial support level to watch.
>>> The latest Featured Stock Update with an annotated graph appeared on 3/22/2010. click here.
|
|
C
A
S
I |
News |
Chart |
SEC
View all notes Alert
me of new notes
Company
Profile
|
CISG
- NASDAQ
Cninsure Inc Ads
INSURANCE - Insurance Brokers
|
$27.91
|
+0.48
|
158,988
69% DAV
229,200
|
3/3/2010
(Date
Featured) |
$24.38
(Price
Featured) |
PP = $23.10 |
G |
| MB = $24.26 |
Most Recent Note - 4/8/2010 4:12:30 PM
G - Gain today with light volume for a new high close. Recently noted as "extended from a sound base, yet no overhead supply remains to act as resistance." It has traded up +14.5% since featured in yellow in the 3/03/10 mid-day report (read here).
>>> The latest Featured Stock Update with an annotated graph appeared on 3/23/2010. click here.
|
|
C
A
S
I |
News |
Chart |
SEC
View all notes Alert
me of new notes
Company
Profile
|
CRM
- NYSE
Salesforce.com Inc
INTERNET - Internet Software & Services
|
$77.95
|
+0.77
|
1,585,230
90% DAV
1,770,200
|
3/5/2010
(Date
Featured) |
$72.28
(Price
Featured) |
PP = $75.53 |
Y |
| MB = $79.31 |
Most Recent Note - 4/8/2010 4:16:40 PM
Y - Gain today with near average volume for its second best close ever. A gain above the pivot point with heavy volume at least +50% above average is required to trigger a proper technical buy signal.
>>> The latest Featured Stock Update with an annotated graph appeared on 3/25/2010. click here.
|
|
C
A
S
I |
News |
Chart |
SEC
View all notes Alert
me of new notes
Company
Profile
|
CTRP
- NASDAQ
Ctrip.com Intl Ltd Adr
LEISURE - Resorts & Casinos
|
$39.05
|
-0.27
|
1,258,747
58% DAV
2,183,200
|
3/25/2010
(Date
Featured) |
$40.74
(Price
Featured) |
PP = $39.40 |
Y |
| MB = $41.37 |
Most Recent Note - 4/8/2010 4:18:12 PM
Y - Third consecutive loss with light or average volume while hovering near all-time highs. On 4/01/10 it gapped up and surged to a new high, briefly trading above its "max buy" level, but while its gain above its pivot point was backed by +72% above average volume, it encountered distributional pressure and quickly reversed a large part of its early gain to ultimately close in the lower part of its intra-day range. CTRP has been stalled at all-time highs since 3/25/10 when a detailed Stock Bulletin with annotated graph and expert analysis was published (read here).
>>> The latest Featured Stock Update with an annotated graph appeared on 3/25/2010. click here.
|
|
C
A
S
I |
News |
Chart |
SEC
View all notes Alert
me of new notes
Company
Profile
|
EZPW
- NASDAQ
Ezcorp Inc Cl A
SPECIALTY RETAIL - Specialty Retail, Other
|
$21.14
|
+0.06
|
263,427
50% DAV
526,000
|
2/19/2010
(Date
Featured) |
$19.03
(Price
Featured) |
PP = $18.80 |
G |
| MB = $19.74 |
Most Recent Note - 4/8/2010 4:19:04 PM
G - Quietly holding its ground while consolidating well above its 50 DMA line and its recent chart low ($19.73 on 3/16/10) that define near-term support. This high-ranked Finance - Consumer/Commercial Loans firm is within close striking distance of its all-time high and has no overhead supply to act as resistance.
>>> The latest Featured Stock Update with an annotated graph appeared on 3/29/2010. click here.
|
|
C
A
S
I |
News |
Chart |
SEC
View all notes Alert
me of new notes
Company
Profile
|
GMCR
- NASDAQ
Green Mtn Coffee Roastrs
FOOD & BEVERAGE - Processed & Packaged Goods
|
$96.37
|
+0.39
|
656,218
57% DAV
1,153,900
|
2/26/2010
(Date
Featured) |
$84.39
(Price
Featured) |
PP = $88.75 |
G |
| MB = $93.19 |
Most Recent Note - 4/8/2010 4:20:23 PM
G - This high-ranked leader is extended from an ideal base and trading above the "max buy" level previously cited. Support to watch on pullbacks is at prior chart highs and its 50-day moving average (DMA) line now coinciding in the $88 area.
>>> The latest Featured Stock Update with an annotated graph appeared on 4/5/2010. click here.
|
|
C
A
S
I |
News |
Chart |
SEC
View all notes Alert
me of new notes
Company
Profile
|
PCLN
- NASDAQ
Priceline.com Inc
INTERNET - Internet Software & Services
|
$399.55
|
-4.72
|
584,812
N/A
|
11/1/2002
(Date
Featured) |
$399.55
(Price
Featured) |
PP = $428.20 |
Y |
| MB = $449.61 |
Most Recent Note - 1/2/2011
Y - Returns to Featured Stocks list with its appearance in the January 2011 CANSLIM.net News including detailed analysis and annotated daily and weekly graphs.
>>> The latest Featured Stock Update with an annotated graph appeared on 3/30/2010. click here.
|
|
C
A
S
I |
News |
Chart |
SEC
View all notes Alert
me of new notes
Company
Profile
|
PEGA
- NASDAQ
Pegasystems Inc
COMPUTER SOFTWARE & SERVICES - Business Software & Services
|
$37.74
|
-0.39
|
89,874
43% DAV
210,600
|
2/26/2010
(Date
Featured) |
$36.00
(Price
Featured) |
PP = $38.55 |
Y |
| MB = $40.48 |
Most Recent Note - 4/8/2010 4:22:45 PM
Y - Quietly consolidating near support at prior chart highs and its 50 DMA line which coincide in the $37 area. Its Relative Strength rank has been slumping while it has failed to follow through with any confirming gains with above average volume since its considerable gap up gain on 3/15/10 triggered a technical buy signal.
>>> The latest Featured Stock Update with an annotated graph appeared on 4/6/2010. click here.
|
|
C
A
S
I |
News |
Chart |
SEC
View all notes Alert
me of new notes
Company
Profile
|
ROVI
- NASDAQ
Rovi Corp
COMPUTER SOFTWARE & SERVICES - Security Software & Services
|
$36.38
|
-0.22
|
694,596
51% DAV
1,353,100
|
2/25/2010
(Date
Featured) |
$33.54
(Price
Featured) |
PP = $34.87 |
Y |
| MB = $36.61 |
Most Recent Note - 4/8/2010 4:31:35 PM
Y - Consolidating under its "max buy" level today after 4 weeks of trading in a tight range with volume cooling. Color code is changed to yellow. Prior chart highs and its 50 DMA line, coinciding in the $34 area, define an important support level to watch on pullbacks.
>>> The latest Featured Stock Update with an annotated graph appeared on 4/8/2010. click here.
|
|
C
A
S
I |
News |
Chart |
SEC
View all notes Alert
me of new notes
Company
Profile
|
SIRO
- NASDAQ
Sirona Dental Systems
HEALTH SERVICES - Medical Instruments & Supplies
|
$37.90
|
+0.03
|
336,648
55% DAV
607,900
|
2/16/2010
(Date
Featured) |
$36.43
(Price
Featured) |
PP = $36.15 |
G |
| MB = $37.96 |
Most Recent Note - 4/8/2010 4:37:26 PM
G - Positive reversal today while hovering near all-time highs. Prior chart highs and its 50 DMA line in the $36 area define important support to watch.
>>> The latest Featured Stock Update with an annotated graph appeared on 3/26/2010. click here.
|
|
C
A
S
I |
News |
Chart |
SEC
View all notes Alert
me of new notes
Company
Profile
|
ULTA
- NASDAQ
Ulta Salon Cosm & Frag
SPECIALTY RETAIL - Specialty Retail, Other
|
$22.15
|
-0.05
|
134,927
36% DAV
375,800
|
3/12/2010
(Date
Featured) |
$22.81
(Price
Featured) |
PP = $21.72 |
Y |
| MB = $22.81 |
Most Recent Note - 4/8/2010 4:39:24 PM
Y - Quietly held its ground today. Color code was changed to yellow after below average volume losses led it to drift below the previously cited "max buy" level. A detailed Stock Bulletin with annotated graph was published soon after it was featured in the 3/12/10 mid-day report.
>>> The latest Featured Stock Update with an annotated graph appeared on 4/1/2010. click here.
|
|
C
A
S
I |
News |
Chart |
SEC
View all notes Alert
me of new notes
Company
Profile
|
VPRT
- NASDAQ
Vistaprint Nv
DIVERSIFIED SERVICES - Business/Management Services
|
$58.80
|
+0.19
|
268,085
62% DAV
434,600
|
3/1/2010
(Date
Featured) |
$57.72
(Price
Featured) |
PP = $59.70 |
G |
| MB = $62.69 |
Most Recent Note - 4/8/2010 4:40:30 PM
G - Still holding its ground above its 50 DMA line. Distributional action recently pressured it near that short-term average line, raising concerns. Color code was changed to green. It did not trigger a technical buy signal since it was featured in the March 2010 CANSLIM.net News monthly newsletter (read here). As previously noted, "Its gain on 3/02/10 was below the volume guidelines for buyable breakouts under the investment system."
>>> The latest Featured Stock Update with an annotated graph appeared on 3/19/2010. click here.
|
|
C
A
S
I |
News |
Chart |
SEC
View all notes Alert
me of new notes
Company
Profile
|
|
|
|
THESE ARE NOT BUY RECOMMENDATIONS!
Comments contained in the body of this report are technical
opinions only. The material herein has been obtained
from sources believed to be reliable and accurate, however,
its accuracy and completeness cannot be guaranteed.
This site is not an investment advisor, hence it does
not endorse or recommend any securities or other investments.
Any recommendation contained in this report may not
be suitable for all investors and it is not to be deemed
an offer or solicitation on our part with respect to
the purchase or sale of any securities. All trademarks,
service marks and trade names appearing in this report
are the property of their respective owners, and are
likewise used for identification purposes only.
This report is a service available
only to active Paid Premium Members.
You may opt-out of receiving report notifications
at any time. Questions or comments may be submitted
by writing to Premium Membership Services 665 S.E. 10 Street, Suite 201 Deerfield Beach, FL 33441-5634 or by calling 1-800-965-8307
or 954-785-1121.
|
|
|


