You are not logged in.
This means you
CAN ONLY VIEW reports that were published prior to Monday, April 14, 2025.
You
MUST UPGRADE YOUR MEMBERSHIP if you want to see any current reports.
AFTER MARKET UPDATE - WEDNESDAY, APRIL 7TH, 2010
Previous After Market Report Next After Market Report >>>
|
|
|
|
DOW |
-72.47 |
10,897.52 |
-0.66% |
|
Volume |
1,151,623,390 |
+23% |
|
Volume |
2,891,512,370 |
+36% |
|
NASDAQ |
-5.65 |
2,431.16 |
-0.23% |
|
Advancers |
1,103 |
35% |
|
Advancers |
1,244 |
44% |
|
S&P 500 |
-6.99 |
1,182.45 |
-0.59% |
|
Decliners |
1,923 |
61% |
|
Decliners |
1,483 |
52% |
|
Russell 2000 |
-2.02 |
699.46 |
-0.29% |
|
52 Wk Highs |
329 |
|
|
52 Wk Highs |
174 |
|
|
S&P 600 |
-0.98 |
371.22 |
-0.26% |
|
52 Wk Lows |
3 |
|
|
52 Wk Lows |
6 |
|
|
 |
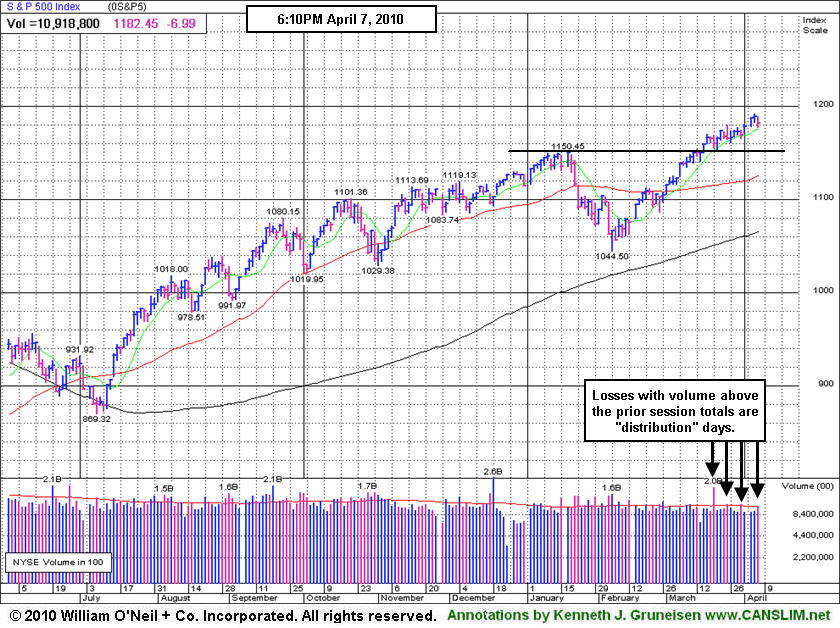
Distributional Pressure Hurts Rally As Some Leaders Slip Below Support
Adam Sarhan, Contributing Writer,
The major averages ended lower, experiencing their largest single-day decline since February, after consumer credit fell and concern about Greece defaulting accelerated. Volume totals on the NYSE and on the Nasdaq exchange were reported higher compared to Tuesday's totals which marked the latest distribution day for the major averages in recent weeks. Breadth was negative as decliners led advancers by about a 2-to-1 ratio on the NYSE, and by a 5-to-4 ratio on the Nasdaq exchange. New 52-week highs trumped new lows on both exchanges yet again. There were 52 high-ranked companies from the CANSLIM.net Leaders List that made a new 52-week high and appeared on the CANSLIM.net BreakOuts Page, down from the 58 issues that appeared on the prior session. A healthy crop of new leaders making new highs bodes well for any market rally, so the recent expansion in leadership has been a welcome post-holiday improvement. However, the rising number of distribution days has raised some concerns.
The Federal Reserve said consumer borrowing slid by a larger than expected reading of $11.5 billion in February. The fear that lower consumer spending may curtail economic growth played a pivotal role in sending stocks lower on Wednesday. In Europe, fear spread that Greece may default after rejecting the EU-IMF backed aid package. This sent the euro lower for a third consecutive day which put pressure on dollar denominated assets- mainly stocks and commodities.
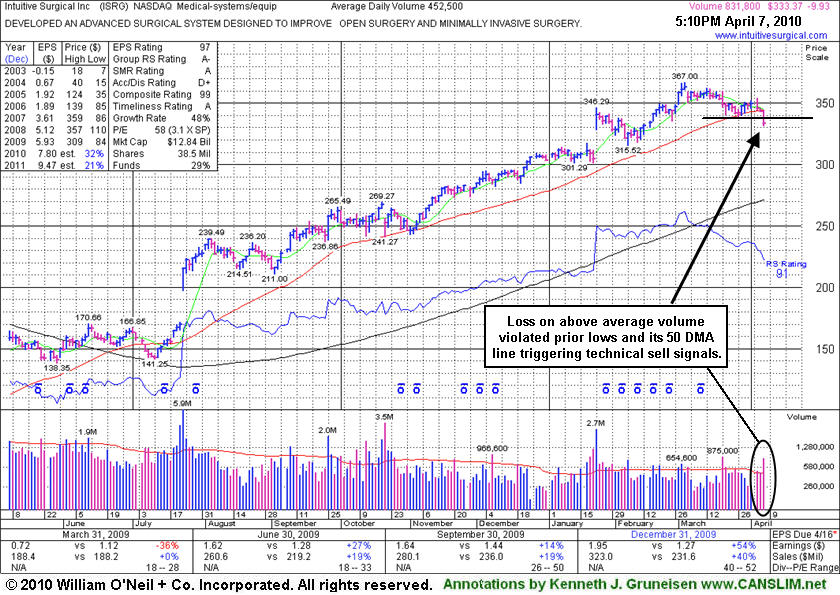
Today, Intuitive Surgical Inc. (ISRG -2.89%) violated recent chart lows and its 50-day moving average (DMA) line while volume was nearly twice average behind the technical damage. There is additional coverage in the Featured Stock Update section of the After Market Update, discussing the worrisome recent action in the longtime leader first highlighted in yellow back in the summer of 2004. It is disappointing whenever high-ranked leaders fail to find support near their short-term averages, a level where healthy stocks normally find support as institutional investors add to their holdings when they are still optimistic about the companies' outlook.
In recent weeks, fewer high-ranked leaders have emerged from sound bases while many leaders have consolidated after earlier breakouts in a mostly healthy fashion. The benchmark S&P 500 Index currently has 5 distribution days while the Nasdaq Composite and Dow Jones Industrial Average have 4 since the March 1, 2010 follow-though-day (FTD). These distribution days have not been damaging, however the simple fact that we currently have 5 distribution days for the S&P 500 suggests a more cautious approach may be prudent. Trade accordingly.
Don't miss your opportunity to view CANSLIM.net's Q1 2010 Webcast - Available free of charge now to all active StockNews (pay premium) members! The link to access the webcast is posted at the top of the white portion of the Premium Membership Homepage (click here). You may take advantage of the SPRING SPECIAL to reactivate an expired membership, start a new membership, or upgrade from your free membership level so you can access this informative webcast.
PICTURED: The benchmark S&P 500 Index fell on higher volume today. Losses with volume above the prior session totals are "distribution" days, some of which are clearly identified with arrows on the above chart.
|
|
|
 |
Broker/Dealer Index Hit New 2010 High Intra-Day
Kenneth J. Gruneisen - Passed the CAN SLIM® Master's Exam
The Gold & Silver Index ($XAU +2.01%) rallied while other defensive areas were weak on Wednesday. The Healthcare Index ($HMO -2.20%) fell, and the Integrated Oil Index ($XOI -1.62%) and Oil Services Index ($OSX -1.28%) slumped. The tech sector was mixed and indecisive as the Biotechnology Index ($BTK -0.65%) and Internet Index ($IIX -0.46%) closed with small losses and the Networking Index ($NWX +0.07%) and Semiconductor Index ($SOX +0.36%) inched higher. Very mild losses for the Bank Index ($BKX -0.38%) and Retail Index ($RLX -0.07%) contributed to the major averages' slightly negative bias.
Charts courtesy www.stockcharts.com
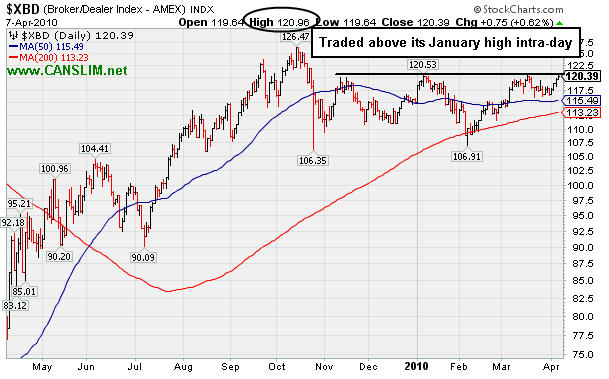
PICTURED: The Broker/Dealer Index ($XBD +0.63%) traded above its January high intra-day.
| Oil Services |
$OSX |
214.08 |
-2.78 |
-1.28% |
+9.83% |
| Healthcare |
$HMO |
1,567.90 |
-35.28 |
-2.20% |
+6.45% |
| Integrated Oil |
$XOI |
1,097.34 |
-18.11 |
-1.62% |
+2.73% |
| Semiconductor |
$SOX |
376.89 |
+1.37 |
+0.36% |
+4.72% |
| Networking |
$NWX |
262.68 |
+0.18 |
+0.07% |
+13.68% |
| Internet |
$IIX |
251.80 |
-1.17 |
-0.46% |
+7.67% |
| Broker/Dealer |
$XBD |
120.38 |
+0.75 |
+0.63% |
+4.63% |
| Retail |
$RLX |
460.15 |
-0.30 |
-0.07% |
+11.93% |
| Gold & Silver |
$XAU |
176.05 |
+3.47 |
+2.01% |
+4.64% |
| Bank |
$BKX |
54.53 |
-0.21 |
-0.38% |
+27.68% |
| Biotech |
$BTK |
1,234.41 |
-8.10 |
-0.65% |
+31.02% |
|
|
|
 |
Volume Surges Behind Damaging Losses
Kenneth J. Gruneisen - Passed the CAN SLIM® Master's Exam
Intuitive Surgical Inc. (ISRG -$9.93 or -2.89% to $333.37) suffered a technically damaging loss today as it sank under its recent chart low ($338.52 on 3/26/10) and further below its 50-day moving average (DMA) line, raising more serious concerns and triggering more worrisome sell signals while volume increased to nearly twice its average daily trading total. A prompt repair of its 50 DMA line would be a reassuring sign of support, but until it rises back above that important short-term average the odds are in favor of a deeper consolidation and greater caution is in order. Based on the weakness it will be dropped from the Featured Stocks list tonight. It was repeatedly noted that its gains in February and March lacked the substantial above average volume that would be truly indicative of institutional (I criteria) buying demand which can lead to a meaningful rally. Since then, volume conviction clearly rose on the down sessions that negated its half-hearted rally from its prior base, and bringing on the latest technical damage to its chart.
Quarterly comparisons have not shown perfectly steady increases above the +25% guideline, yet the latest period ended December 31, 2009 showed a very impressive acceleration in sales revenues and earnings growth. It is due to report its next quarterly results on April 15th after the close, and while it may face an easy comparison versus the year ago sales revenues and earnings numbers, expectations are already lofty. The number of top-rated funds owning its shares has risen from 283 in Mar '09 to 313 in Dec '09, which is reassuring concerning the investment system's I criteria. ISRG was featured again most recently in the 1/22/10 mid-day report (read here), returning after some time off the Featured Stocks list. Its annual earnings history (the A criteria) has been very impressive. Earlier notes had outlined technical deterioration before and when it was last dropped from the Featured Stocks list on 6/10/08. ISRG traded up more than 13-fold since first featured in yellow in CANSLIM.net reports in the summer of 2004.
|
|
|
Color Codes Explained :
Y - Better candidates highlighted by our
staff of experts.
G - Previously featured
in past reports as yellow but may no longer be buyable under the
guidelines.
***Last / Change / Volume quote data in this table corresponds with the timestamp on the note***
Symbol/Exchange
Company Name
Industry Group |
Last |
Chg. |
Vol
% DAV |
Date Featured |
Price Featured |
Latest Pivot Point
Featured |
Status |
| Latest Max Buy Price |
ARUN
- NASDAQ
Aruba Networks Inc
COMPUTER HARDWARE - Networking & Communication Dev
|
$13.40
|
-0.36
|
1,597,334
100% DAV
1,590,300
|
2/19/2010
(Date
Featured) |
$12.71
(Price
Featured) |
PP = $11.94 |
G |
| MB = $12.54 |
Most Recent Note - 4/7/2010 5:18:56 PM
G - Loss today on average volume, pulling back from its 52-week high. Support to watch is defined by prior chart highs and its 50 DMA line in the upper $11 area.
>>> The latest Featured Stock Update with an annotated graph appeared on 3/31/2010. click here.
|
|
C
A
S
I |
News |
Chart |
SEC
View all notes Alert
me of new notes
Company
Profile
|
BIDU
- NASDAQ
Baidu Inc Ads
INTERNET - Internet Information Providers
|
$617.74
|
-1.67
|
1,493,190
89% DAV
1,669,500
|
1/13/2010
(Date
Featured) |
$431.25
(Price
Featured) |
PP = $426.75 |
G |
| MB = $448.09 |
Most Recent Note - 4/7/2010 5:40:40 PM
G - Held its ground today near all-time highs. It is extended from any sound base while on track for its 10th consecutive weekly gain. Recently noted that its sideways action led to a violation of an upward trendline, which may be an early sign of waning strength after a great run up.
>>> The latest Featured Stock Update with an annotated graph appeared on 3/24/2010. click here.
|
|
C
A
S
I |
News |
Chart |
SEC
View all notes Alert
me of new notes
Company
Profile
|
BRLI
- NASDAQ
Bio Reference Labs Inc
HEALTH SERVICES - Medical Laboratories & Researc
|
$44.10
|
+0.32
|
142,860
149% DAV
95,800
|
2/12/2010
(Date
Featured) |
$39.02
(Price
Featured) |
PP = $40.97 |
G |
| MB = $43.02 |
Most Recent Note - 4/7/2010 5:42:25 PM
G - Small gain today with above average volume. This high-ranked Medical/Dental Services firm is consolidating in a tight range near all-time highs and above its "max buy" level. Prior chart highs and its 50 DMA line coincide in the $40 area, defining important support to watch.
>>> The latest Featured Stock Update with an annotated graph appeared on 3/22/2010. click here.
|
|
C
A
S
I |
News |
Chart |
SEC
View all notes Alert
me of new notes
Company
Profile
|
CISG
- NASDAQ
Cninsure Inc Ads
INSURANCE - Insurance Brokers
|
$27.43
|
-0.01
|
313,185
137% DAV
229,200
|
3/3/2010
(Date
Featured) |
$24.38
(Price
Featured) |
PP = $23.10 |
G |
| MB = $24.26 |
Most Recent Note - 4/7/2010 5:44:58 PM
G - Hovering only -1.3% from its 52-week high. Recently noted as "extended from a sound base, yet no overhead supply remains to act as resistance." It has traded up as much as +14.02% since featured in yellow in the 3/03/10 mid-day report (read here).
>>> The latest Featured Stock Update with an annotated graph appeared on 3/23/2010. click here.
|
|
C
A
S
I |
News |
Chart |
SEC
View all notes Alert
me of new notes
Company
Profile
|
CRM
- NYSE
Salesforce.com Inc
INTERNET - Internet Software & Services
|
$77.18
|
-1.65
|
1,755,415
99% DAV
1,764,500
|
3/5/2010
(Date
Featured) |
$72.28
(Price
Featured) |
PP = $75.53 |
Y |
| MB = $79.31 |
Most Recent Note - 4/7/2010 5:48:42 PM
Y - Slumped back under its March high close today, erasing a large part of the prior session's gain with volume +40% above average while climbing above its pivot point to a new all-time high. The gain was below the minimum volume guideline of +50% above average volume required to trigger a proper technical buy signal.
>>> The latest Featured Stock Update with an annotated graph appeared on 3/25/2010. click here.
|
|
C
A
S
I |
News |
Chart |
SEC
View all notes Alert
me of new notes
Company
Profile
|
CTRP
- NASDAQ
Ctrip.com Intl Ltd Adr
LEISURE - Resorts & Casinos
|
$39.32
|
-0.39
|
2,088,451
94% DAV
2,213,400
|
3/25/2010
(Date
Featured) |
$40.74
(Price
Featured) |
PP = $39.40 |
Y |
| MB = $41.37 |
Most Recent Note - 4/7/2010 5:50:11 PM
Y - Hovering near all-time highs. On 4/01/10 it gapped up and surged to a new high, briefly trading above its "max buy" level, but while its gain above its pivot point was backed by +72% above average volume, it encountered distributional pressure and quickly reversed a large part of its early gain to ultimately close in the lower part of its intra-day range. CTRP has been stalled at all-time highs since 3/25/10 when a detailed Stock Bulletin with annotated graph and expert analysis was published (read here).
>>> The latest Featured Stock Update with an annotated graph appeared on 3/25/2010. click here.
|
|
C
A
S
I |
News |
Chart |
SEC
View all notes Alert
me of new notes
Company
Profile
|
EZPW
- NASDAQ
Ezcorp Inc Cl A
SPECIALTY RETAIL - Specialty Retail, Other
|
$21.08
|
-0.60
|
357,474
66% DAV
540,600
|
2/19/2010
(Date
Featured) |
$19.03
(Price
Featured) |
PP = $18.80 |
G |
| MB = $19.74 |
Most Recent Note - 4/7/2010 5:51:31 PM
G - Consolidating well above its 50 DMA line and its recent chart low ($19.73 on 3/16/10) that define near-term support. This high-ranked Finance - Consumer/Commercial Loans firm is within close striking distance of its all-time high and has no overhead supply to act as resistance.
>>> The latest Featured Stock Update with an annotated graph appeared on 3/29/2010. click here.
|
|
C
A
S
I |
News |
Chart |
SEC
View all notes Alert
me of new notes
Company
Profile
|
GMCR
- NASDAQ
Green Mtn Coffee Roastrs
FOOD & BEVERAGE - Processed & Packaged Goods
|
$95.98
|
-1.68
|
795,999
68% DAV
1,172,200
|
2/26/2010
(Date
Featured) |
$84.39
(Price
Featured) |
PP = $88.75 |
G |
| MB = $93.19 |
Most Recent Note - 4/7/2010 5:52:59 PM
G - Support to watch on pullbacks is at prior chart highs and its 50-day moving average (DMA) line now coinciding in the $88 area. This high-ranked leader is extended from an ideal base and trading above the "max buy" level previously cited.
>>> The latest Featured Stock Update with an annotated graph appeared on 4/5/2010. click here.
|
|
C
A
S
I |
News |
Chart |
SEC
View all notes Alert
me of new notes
Company
Profile
|
PCLN
- NASDAQ
Priceline.com Inc
INTERNET - Internet Software & Services
|
$399.55
|
-4.72
|
584,812
N/A
|
11/1/2002
(Date
Featured) |
$399.55
(Price
Featured) |
PP = $428.20 |
Y |
| MB = $449.61 |
Most Recent Note - 1/2/2011
Y - Returns to Featured Stocks list with its appearance in the January 2011 CANSLIM.net News including detailed analysis and annotated daily and weekly graphs.
>>> The latest Featured Stock Update with an annotated graph appeared on 3/30/2010. click here.
|
|
C
A
S
I |
News |
Chart |
SEC
View all notes Alert
me of new notes
Company
Profile
|
PEGA
- NASDAQ
Pegasystems Inc
COMPUTER SOFTWARE & SERVICES - Business Software & Services
|
$38.13
|
+0.08
|
139,411
66% DAV
212,400
|
2/26/2010
(Date
Featured) |
$36.00
(Price
Featured) |
PP = $38.55 |
Y |
| MB = $40.48 |
Most Recent Note - 4/7/2010 5:59:56 PM
Y - Posted a 4th consecutive gain today with below average volume. Quietly consolidating near support at prior chart highs and its 50 DMA line which coincide in the $37 area. Its Relative Strength ranks has been slumping while it has failed to follow through with any confirming gains with above average volume since its considerable gap up gain on 3/15/10 triggered a technical buy signal.
>>> The latest Featured Stock Update with an annotated graph appeared on 4/6/2010. click here.
|
|
C
A
S
I |
News |
Chart |
SEC
View all notes Alert
me of new notes
Company
Profile
|
ROVI
- NASDAQ
Rovi Corp
COMPUTER SOFTWARE & SERVICES - Security Software & Services
|
$36.60
|
-0.43
|
782,049
57% DAV
1,361,900
|
2/25/2010
(Date
Featured) |
$33.54
(Price
Featured) |
PP = $34.87 |
G |
| MB = $36.61 |
Most Recent Note - 4/7/2010 6:01:48 PM
G - Consolidating in a tight range with volume cooling for the past 4 weeks, hovering within close striking distance of its all-time high. Prior chart highs and its 50 DMA line, coinciding in the $34 area, define an important support level to watch on pullbacks.
>>> The latest Featured Stock Update with an annotated graph appeared on 3/17/2010. click here.
|
|
C
A
S
I |
News |
Chart |
SEC
View all notes Alert
me of new notes
Company
Profile
|
SIRO
- NASDAQ
Sirona Dental Systems
HEALTH SERVICES - Medical Instruments & Supplies
|
$37.87
|
-0.32
|
388,373
64% DAV
606,100
|
2/16/2010
(Date
Featured) |
$36.43
(Price
Featured) |
PP = $36.15 |
G |
| MB = $37.96 |
Most Recent Note - 4/7/2010 6:03:05 PM
G - Hovering near all-time highs. Prior chart highs and its 50 DMA line in the $36 area define important support to watch.
>>> The latest Featured Stock Update with an annotated graph appeared on 3/26/2010. click here.
|
|
C
A
S
I |
News |
Chart |
SEC
View all notes Alert
me of new notes
Company
Profile
|
ULTA
- NASDAQ
Ulta Salon Cosm & Frag
SPECIALTY RETAIL - Specialty Retail, Other
|
$22.20
|
-0.99
|
340,011
90% DAV
376,300
|
3/12/2010
(Date
Featured) |
$22.81
(Price
Featured) |
PP = $21.72 |
Y |
| MB = $22.81 |
Most Recent Note - 4/7/2010 6:05:39 PM
Y - Color code is changed to yellow after today's loss with below average volume as it consolidates below its previously cited "max buy" level. A detailed Stock Bulletin with annotated graph was published soon after it was featured in the 3/12/10 mid-day report.
>>> The latest Featured Stock Update with an annotated graph appeared on 4/1/2010. click here.
|
|
C
A
S
I |
News |
Chart |
SEC
View all notes Alert
me of new notes
Company
Profile
|
VPRT
- NASDAQ
Vistaprint Nv
DIVERSIFIED SERVICES - Business/Management Services
|
$58.61
|
-0.06
|
278,306
62% DAV
447,400
|
3/1/2010
(Date
Featured) |
$57.72
(Price
Featured) |
PP = $59.70 |
G |
| MB = $62.69 |
Most Recent Note - 4/7/2010 6:07:10 PM
G - Recently holding its ground near its 50 DMA line. Distributional action pressured it near that short-term average line last week, raising concerns. Color code was changed to green. It did not trigger a technical buy signal since it was featured in the March 2010 CANSLIM.net News monthly newsletter (read here). As previously noted, "Its gain on 3/02/10 was below the volume guidelines for buyable breakouts under the investment system."
>>> The latest Featured Stock Update with an annotated graph appeared on 3/19/2010. click here.
|
|
C
A
S
I |
News |
Chart |
SEC
View all notes Alert
me of new notes
Company
Profile
|
|
|
|
THESE ARE NOT BUY RECOMMENDATIONS!
Comments contained in the body of this report are technical
opinions only. The material herein has been obtained
from sources believed to be reliable and accurate, however,
its accuracy and completeness cannot be guaranteed.
This site is not an investment advisor, hence it does
not endorse or recommend any securities or other investments.
Any recommendation contained in this report may not
be suitable for all investors and it is not to be deemed
an offer or solicitation on our part with respect to
the purchase or sale of any securities. All trademarks,
service marks and trade names appearing in this report
are the property of their respective owners, and are
likewise used for identification purposes only.
This report is a service available
only to active Paid Premium Members.
You may opt-out of receiving report notifications
at any time. Questions or comments may be submitted
by writing to Premium Membership Services 665 S.E. 10 Street, Suite 201 Deerfield Beach, FL 33441-5634 or by calling 1-800-965-8307
or 954-785-1121.
|
|
|


