You are not logged in.
This means you
CAN ONLY VIEW reports that were published prior to Monday, April 14, 2025.
You
MUST UPGRADE YOUR MEMBERSHIP if you want to see any current reports.
AFTER MARKET UPDATE - MONDAY, APRIL 5TH, 2010
Previous After Market Report Next After Market Report >>>
|
|
|
|
DOW |
+46.48 |
10,973.55 |
+0.43% |
|
Volume |
899,661,140 |
-2% |
|
Volume |
2,070,151,220 |
-10% |
|
NASDAQ |
+26.95 |
2,429.53 |
+1.12% |
|
Advancers |
2,296 |
72% |
|
Advancers |
2,051 |
73% |
|
S&P 500 |
+9.34 |
1,187.44 |
+0.79% |
|
Decliners |
770 |
24% |
|
Decliners |
691 |
24% |
|
Russell 2000 |
+13.67 |
697.65 |
+2.00% |
|
52 Wk Highs |
479 |
|
|
52 Wk Highs |
217 |
|
|
S&P 600 |
+6.81 |
370.23 |
+1.87% |
|
52 Wk Lows |
6 |
|
|
52 Wk Lows |
11 |
|
|
 |
Post-Holiday Expansion in New Highs Is Encouraging
Adam Sarhan, Contributing Writer,
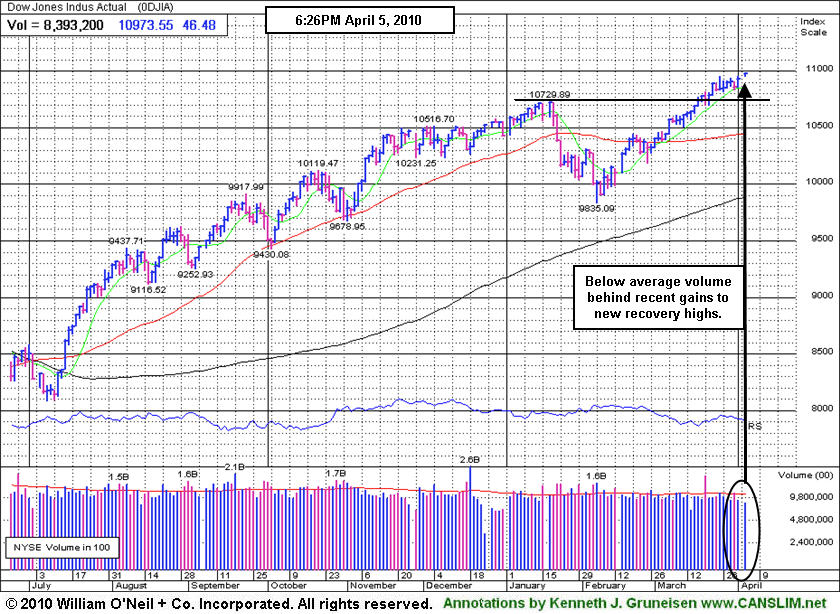
The major averages opened higher and posted gain on Monday after the latest round of stronger than expected economic data was released. Volume totals on the NYSE and on the Nasdaq exchange were reported lighter compared to Thursday's pre-holiday session totals. Breadth was positive as advancers led decliners by about a 3-to-1 ratio on the NYSE and on the Nasdaq exchange. New 52-week highs trumped new lows on both exchanges yet again. There were 79 high-ranked companies from the CANSLIM.net Leaders List that made a new 52-week high and appeared on the CANSLIM.net BreakOuts Page, a great expansion from the 43 issues that appeared on the prior session. A healthy crop of new leaders making new highs bodes well for any market rally, so the expansion in leadership was a welcome post-holiday improvement.
Monday was the first trading day after March's non-farm payrolls report was released. Stocks rallied around the world after the Labor Department reported the strongest monthly reading in payrolls since Q1 2007. The US dollar fell which also helped stocks and commodities rally. Crude oil broke out of a multi month base and hit a new multi month high as driving season approaches.
Elsewhere, the ISM released its service index which topped analysts' estimates. Separately, pending home sales unexpectedly rose which bodes well for the ailing housing market. The healthy housing data helped a slew of housing stocks rally as investors believe "the worst" is over concerning the housing market's downturn.
The benchmark S&P 500 Index currently has 4 distribution days while the Nasdaq Composite and Dow Jones Industrial Average have 3 since the March 1, 2010 follow-though-day (FTD). These distribution days have not been damaging, and normally it is considered healthy for the major averages to have less than 4 distribution days in a four week period. It is also a welcome sign to see the market continue to improve as investors digest the latest round of stronger than expected economic and earnings data. Remember that now that a new rally has been confirmed, the window is open to proactively be buying high quality breakouts meeting the investment system guidelines. Trade accordingly.
Don't miss your opportunity to view CANSLIM.net's Q1 2010 Webcast - Available free of charge now to all active StockNews (pay premium) members! The link to access the webcast is posted at the top of the white portion of the Premium Membership Homepage (click here). You may take advantage of the SPRING SPECIAL to reactivate an expired membership, start a new membership, or upgrade from your free membership level so you can access this informative webcast.
PICTURED: The Dow Jones Industrial Average rallied to a new recovery high, however volume has been below average behind recent gains the blue chip index has tallied.
|
|
|
 |
Strong Chip Group Underpins Tech Sector Gains
Kenneth J. Gruneisen - Passed the CAN SLIM® Master's Exam
Financial shares and the Retail Index ($RLX +1.39%) underpinned Monday's positive post-holiday session as solid gains from the Broker/Dealer Index ($XBD +1.06%) and Bank Index ($BKX +1.91%) had a positive influence on the major averages. The tech sector was led higher by a big gain from the Semiconductor Index ($SOX +2.98%) while the Networking Index ($NWX +1.97%) and Internet Index ($IIX +1.48%) also posted solid gains, yet the Biotechnology Index ($BTK +0.36%) finished with a smaller gain. Defensive groups also rose as the Healthcare Index ($HMO +0.41%), Gold & Silver Index ($XAU +1.05%), Oil Services Index ($OSX +2.16%), and Integrated Oil Index ($XOI +1.34%) tallied solid gains.
Charts courtesy www.stockcharts.com
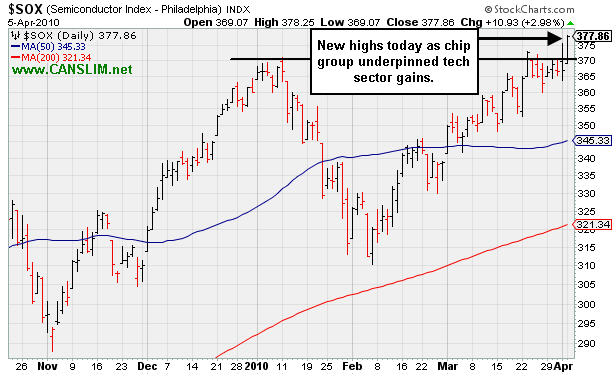
PICTURED: The Semiconductor Index ($SOX +2.98%) hit another new recovery high today as the chip group underpinned the tech sector's gains.
| Oil Services |
$OSX |
215.94 |
+4.56 |
+2.16% |
+10.78% |
| Healthcare |
$HMO |
1,594.45 |
+6.50 |
+0.41% |
+8.28% |
| Integrated Oil |
$XOI |
1,115.69 |
+14.76 |
+1.34% |
+4.40% |
| Semiconductor |
$SOX |
377.86 |
+10.93 |
+2.98% |
+4.99% |
| Networking |
$NWX |
259.92 |
+5.02 |
+1.97% |
+12.49% |
| Internet |
$IIX |
251.02 |
+3.66 |
+1.48% |
+7.34% |
| Broker/Dealer |
$XBD |
118.81 |
+1.25 |
+1.06% |
+3.27% |
| Retail |
$RLX |
457.87 |
+6.26 |
+1.39% |
+11.37% |
| Gold & Silver |
$XAU |
173.07 |
+1.79 |
+1.05% |
+2.86% |
| Bank |
$BKX |
53.44 |
+1.00 |
+1.91% |
+25.12% |
| Biotech |
$BTK |
1,246.18 |
+4.45 |
+0.36% |
+32.27% |
|
|
|
 |
Gain Leaves Leader Extended From Ideal Base
Kenneth J. Gruneisen - Passed the CAN SLIM® Master's Exam
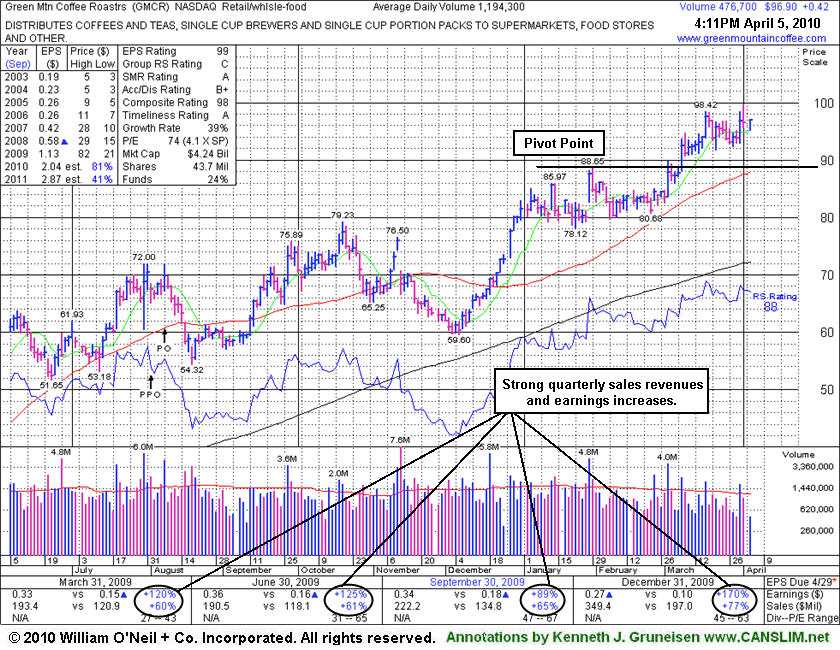
Green Mountain Coffee Roasters (GMCR +$0.46 or +0.48% to $96.94) posted a gain on very light volume today, closing just 67 cents below its best ever close. This high-ranked leader is extended from an ideal base and trading above the "max buy" level previously cited. Its gain on 3/08/10 with above average volume was noted as it triggered a most recent technical buy signal. Initial support to watch on pullbacks is at prior chart highs and its 50-day moving average (DMA) line now coinciding in the $88 area.
GMCR has shown mostly healthy action since showing up on 12/28/09 in the mid-day report (read here), returning the previously featured favorite to the Featured Stocks page at CANSLIM.net. Weak action had led it to be dropped from the Featured Stocks list on 12/01/09, but the repair of its prior 50-day moving average (DMA) line violation improved its outlook. Its has traded up as much as +282% since appearing with an annotated graph under the headline "It May Soon Be Time To Go Green" when featured in the January 2009 CANSLIM.net News (read here).
|
|
|
Color Codes Explained :
Y - Better candidates highlighted by our
staff of experts.
G - Previously featured
in past reports as yellow but may no longer be buyable under the
guidelines.
***Last / Change / Volume quote data in this table corresponds with the timestamp on the note***
Symbol/Exchange
Company Name
Industry Group |
Last |
Chg. |
Vol
% DAV |
Date Featured |
Price Featured |
Latest Pivot Point
Featured |
Status |
| Latest Max Buy Price |
ARUN
- NASDAQ
Aruba Networks Inc
COMPUTER HARDWARE - Networking & Communication Dev
|
$13.88
|
+0.23
|
851,106
53% DAV
1,591,600
|
2/19/2010
(Date
Featured) |
$12.71
(Price
Featured) |
PP = $11.94 |
G |
| MB = $12.54 |
Most Recent Note - 4/5/2010 5:27:48 PM
G - Small gain today on light volume for a new high close. Support to watch is defined by prior chart highs and its 50 DMA line in the upper $11 area.
>>> The latest Featured Stock Update with an annotated graph appeared on 3/31/2010. click here.
|
|
C
A
S
I |
News |
Chart |
SEC
View all notes Alert
me of new notes
Company
Profile
|
BIDU
- NASDAQ
Baidu Inc Ads
INTERNET - Internet Information Providers
|
$601.30
|
+1.30
|
672,906
40% DAV
1,680,200
|
1/13/2010
(Date
Featured) |
$431.25
(Price
Featured) |
PP = $426.75 |
G |
| MB = $448.09 |
Most Recent Note - 4/5/2010 5:34:30 PM
G - Stubbornly holding its ground, extended from any sound base. Its sideways action alone is leading to a violation of a previously noted upward trendline, which may be an early sign of waning strength after a great run up.
>>> The latest Featured Stock Update with an annotated graph appeared on 3/24/2010. click here.
|
|
C
A
S
I |
News |
Chart |
SEC
View all notes Alert
me of new notes
Company
Profile
|
BRLI
- NASDAQ
Bio Reference Labs Inc
HEALTH SERVICES - Medical Laboratories & Researc
|
$43.86
|
+0.11
|
54,722
57% DAV
96,400
|
2/12/2010
(Date
Featured) |
$39.02
(Price
Featured) |
PP = $40.97 |
G |
| MB = $43.02 |
Most Recent Note - 4/5/2010 5:36:09 PM
G - This high-ranked Medical/Dental Services firm is quietly consolidating in a tight range near all-time highs and above its "max buy" level. Prior chart highs and its 50 DMA line coincide in the $40 area, defining important support to watch.
>>> The latest Featured Stock Update with an annotated graph appeared on 3/22/2010. click here.
|
|
C
A
S
I |
News |
Chart |
SEC
View all notes Alert
me of new notes
Company
Profile
|
CISG
- NASDAQ
Cninsure Inc Ads
INSURANCE - Insurance Brokers
|
$27.80
|
+0.16
|
109,874
47% DAV
233,600
|
3/3/2010
(Date
Featured) |
$24.38
(Price
Featured) |
PP = $23.10 |
G |
| MB = $24.26 |
Most Recent Note - 4/5/2010 5:37:42 PM
G - Holding its ground at its 52-week high, extended from a sound base, yet no overhead supply remains to act as resistance. It was featured in yellow in the 3/03/10 mid-day report (read here).
>>> The latest Featured Stock Update with an annotated graph appeared on 3/23/2010. click here.
|
|
C
A
S
I |
News |
Chart |
SEC
View all notes Alert
me of new notes
Company
Profile
|
CRM
- NYSE
Salesforce.com Inc
INTERNET - Internet Software & Services
|
$76.85
|
+1.31
|
860,577
48% DAV
1,792,900
|
3/5/2010
(Date
Featured) |
$72.28
(Price
Featured) |
PP = $75.53 |
Y |
| MB = $79.31 |
Most Recent Note - 4/5/2010 5:38:48 PM
Y - Gain today with light volume, closing above its pivot point and only -1.5% from its all-time high. A solid gain above its pivot point with at least +50% above average volume is required to trigger a technical buy signal.
>>> The latest Featured Stock Update with an annotated graph appeared on 3/25/2010. click here.
|
|
C
A
S
I |
News |
Chart |
SEC
View all notes Alert
me of new notes
Company
Profile
|
CTRP
- NASDAQ
Ctrip.com Intl Ltd Adr
LEISURE - Resorts & Casinos
|
$40.31
|
+0.02
|
978,226
43% DAV
2,252,400
|
3/25/2010
(Date
Featured) |
$40.74
(Price
Featured) |
PP = $39.40 |
Y |
| MB = $41.37 |
Most Recent Note - 4/5/2010 5:41:31 PM
Y - Held its ground today with light volume. On 4/01/10 it gapped up and surged to a new high, briefly trading above its "max buy" level, but while its gain above its pivot point was backed by +72% above average volume, it encountered distributional pressure and quickly reversed a large part of its early gain to ultimately close in the lower part of its intra-day range. CTRP has been stalled at all-time highs since 3/25/10 when a detailed Stock Bulletin with annotated graph and expert analysis was published (read here).
>>> The latest Featured Stock Update with an annotated graph appeared on 3/25/2010. click here.
|
|
C
A
S
I |
News |
Chart |
SEC
View all notes Alert
me of new notes
Company
Profile
|
EZPW
- NASDAQ
Ezcorp Inc Cl A
SPECIALTY RETAIL - Specialty Retail, Other
|
$21.48
|
+0.53
|
489,218
90% DAV
545,800
|
2/19/2010
(Date
Featured) |
$19.03
(Price
Featured) |
PP = $18.80 |
G |
| MB = $19.74 |
Most Recent Note - 4/5/2010 5:43:37 PM
G - Solid gain today with near average volume. Its 50 DMA line and its recent chart low ($19.73 on 3/16/10) define near-term support. This high-ranked Finance - Consumer/Commercial Loans firm is within close striking distance of its all-time high and has no overhead supply to act as resistance.
>>> The latest Featured Stock Update with an annotated graph appeared on 3/29/2010. click here.
|
|
C
A
S
I |
News |
Chart |
SEC
View all notes Alert
me of new notes
Company
Profile
|
GMCR
- NASDAQ
Green Mtn Coffee Roastrs
FOOD & BEVERAGE - Processed & Packaged Goods
|
$96.94
|
+0.46
|
521,013
44% DAV
1,194,300
|
2/26/2010
(Date
Featured) |
$84.39
(Price
Featured) |
PP = $88.75 |
G |
| MB = $93.19 |
Most Recent Note - 4/5/2010 5:46:21 PM
G - Posted a gain on very light volume today, closing just 67 cents below its best ever close. Support to watch on pullbacks is at prior chart highs and its 50-day moving average (DMA) line now coinciding in the $88 area.
This high-ranked leader is extended from an ideal base and trading above the "max buy" level previously cited. Its gain on 3/08/10 with above average volume was noted as it triggered a most recent technical buy signal.
>>> The latest Featured Stock Update with an annotated graph appeared on 4/5/2010. click here.
|
|
C
A
S
I |
News |
Chart |
SEC
View all notes Alert
me of new notes
Company
Profile
|
ISRG
- NASDAQ
Intuitive Surgical Inc
HEALTH SERVICES - Medical Appliances & Equipment
|
$345.80
|
-3.80
|
483,695
95% DAV
511,300
|
1/22/2010
(Date
Featured) |
$340.40
(Price
Featured) |
PP = $314.00 |
G |
| MB = $329.70 |
Most Recent Note - 4/5/2010 5:48:02 PM
G - Gapped up today then negatively reversed and closed near prior chart highs ($346) and its 50 DMA line - important support levels to watch. As previously repeated in notes, it did not trigger a technical buy signal in recent weeks.
>>> The latest Featured Stock Update with an annotated graph appeared on 3/16/2010. click here.
|
|
C
A
S
I |
News |
Chart |
SEC
View all notes Alert
me of new notes
Company
Profile
|
PCLN
- NASDAQ
Priceline.com Inc
INTERNET - Internet Software & Services
|
$399.55
|
-4.72
|
584,812
N/A
|
11/1/2002
(Date
Featured) |
$399.55
(Price
Featured) |
PP = $428.20 |
Y |
| MB = $449.61 |
Most Recent Note - 1/2/2011
Y - Returns to Featured Stocks list with its appearance in the January 2011 CANSLIM.net News including detailed analysis and annotated daily and weekly graphs.
>>> The latest Featured Stock Update with an annotated graph appeared on 3/30/2010. click here.
|
|
C
A
S
I |
News |
Chart |
SEC
View all notes Alert
me of new notes
Company
Profile
|
PEGA
- NASDAQ
Pegasystems Inc
COMPUTER SOFTWARE & SERVICES - Business Software & Services
|
$37.76
|
+0.52
|
90,658
43% DAV
213,000
|
2/26/2010
(Date
Featured) |
$36.00
(Price
Featured) |
PP = $38.55 |
Y |
| MB = $40.48 |
Most Recent Note - 4/5/2010 5:52:19 PM
Y - Today's second consecutive gain with below average volume continues its quiet consolidation near support at prior chart highs and its 50 DMA line which coincide in the $37 area. It has failed to follow through with any confirming gains with above average volume since its considerable gap up gain on 3/15/10 triggered a technical buy signal.
>>> The latest Featured Stock Update with an annotated graph appeared on 3/15/2010. click here.
|
|
C
A
S
I |
News |
Chart |
SEC
View all notes Alert
me of new notes
Company
Profile
|
ROVI
- NASDAQ
Rovi Corp
COMPUTER SOFTWARE & SERVICES - Security Software & Services
|
$37.07
|
+0.33
|
971,275
70% DAV
1,379,700
|
2/25/2010
(Date
Featured) |
$33.54
(Price
Featured) |
PP = $34.87 |
G |
| MB = $36.61 |
Most Recent Note - 4/5/2010 5:55:55 PM
G - Posted a small gain today with light volume after a streak of 7 consecutive small losses on below average volume. Perched within close striking distance of its all-time high, hovering just above its "max buy" level. Prior chart highs and its 50 DMA line, coinciding in the $34 area, define an important support level to watch on pullbacks.
>>> The latest Featured Stock Update with an annotated graph appeared on 3/17/2010. click here.
|
|
C
A
S
I |
News |
Chart |
SEC
View all notes Alert
me of new notes
Company
Profile
|
SIRO
- NASDAQ
Sirona Dental Systems
HEALTH SERVICES - Medical Instruments & Supplies
|
$38.79
|
+0.33
|
366,440
61% DAV
605,300
|
2/16/2010
(Date
Featured) |
$36.43
(Price
Featured) |
PP = $36.15 |
G |
| MB = $37.96 |
Most Recent Note - 4/5/2010 5:58:18 PM
G - Gapped up today for a small gain on lighter volume and yet another new high close. Heavier volume and lack of meaningful upward price progress above prior highs has been noted recently as action indicative of distributional pressure. Prior chart highs and its 50 DMA line in the $35-36 area define important support to watch.
>>> The latest Featured Stock Update with an annotated graph appeared on 3/26/2010. click here.
|
|
C
A
S
I |
News |
Chart |
SEC
View all notes Alert
me of new notes
Company
Profile
|
ULTA
- NASDAQ
Ulta Salon Cosm & Frag
SPECIALTY RETAIL - Specialty Retail, Other
|
$22.63
|
+0.48
|
501,113
135% DAV
372,200
|
3/12/2010
(Date
Featured) |
$22.81
(Price
Featured) |
PP = $21.72 |
Y |
| MB = $22.81 |
Most Recent Note - 4/5/2010 6:00:51 PM
Y - Overcame early weakness today and posted a gain with above average volume, closing at the session high. Color code was changed to yellow while consolidating recently below its "max buy" level. A detailed Stock Bulletin with annotated graph was published soon after it was featured in the 3/12/10 mid-day report.
>>> The latest Featured Stock Update with an annotated graph appeared on 4/1/2010. click here.
|
|
C
A
S
I |
News |
Chart |
SEC
View all notes Alert
me of new notes
Company
Profile
|
VPRT
- NASDAQ
Vistaprint Nv
DIVERSIFIED SERVICES - Business/Management Services
|
$58.29
|
+1.15
|
326,960
73% DAV
448,900
|
3/1/2010
(Date
Featured) |
$57.72
(Price
Featured) |
PP = $59.70 |
G |
| MB = $62.69 |
Most Recent Note - 4/5/2010 6:02:22 PM
G - Overcame early weakness today and posted a gain on light volume, holding its ground near its 50 DMA line. Distributional action pressured it near that short-term average line last week, raising concerns. Color code was changed to green. It did not trigger a technical buy signal since it was featured in the March 2010 CANSLIM.net News monthly newsletter (read here). As previously noted, "Its gain on 3/02/10 was below the volume guidelines for buyable breakouts under the investment system."
>>> The latest Featured Stock Update with an annotated graph appeared on 3/19/2010. click here.
|
|
C
A
S
I |
News |
Chart |
SEC
View all notes Alert
me of new notes
Company
Profile
|
|
|
|
THESE ARE NOT BUY RECOMMENDATIONS!
Comments contained in the body of this report are technical
opinions only. The material herein has been obtained
from sources believed to be reliable and accurate, however,
its accuracy and completeness cannot be guaranteed.
This site is not an investment advisor, hence it does
not endorse or recommend any securities or other investments.
Any recommendation contained in this report may not
be suitable for all investors and it is not to be deemed
an offer or solicitation on our part with respect to
the purchase or sale of any securities. All trademarks,
service marks and trade names appearing in this report
are the property of their respective owners, and are
likewise used for identification purposes only.
This report is a service available
only to active Paid Premium Members.
You may opt-out of receiving report notifications
at any time. Questions or comments may be submitted
by writing to Premium Membership Services 665 S.E. 10 Street, Suite 201 Deerfield Beach, FL 33441-5634 or by calling 1-800-965-8307
or 954-785-1121.
|
|
|


