You are not logged in.
This means you
CAN ONLY VIEW reports that were published prior to Monday, March 10, 2025.
You
MUST UPGRADE YOUR MEMBERSHIP if you want to see any current reports.
AFTER MARKET UPDATE - THURSDAY, APRIL 4TH, 2013
Previous After Market Report Next After Market Report >>>
|
|
|
|
DOW |
+55.76 |
14,606.11 |
+0.38% |
|
Volume |
646,949,210 |
-20% |
|
Volume |
1,416,332,940 |
-20% |
|
NASDAQ |
+6.38 |
3,224.98 |
+0.20% |
|
Advancers |
1,836 |
59% |
|
Advancers |
1,552 |
61% |
|
S&P 500 |
+6.29 |
1,559.98 |
+0.40% |
|
Decliners |
1,106 |
36% |
|
Decliners |
862 |
34% |
|
Russell 2000 |
+6.95 |
925.66 |
+0.76% |
|
52 Wk Highs |
89 |
|
|
52 Wk Highs |
34 |
|
|
S&P 600 |
+4.26 |
518.71 |
+0.83% |
|
52 Wk Lows |
33 |
|
|
52 Wk Lows |
32 |
|
|
 |
Major Averages Post Gains With Lighter Volume
Kenneth J. Gruneisen - Passed the CAN SLIM® Master's Exam
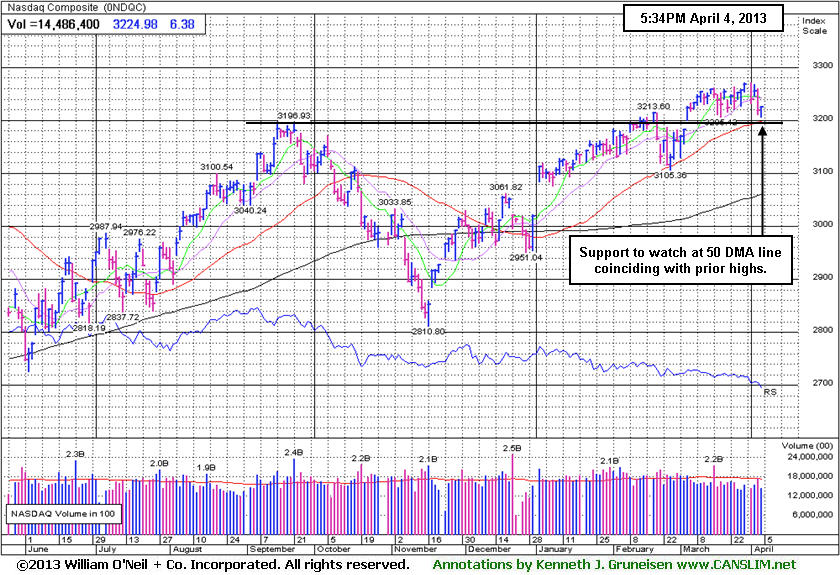
The major averages rose on Thursday, however behind their gains the volume totals on the exchanges were reported lighter than the prior session totals on the NYSE and on the Nasdaq exchange, revealing a lack of fresh institutional buying demand. Breadth was positive as advancers led decliners on the NYSE by about a 3 to 2 margin and on the Nasdaq by nearly 2 to 1. However, there were only 5 high-ranked companies from the CANSLIM.net Leaders List making new 52-week highs and appearing on the CANSLIM.net BreakOuts Page, down considerably from the prior session total of 27 stocks. There were gains from 12 of the 16 high-ranked companies currently included on the Featured Stocks Page.
The Bank of Japan announced aggressive, market-lifting policies to jump-start its economy. The surprisingly aggressive stimulus plan received supportive comments from European and Federal Reserve officials, suggesting central bank policies will keep underpinning the world's economy to the benefit of stocks. U.S. listed shares of Toyota Motor Corp (TM +4.71%) and other Japan-linked shares rose.
An unexpected jump in U.S. weekly jobless claims to a four-month high raised questions about the labor market's recovery ahead of the U.S. government's widely watched monthly jobs report. A report on Wednesday showed U.S. companies hired at the slowest pace in five months in March. Jobless claims jumped to 385,000 in the latest week, worse than expectations that claims would drop by 7,000 to 350,000. Dennis Lockhart, president of the Federal Reserve Bank of Atlanta, suggested the Fed's program to stimulate the economy would continue for at least a few more months. Charles Evans, head of the Chicago Fed and an influential dove at the central bank, said rates could stay at rock bottom until the unemployment rate falls to 5.5% from the current 7.7%.
Retailer Best Buy Co Inc (BBY +16.07%) was the S&P 500 Index's top percentage gainer after saying it would offer a 30% discount on its current stock of Apple (AAPL -0.99%) iPad 3 tablets in the United States. Shares of Facebook (FB +3.13%) rose in heavy volume after it unveiled a new family of phone applications that will let users display mobile versions of their newsfeed and messages on the home screen of a wide range of devices. Analysts said the move could divert users from services of Google (GOOG -1.38%).
New buying efforts may still be justified under the fact-based system in ideal buy candidates fitting all key criteria, however, recent distribution days and weak action among high-ranked stocks has resulted in a noted shift in the market's (M criteria) stance to a rally that is currently "under pressure". Any sustainable rally requires a healthy crop of companies hitting new 52-week highs, so it is always essential to see meaningful leadership (stocks hitting new 52-week highs).
Watch for an announcement via email concerning the next WEBCAST. The webcast will also be available via an updated link highlighted at the top of the Premium Member Homepage.
PICTURED: The Nasdaq Composite Index is consolidating above its 50-day moving average (DMA) line and coinciding with prior highs defining important near-term support to watch.
|
 Kenneth J. Gruneisen started out as a licensed stockbroker in August 1987, a couple of months prior to the historic stock market crash that took the Dow Jones Industrial Average down -22.6% in a single day. He has published daily fact-based fundamental and technical analysis on high-ranked stocks online for two decades. Through FACTBASEDINVESTING.COM, Kenneth provides educational articles, news, market commentary, and other information regarding proven investment systems that work in good times and bad.
Comments contained in the body of this report are technical opinions only and are not necessarily those of Gruneisen Growth Corp. The material herein has been obtained from sources believed to be reliable and accurate, however, its accuracy and completeness cannot be guaranteed. Our firm, employees, and customers may effect transactions, including transactions contrary to any recommendation herein, or have positions in the securities mentioned herein or options with respect thereto. Any recommendation contained in this report may not be suitable for all investors and it is not to be deemed an offer or solicitation on our part with respect to the purchase or sale of any securities. |
|
 |
Gold & Silver, Retail, Financial, and Tech Indexes Rose
Kenneth J. Gruneisen - Passed the CAN SLIM® Master's Exam
The Gold & Silver Index ($XAU +2.65%) recovered some of the prior session's big loss and was a standout gainer on Thursday. The Retail Index ($RLX +1.03%) rose and a positive bias in financial stocks gave the Broker/Dealer Index ($XBD +0.80%) and Bank Index ($BKX +0.88%) both a boost. Energy-related shares were little changed as the Integrated Oil Index ($XOI -0.07%) and the Oil Services Index ($OSX +0.03%) both finished flat. The Healthcare Index ($HMO +0.21%) edged higher and the Networking Index ($NWX +0.42%), Biotechnology Index ($BTK +0.70%), and the Semiconductor Index ($SOX +1.28%) led the tech sector higher while the Internet Index ($IIX -0.21%) lagged with a small loss.
Charts courtesy www.stockcharts.com
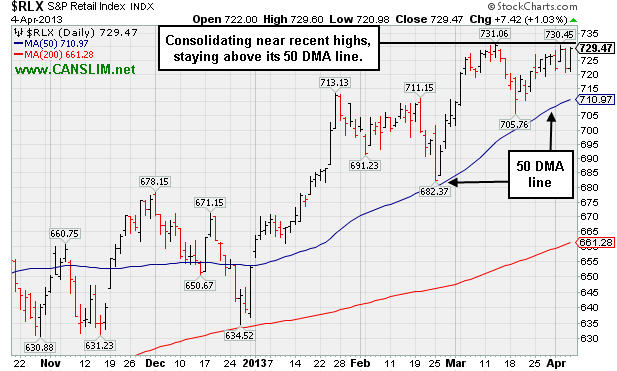
PICTURED: The Retail Index ($RLX +1.03%) is consolidating near recent highs, staying above its 50-day moving average (DMA) line which acted as support during a pullback earlier this year.
| Oil Services |
$OSX |
236.19 |
+0.07 |
+0.03% |
+7.28% |
| Healthcare |
$HMO |
2,898.33 |
+6.00 |
+0.21% |
+15.28% |
| Integrated Oil |
$XOI |
1,331.22 |
-0.87 |
-0.07% |
+7.20% |
| Semiconductor |
$SOX |
421.14 |
+5.33 |
+1.28% |
+9.65% |
| Networking |
$NWX |
228.15 |
+0.96 |
+0.42% |
+0.71% |
| Internet |
$IIX |
357.34 |
-0.74 |
-0.21% |
+9.28% |
| Broker/Dealer |
$XBD |
108.58 |
+0.86 |
+0.80% |
+15.11% |
| Retail |
$RLX |
729.47 |
+7.42 |
+1.03% |
+11.70% |
| Gold & Silver |
$XAU |
126.51 |
+3.27 |
+2.65% |
-23.61% |
| Bank |
$BKX |
55.16 |
+0.48 |
+0.88% |
+7.57% |
| Biotech |
$BTK |
1,816.58 |
+12.56 |
+0.70% |
+17.42% |
|
|
|
 |
Consolidating Above 50-Day Moving Average and Above Pivot Point
Kenneth J. Gruneisen - Passed the CAN SLIM® Master's Exam
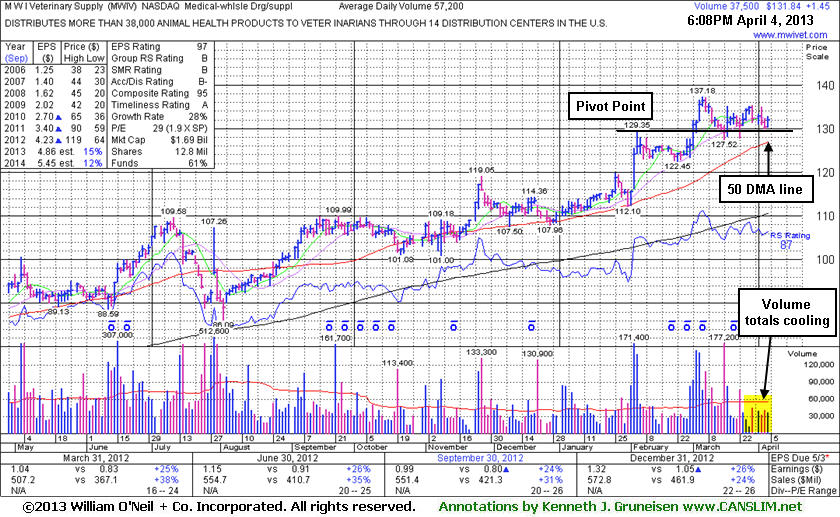
M W I Veterinary Supply (MWIV +$1.45 or +1.11% to $131.84) is still consolidating above its pivot point with volume totals cooling in recent weeks. The light volume totals are viewed as a reassuring indication that few investors are headed for the exit while it is perched near its 52-week high. Its 50-day moving average (DMA) line defines near-term support where any subsequent violation would raise concerns and trigger a technical sell signal. Disciplined investors limit losses by always selling if ever any stock fall more than -7% from their purchase price. MWIV marked its 52-week high on its last appearance in this FSU section with an annotated graph on 3/06/13 under the headline, "Getting Extended From "3-Weeks Tight" Base With Streak of Volume-Driven Gains". It had cleared the pivot point based on its 2/05/13 high plus 10 cents with a spurt of volume-driven gains. The price recently hitting new highs satisfied the N criteria.
The high-ranked Medical - Wholesale Drug/Supplies firm reported earnings +26% on +24% sales revenues for the quarter ended December 31, 2012 versus the year ago period, continuing its trend of recent quarterly earnings increases near the +25% minimum guideline (C criteria). Decelerating sales revenues increases in sequential quarterly comparisons through Dec '12 is a slight cause for concern while waiting and watching for the next quarterly report for the period ended March 31, 2013 versus the year ago period. Revenues rose by +38%, +35%, +31% and +24% in the Mar, Jun, Sep, and Dec '12 quarterly comparisons, respectively, versus the year ago periods. It is preferred when stocks show acceleration, rather than deceleration in their growth rates.
Its solid annual earnings history satisfies the A criteria. Its small supply (S criteria) of only 12.8 million shares outstanding could contribute to greater volatility in the event of institutional buying or selling. The number of top-rated funds owning its shares rose from 266 in Mar '12 to 301 in Mar '13, a very reassuring sign of interest coming from the institutional (I criteria) crowd.
|
|
|
Color Codes Explained :
Y - Better candidates highlighted by our
staff of experts.
G - Previously featured
in past reports as yellow but may no longer be buyable under the
guidelines.
***Last / Change / Volume data in this table is the closing quote data***
Symbol/Exchange
Company Name
Industry Group |
PRICE |
CHANGE
(%Change) |
Day High |
Volume
(% DAV)
(% 50 day avg vol) |
52 Wk Hi
% From Hi |
Featured
Date |
Price
Featured |
Pivot Featured |
|
Max Buy |
AMBA
-
NASDAQ
Ambarella Inc
ELECTRONICS - Semiconductor - Specialized
|
$14.55
|
+0.85
6.20% |
$14.92
|
607,585
202.53% of 50 DAV
50 DAV is 300,000
|
$16.00
-9.06%
|
3/26/2013
|
$15.31
|
PP = $14.83
|
|
MB = $15.57
|
 Most Recent Note - 4/4/2013 12:27:38 PM
Y - Rebounding today with above average volume behind its gain following an abrupt retreat from its 52-week high after a "negative reversal" on 4/01/13. Disciplined investors avoid chasing extended stocks and always limit losses by selling if any stock falls more than -7% from their purchase price.
>>> The latest Featured Stock Update with an annotated graph appeared on 3/26/2013. Click here.
View all notes |
Alert me of new notes |
CANSLIM.net Company Profile |
SEC |
Zacks Reports |
StockTalk |
News |
Chart |
Request a new note
C
A N
S L
I M


|
CELG
-
NASDAQ
Celgene Corp
DRUGS - Drug Manufacturers - Major
|
$115.95
|
+0.40
0.35% |
$116.97
|
1,876,135
56.69% of 50 DAV
50 DAV is 3,309,300
|
$118.78
-2.38%
|
3/27/2013
|
$113.24
|
PP = $115.54
|
|
MB = $121.32
|
Most Recent Note - 3/28/2013 6:05:26 PM
Y - It wedged to new highs from an advanced "3-weeks tight" base with only average volume behind its gain today above the new pivot point cited based on its 3/14/13 high plus 10 cents. See the latest FSU analysis for more details and a new annotated weekly graph.
>>> The latest Featured Stock Update with an annotated graph appeared on 3/28/2013. Click here.
View all notes |
Alert me of new notes |
CANSLIM.net Company Profile |
SEC |
Zacks Reports |
StockTalk |
News |
Chart |
Request a new note
C
A N
S L
I M
|
CFNL
-
NASDAQ
Cardinal Financial Corp
BANKING - Regional - Southeast Banks
|
$17.44
|
+0.09
0.52% |
$17.46
|
143,472
69.55% of 50 DAV
50 DAV is 206,300
|
$18.40
-5.22%
|
3/22/2013
|
$17.99
|
PP = $18.29
|
|
MB = $19.20
|
Most Recent Note - 3/28/2013 2:36:56 PM
Y - Inched higher with small gains lacking great volume conviction since forming the previously noted advanced "3-weeks tight" base. Gains above the pivot point must have at least the bare minimum +40% above average volume, preferably more, to trigger a proper new (or add-on) technical buy signal.
>>> The latest Featured Stock Update with an annotated graph appeared on 3/18/2013. Click here.
View all notes |
Alert me of new notes |
CANSLIM.net Company Profile |
SEC |
Zacks Reports |
StockTalk |
News |
Chart |
Request a new note
C
A N
S L
I M
|
CMCSA
-
NASDAQ
Comcast Corp Cl A
MEDIA - CATV Systems
|
$42.12
|
+0.30
0.72% |
$42.30
|
7,765,890
54.00% of 50 DAV
50 DAV is 14,380,000
|
$42.61
-1.15%
|
12/3/2012
|
$37.08
|
PP = $38.06
|
|
MB = $39.96
|
Most Recent Note - 4/2/2013 4:36:31 PM
G - Finished near the session high with a gain on average volume for a new 52-week high. Found recent support and rallied from its 50 DMA line. Relative Strength Rating is at 79, just below the 80+ guideline for buy candidates. Fundamental concerns also remain since it reported earnings +11% on +6% sales revenues for the Dec '12 quarter, below the +25% minimum guideline (C criteria).
>>> The latest Featured Stock Update with an annotated graph appeared on 3/19/2013. Click here.
View all notes |
Alert me of new notes |
CANSLIM.net Company Profile |
SEC |
Zacks Reports |
StockTalk |
News |
Chart |
Request a new note
C
A N
S L
I M
|
CVLT
-
NASDAQ
Commvault Systems Inc
COMPUTER SOFTWARE and SERVICES - Business Software and Services
|
$75.33
|
-1.08
-1.41% |
$76.32
|
987,352
131.68% of 50 DAV
50 DAV is 749,800
|
$86.89
-13.30%
|
3/14/2013
|
$84.71
|
PP = $79.63
|
|
MB = $83.61
|
Most Recent Note - 4/3/2013 1:40:02 PM
G - Slumping below its 50 DMA line and below prior highs with today's big loss on light volume. The technical deterioration raises concerns and its color code is changed to green. Only a prompt rebound above its short-term average would help its outlook.
>>> The latest Featured Stock Update with an annotated graph appeared on 3/14/2013. Click here.
View all notes |
Alert me of new notes |
CANSLIM.net Company Profile |
SEC |
Zacks Reports |
StockTalk |
News |
Chart |
Request a new note
C
A N
S L
I M
|
Symbol/Exchange
Company Name
Industry Group |
PRICE |
CHANGE
(%Change) |
Day High |
Volume
(% DAV)
(% 50 day avg vol) |
52 Wk Hi
% From Hi |
Featured
Date |
Price
Featured |
Pivot Featured |
|
Max Buy |
EVER
-
NYSE
Everbank Financial Corp
BANKING
|
$14.98
|
-0.09
-0.60% |
$15.12
|
1,721,857
190.49% of 50 DAV
50 DAV is 903,900
|
$17.29
-13.36%
|
3/4/2013
|
$15.38
|
PP = $15.83
|
|
MB = $16.62
|
Most Recent Note - 4/2/2013 4:40:04 PM
G - Slumped to a close just below its 50 DMA line ($15.16 now) today. That important short-term average has acted as support since damaging losses violated prior highs in the $16 area raising concerns while completely negating its prior technical breakout.
>>> The latest Featured Stock Update with an annotated graph appeared on 4/2/2013. Click here.
View all notes |
Alert me of new notes |
CANSLIM.net Company Profile |
SEC |
Zacks Reports |
StockTalk |
News |
Chart |
Request a new note
C
A N
S L
I M
|
FLT
-
NYSE
Fleetcor Technologies
DIVERSIFIED SERVICES - Business/Management Services
|
$77.26
|
-0.01
-0.01% |
$77.72
|
1,192,960
152.30% of 50 DAV
50 DAV is 783,300
|
$78.37
-1.42%
|
3/21/2013
|
$71.14
|
PP = $73.00
|
|
MB = $76.65
|
Most Recent Note - 4/1/2013 6:04:06 PM
G - Color code is changed to green after a gain today with above average volume for another new 52-week high, getting extended above its "max buy" level. Prior high in the $72 area defines near-term support to watch on pullbacks.
>>> The latest Featured Stock Update with an annotated graph appeared on 3/21/2013. Click here.
View all notes |
Alert me of new notes |
CANSLIM.net Company Profile |
SEC |
Zacks Reports |
StockTalk |
News |
Chart |
Request a new note
C
A N
S L
I M
|
LNKD
-
NYSE
Linkedin Corp Class A
INTERNET - Internet Information Providers
|
$172.71
|
+5.40
3.23% |
$172.83
|
2,066,275
83.20% of 50 DAV
50 DAV is 2,483,400
|
$184.15
-6.21%
|
2/8/2013
|
$147.04
|
PP = $127.55
|
|
MB = $133.93
|
Most Recent Note - 4/3/2013 1:47:41 PM
G - Retreating with slightly higher volume behind today's loss indicating distributional pressure. Its 50 DMA line ($157.43 now) defines important near term support to watch. Patient investors may watch for a secondary buy point or new base to form and be noted.
>>> The latest Featured Stock Update with an annotated graph appeared on 3/11/2013. Click here.
View all notes |
Alert me of new notes |
CANSLIM.net Company Profile |
SEC |
Zacks Reports |
StockTalk |
News |
Chart |
Request a new note
C
A N
S L
I M
|
MIDD
-
NASDAQ
Middleby Corp
MANUFACTURING - Diversified Machinery
|
$148.45
|
+0.30
0.20% |
$148.71
|
50,290
50.95% of 50 DAV
50 DAV is 98,700
|
$154.74
-4.06%
|
10/8/2012
|
$118.46
|
PP = $122.67
|
|
MB = $128.80
|
Most Recent Note - 4/1/2013 6:13:43 PM
G - Recently staying in tight trading range near all-time highs, stubbornly holding its ground above its 50 DMA line. Fundamental concerns were recently noted.
>>> The latest Featured Stock Update with an annotated graph appeared on 3/25/2013. Click here.
View all notes |
Alert me of new notes |
CANSLIM.net Company Profile |
SEC |
Zacks Reports |
StockTalk |
News |
Chart |
Request a new note
C
A N
S L
I M
|
MNTX
-
NASDAQ
Manitex International
MANUFACTURING - Diversified Machinery
|
$10.91
|
+0.22
2.06% |
$10.94
|
237,777
119.37% of 50 DAV
50 DAV is 199,200
|
$13.14
-16.97%
|
3/20/2013
|
$11.29
|
PP = $12.05
|
|
MB = $12.65
|
Most Recent Note - 4/3/2013 11:10:42 AM
Y - Testing near its 50 DMA line today with another damaging loss on heavy volume following a weak finish on the prior session noted as - "Indicating more worrisome distributional pressure." Only a prompt show of support near its 50 DMA line would be encouraging. Disciplined investors avoid chasing extended stocks and always limit losses by selling if any stock falls more than -7% from their purchase price.
>>> The latest Featured Stock Update with an annotated graph appeared on 3/20/2013. Click here.
View all notes |
Alert me of new notes |
CANSLIM.net Company Profile |
SEC |
Zacks Reports |
StockTalk |
News |
Chart |
Request a new note
C
A N
S L
I M
|
Symbol/Exchange
Company Name
Industry Group |
PRICE |
CHANGE
(%Change) |
Day High |
Volume
(% DAV)
(% 50 day avg vol) |
52 Wk Hi
% From Hi |
Featured
Date |
Price
Featured |
Pivot Featured |
|
Max Buy |
MRLN
-
NASDAQ
Marlin Business Services
DIVERSIFIED SERVICES - Rental and Leasing Services
|
$22.86
|
-0.05
-0.22% |
$23.44
|
17,789
72.31% of 50 DAV
50 DAV is 24,600
|
$23.98
-4.67%
|
3/15/2013
|
$22.29
|
PP = $23.18
|
|
MB = $24.34
|
Most Recent Note - 4/4/2013 12:54:49 PM
Y - Volume was above average on the prior session as it tallied a small gain against a mostly negative market backdrop. Stubbornly holding its ground within close striking distance of its 52-week high. Previously noted - "Subsequent volume-driven gains above the pivot point could help clinch a more convincing technical buy signal."
>>> The latest Featured Stock Update with an annotated graph appeared on 3/15/2013. Click here.
View all notes |
Alert me of new notes |
CANSLIM.net Company Profile |
SEC |
Zacks Reports |
StockTalk |
News |
Chart |
Request a new note
C
A N
S L
I M
|
MWIV
-
NASDAQ
M W I Veterinary Supply
HEALTH SERVICES - Medical Instruments and; Supplies
|
$131.84
|
+1.45
1.11% |
$132.75
|
38,525
67.35% of 50 DAV
50 DAV is 57,200
|
$137.18
-3.89%
|
3/4/2013
|
$130.90
|
PP = $129.45
|
|
MB = $135.92
|
Most Recent Note - 4/4/2013 6:34:36 PM
Y - Consolidating above its 50 DMA line and above its pivot point with volume totals cooling in recent weeks. See the latest FSU analysis for more details an a new annotated graph.
>>> The latest Featured Stock Update with an annotated graph appeared on 4/4/2013. Click here.
View all notes |
Alert me of new notes |
CANSLIM.net Company Profile |
SEC |
Zacks Reports |
StockTalk |
News |
Chart |
Request a new note
C
A N
S L
I M
|
N
-
NYSE
Netsuite Inc
DIVERSIFIED SERVICES - Business/Management Services
|
$78.00
|
+0.37
0.48% |
$78.25
|
334,290
87.95% of 50 DAV
50 DAV is 380,100
|
$80.33
-2.90%
|
12/12/2012
|
$64.75
|
PP = $67.12
|
|
MB = $70.48
|
Most Recent Note - 4/1/2013 7:26:50 PM
G - Perched at 52-week and all-time highs after 7 consecutive weekly gains, extended from its prior base. See the latest FSU analysis for more details and a new annotated graph.
>>> The latest Featured Stock Update with an annotated graph appeared on 4/1/2013. Click here.
View all notes |
Alert me of new notes |
CANSLIM.net Company Profile |
SEC |
Zacks Reports |
StockTalk |
News |
Chart |
Request a new note
C
A N
S L
I M
|
NSR
-
NYSE
Neustar Inc
TELECOMMUNICATIONS - Diversified Communication Serv
|
$43.21
|
-0.26
-0.60% |
$43.40
|
843,297
183.72% of 50 DAV
50 DAV is 459,000
|
$47.24
-8.53%
|
3/8/2013
|
$44.99
|
PP = $47.34
|
|
MB = $49.71
|
Most Recent Note - 4/4/2013 12:57:48 PM
G - Color code is changed to green while slumping below its 50 DMA line and undercutting its prior lows, weakness raising concerns and triggering technical sell signals. Its Relative Strength rating has slumped to 63, well below the 80+ minimum guideline for buy candidates.
>>> The latest Featured Stock Update with an annotated graph appeared on 3/27/2013. Click here.
View all notes |
Alert me of new notes |
CANSLIM.net Company Profile |
SEC |
Zacks Reports |
StockTalk |
News |
Chart |
Request a new note
C
A N
S L
I M
|
RRTS
-
NYSE
Roadrunner Trans Systems
TRANSPORTATION - Air Delivery and Freight Service
|
$22.99
|
+0.19
0.83% |
$23.02
|
208,282
123.46% of 50 DAV
50 DAV is 168,700
|
$23.71
-3.04%
|
4/3/2013
|
$22.77
|
PP = $23.75
|
|
MB = $24.94
|
Most Recent Note - 4/3/2013 7:39:18 PM
Y - Encountered distributional pressure after highlighted in yellow with new pivot point cited based on its 3/08/13 high plus 10 cents while consolidating in a flat base pattern in the earlier mid-day report. Fundamentals remain strong enough to still satisfy the C and A criteria, however decelerating sales revenues and earnings increases in sequential quarterly comparisons through the Dec '12 quarter is a concern. Completed a new Public Offering on 12/06/12 and, technically, it broke out above previously stubborn resistance in $19 area with volume-driven gains in January. See the latest FSU analysis for more details and a new annotated graph.
>>> The latest Featured Stock Update with an annotated graph appeared on 4/3/2013. Click here.
View all notes |
Alert me of new notes |
CANSLIM.net Company Profile |
SEC |
Zacks Reports |
StockTalk |
News |
Chart |
Request a new note
C
A N
S L
I M
|
Symbol/Exchange
Company Name
Industry Group |
PRICE |
CHANGE
(%Change) |
Day High |
Volume
(% DAV)
(% 50 day avg vol) |
52 Wk Hi
% From Hi |
Featured
Date |
Price
Featured |
Pivot Featured |
|
Max Buy |
VRX
-
NYSE
Valeant Pharmaceuticals
DRUGS - Drug Manufacturers - Other
|
$72.61
|
+0.74
1.03% |
$72.82
|
4,010,677
295.45% of 50 DAV
50 DAV is 1,357,500
|
$76.56
-5.16%
|
12/20/2012
|
$60.24
|
PP = $61.21
|
|
MB = $64.27
|
Most Recent Note - 4/4/2013 1:16:01 PM
G - Gapped down today and traded near its 50 DMA line, then managed a positive reversal. That important short-term average defines near-term support to watch where a violation may raise concerns and trigger a technical sell signal. On the prior session it pulled back on heavy volume after agreeing to an increased offer price of $24.00 cash for it to acquire Obagi Medical Products.
>>> The latest Featured Stock Update with an annotated graph appeared on 3/12/2013. Click here.
View all notes |
Alert me of new notes |
CANSLIM.net Company Profile |
SEC |
Zacks Reports |
StockTalk |
News |
Chart |
Request a new note
C
A N
S L
I M
|
|
|
|
THESE ARE NOT BUY RECOMMENDATIONS!
Comments contained in the body of this report are technical
opinions only. The material herein has been obtained
from sources believed to be reliable and accurate, however,
its accuracy and completeness cannot be guaranteed.
This site is not an investment advisor, hence it does
not endorse or recommend any securities or other investments.
Any recommendation contained in this report may not
be suitable for all investors and it is not to be deemed
an offer or solicitation on our part with respect to
the purchase or sale of any securities. All trademarks,
service marks and trade names appearing in this report
are the property of their respective owners, and are
likewise used for identification purposes only.
This report is a service available
only to active Paid Premium Members.
You may opt-out of receiving report notifications
at any time. Questions or comments may be submitted
by writing to Premium Membership Services 665 S.E. 10 Street, Suite 201 Deerfield Beach, FL 33441-5634 or by calling 1-800-965-8307
or 954-785-1121.
|
|
|

