You are not logged in.
This means you
CAN ONLY VIEW reports that were published prior to Monday, April 14, 2025.
You
MUST UPGRADE YOUR MEMBERSHIP if you want to see any current reports.
AFTER MARKET UPDATE - THURSDAY, APRIL 3RD, 2014
Previous After Market Report Next After Market Report >>>
|
|
|
|
DOW |
-0.45 |
16,572.55 |
-0.00% |
|
Volume |
647,330,790 |
+1% |
|
Volume |
1,915,169,410 |
-6% |
|
NASDAQ |
-38.72 |
4,237.74 |
-0.91% |
|
Advancers |
1,238 |
39% |
|
Advancers |
819 |
28% |
|
S&P 500 |
-2.13 |
1,888.77 |
-0.11% |
|
Decliners |
1,777 |
56% |
|
Decliners |
1,992 |
69% |
|
Russell 2000 |
-11.69 |
1,181.12 |
-0.98% |
|
52 Wk Highs |
158 |
|
|
52 Wk Highs |
102 |
|
|
S&P 600 |
-4.43 |
677.90 |
-0.65% |
|
52 Wk Lows |
7 |
|
|
52 Wk Lows |
19 |
|
|
 |
Major Averages Ended Slightly Lower
Kenneth J. Gruneisen - Passed the CAN SLIM® Master's Exam
The major averages ended with small losses on Thursday. The volume totals were reported mixed, slightly higher on the NYSE and slightly lighter on the Nasdaq exchange. Decliners led advancers by a 3-2 margin on the NYSE and 5-2 on the Nasdaq exchange. There were 40 high-ranked companies from the CANSLIM.net Leaders List that made new 52-week highs and appeared on the CANSLIM.net BreakOuts Page, down from the total of 54 stocks on the prior session. The list of stocks hitting new 52-week highs contracted but still easily outnumbered new 52-week lows on the NYSE and on the Nasdaq exchange. There was only 1 gainer out of the 9 high-ranked companies currently included on the Featured Stocks Page. The Market (M criteria) is in a confirmed uptrend, yet investors are reminded to only make new buying efforts in issues meeting all key criteria while also trading within the proper technical guidelines.
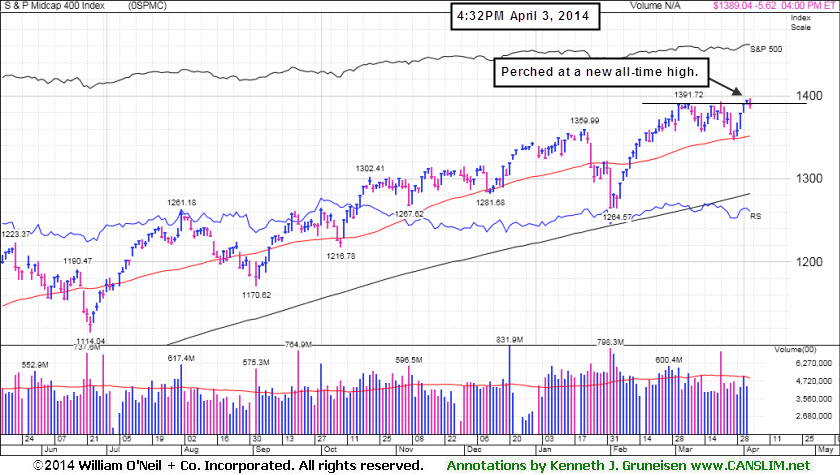
The Dow was down less than a point at 16,572. The S&P 500 fell 2 points from its record level to finish at 1,888. The NASDAQ declined 39 points to 4,237.
The major averages snapped their four-day winning streak ahead of Friday's jobs report. Non-farm payrolls are expected to increase 200,000 in March. The unemployment rate is projected to decline to 6.6% from 6.7%. The latest economic releases revealed weekly jobless claims increased to 326,000 and activity in the service sector expanded at a slightly slower-than-expected pace last month.
Facebook (FB -5.2%) tumbled and technology was the worst performing sector in the S&P 500. Modest losses for Microsoft (MSFT -0.8%) and Apple (AAPL -0.7%) contributed to the group's decline. Barnes & Noble (BKS -13.5%) was the biggest loser in the S&P 500 after Liberty Media sold a large part of its stake in the retailer. Energy was the best performing sector on the session. Anadarko Petroleum (APC +14.5%) surged after reaching a settlement with the government in case against its Kerr-McGee unit.
Treasuries were higher ahead of the pending labor report. Benchmark 10-year notes were up 4/32 to yield 2.79%.
The CANSLIM.net Featured Stocks Page shows the most action-worthy candidates and their latest notes and a Headline Link directs members to the latest detailed analysis with data-packed graphs annotated by a Certified expert along with links to additional resources. The Premium Member Homepage includes "dynamic archives" to all prior pay reports published. Watch for an announcement via email concerning the next WEBCAST.
PICTURED: The S&P 400 Mid-Cap Index is perched near its all-time high.
|
 Kenneth J. Gruneisen started out as a licensed stockbroker in August 1987, a couple of months prior to the historic stock market crash that took the Dow Jones Industrial Average down -22.6% in a single day. He has published daily fact-based fundamental and technical analysis on high-ranked stocks online for two decades. Through FACTBASEDINVESTING.COM, Kenneth provides educational articles, news, market commentary, and other information regarding proven investment systems that work in good times and bad.
Comments contained in the body of this report are technical opinions only and are not necessarily those of Gruneisen Growth Corp. The material herein has been obtained from sources believed to be reliable and accurate, however, its accuracy and completeness cannot be guaranteed. Our firm, employees, and customers may effect transactions, including transactions contrary to any recommendation herein, or have positions in the securities mentioned herein or options with respect thereto. Any recommendation contained in this report may not be suitable for all investors and it is not to be deemed an offer or solicitation on our part with respect to the purchase or sale of any securities. |
|
 |
Retail, Broker/Dealer, and Biotech Groups Led Decliners
Kenneth J. Gruneisen - Passed the CAN SLIM® Master's Exam
Weakness in the Retail Index ($RLX -0.95%) and the Broker/Dealer Index ($XBD -2.18%) had a negative influence on the major averages while the Bank Index ($BKX +0.03%) finished flat. The Biotechnology Index ($BTK -2.87%) led the tech sector's declines while the Networking Index ($NWX -0.41%) ended slightly lower and the Semiconductor Index ($SOX +0.17%) eked out a tiny gain. The Integrated Oil Index ($XOI +1.59%) posted a gain while the Oil Services Index ($OSX -0.22%) and the Gold & Silver Index ($XAU -0.90%) lost ground.
Charts courtesy www.stockcharts.com
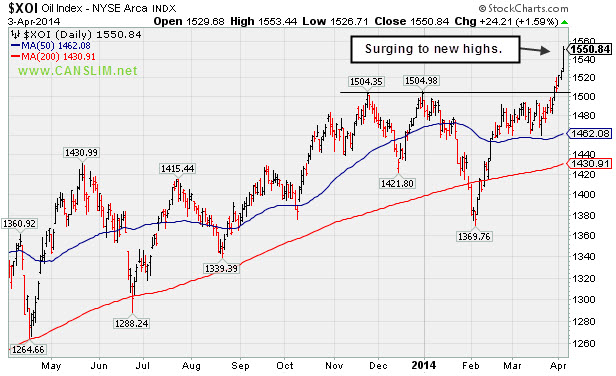
PICTURED: The Integrated Oil Index ($XOI +1.59%) has recently been surging to new highs.
| Oil Services |
$OSX |
291.15 |
-0.64 |
-0.22% |
+3.60% |
| Integrated Oil |
$XOI |
1,550.84 |
+24.21 |
+1.59% |
+3.17% |
| Semiconductor |
$SOX |
595.93 |
+0.99 |
+0.17% |
+11.38% |
| Networking |
$NWX |
346.58 |
-1.43 |
-0.41% |
+6.99% |
| Broker/Dealer |
$XBD |
160.23 |
-3.57 |
-2.18% |
-0.20% |
| Retail |
$RLX |
900.90 |
-8.65 |
-0.95% |
-4.14% |
| Gold & Silver |
$XAU |
92.69 |
-0.84 |
-0.90% |
+10.15% |
| Bank |
$BKX |
72.69 |
+0.02 |
+0.03% |
+4.95% |
| Biotech |
$BTK |
2,582.89 |
-76.32 |
-2.87% |
+10.83% |
|
|
|
 |
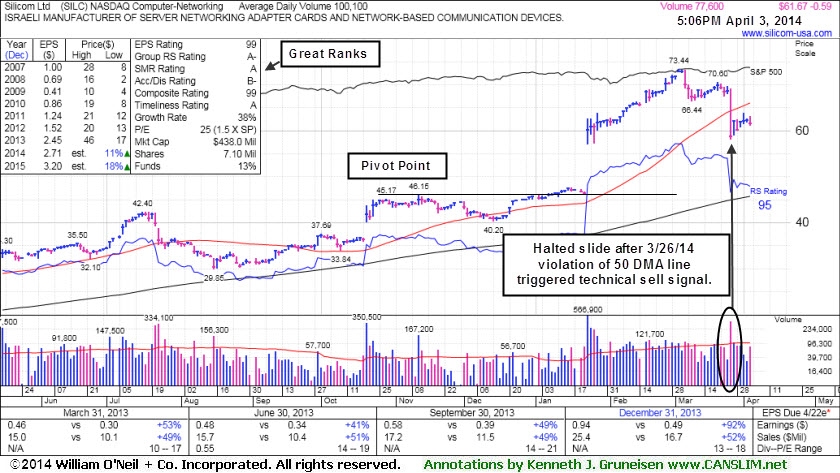
Halted Slide Following 50-Day Moving Average Violation
Kenneth J. Gruneisen - Passed the CAN SLIM® Master's Exam
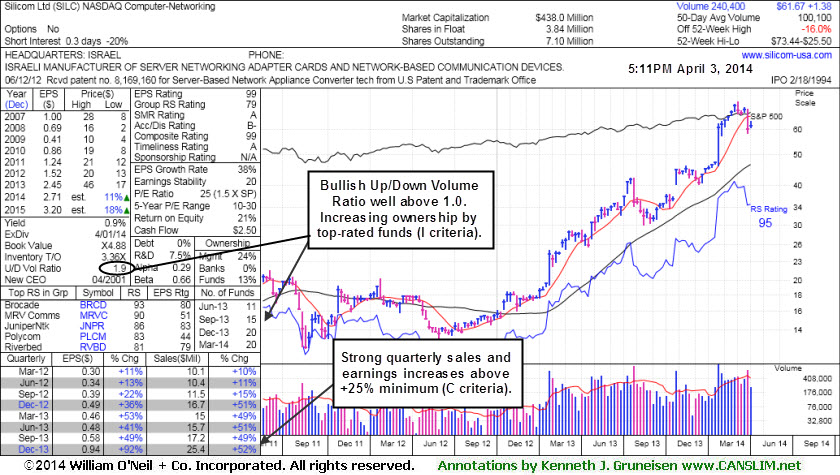
Silicom Ltd (SILC -$0.59 or -0.95% to $61.67) halted its slide after a damaging volume-driven loss last week violated its 50-day moving average (DMA) line triggering a technical sell signal. Only a prompt rebound above that important short-term average would help its outlook improve. More damaging losses leading to deterioration below the recent low ($58.12 on 3/26/14) would raise greater concerns and trigger additional technical sell signals. It is extended from any sound base. Patient investors may watch for a new base or secondary buy point to possibly develop and be noted in the weeks ahead.
It was last shown in this FSU section on 3/20/14 with annotated graphs under the headline, "Traded Up +64.6% in Under 3 Months Since Featured in Mid-Day Report", two and a half months after first featured in yellow at $44.62 in the 12/23/13 mid-day report (read here). There was a considerable "breakaway gap" up on 1/23/14 after reporting earnings +92% on +52% sales for the Dec '13 quarter, beating consensus estimates and continuing its streak of strong quarterly earnings increases satisfying the C criteria. After a downturn in FY '08 and '09 earnings its annual earnings (A criteria) history has shown strong and steady growth. Its small supply (S criteria) of only 3.84 million shares in the public float can contribute to greater price volatility in the event of institutional buying or selling. The number of top-rated funds owning its shares rose from 7 in Dec '12 to 20 in Dec '13, a reassuring sign concerning the I criteria. Its current Up/Down Volume Ratio of 1.9 is also an unbiased indication its shares have been under accumulation over the past 50 days.
|
|
|
Color Codes Explained :
Y - Better candidates highlighted by our
staff of experts.
G - Previously featured
in past reports as yellow but may no longer be buyable under the
guidelines.
***Last / Change / Volume data in this table is the closing quote data***
Symbol/Exchange
Company Name
Industry Group |
PRICE |
CHANGE
(%Change) |
Day High |
Volume
(% DAV)
(% 50 day avg vol) |
52 Wk Hi
% From Hi |
Featured
Date |
Price
Featured |
Pivot Featured |
|
Max Buy |
EQM
-
NYSE
E Q T Midstream Partners
ENERGY - Oil and Gas Pipelines
|
$72.65
|
+1.17
1.64% |
$73.35
|
89,010
77.40% of 50 DAV
50 DAV is 115,000
|
$73.43
-1.06%
|
12/12/2013
|
$53.17
|
PP = $56.51
|
|
MB = $59.34
|
Most Recent Note - 4/2/2014 12:48:26 PM
G - Hitting yet another new high with today's 4th consecutive gain. Held its ground since reporting earnings -2% on +22% sales revenues for the Dec '13 quarter, below the +25% minimum earnings guideline (C criteria), raising fundamental concerns. Its 50 DMA line defines near-term support where a violation may trigger a technical sell signal.
>>> FEATURED STOCK ARTICLE : Hit New Highs But Fundamental Concerns Remain - 3/21/2014
View all notes |
Set NEW NOTE alert |
CANSLIM.net Company Profile |
SEC
News |
Chart |
Request a new note
C
A N
S L
I M


|
FB
-
NASDAQ
Facebook Inc Cl A
INTERNET
|
$59.49
|
-3.23
-5.15% |
$63.17
|
83,551,465
133.81% of 50 DAV
50 DAV is 62,442,000
|
$72.59
-18.05%
|
12/12/2013
|
$51.40
|
PP = $54.93
|
|
MB = $57.68
|
 Most Recent Note - 4/3/2014 2:41:48 PM
G - Slumping today toward the recent low ($57.98 on 3/27/14) coinciding with prior highs in the $58 area defining important near-term support. A rebound above its 50 DMA line is needed, meanwhile, the longer it lingers below that important short-term average the worse its outlook gets.
>>> FEATURED STOCK ARTICLE : 50-Day Moving Average Violation Triggered Technical Sell Signal - 3/28/2014
View all notes |
Set NEW NOTE alert |
CANSLIM.net Company Profile |
SEC
News |
Chart |
Request a new note
C
A N
S L
I M
|
FLT
-
NYSE
Fleetcor Technologies
DIVERSIFIED SERVICES - Business/Management Services
|
$114.83
|
-2.36
-2.01% |
$117.82
|
634,440
57.47% of 50 DAV
50 DAV is 1,103,900
|
$132.22
-13.15%
|
3/5/2014
|
$125.40
|
PP = $124.06
|
|
MB = $130.26
|
Most Recent Note - 4/2/2014 1:24:23 PM
G - Consolidating near its 50 DMA line today after recently slumping back into its prior base. Relative Strength rating has slumped to 77, below the 80+ minimum guideline for buy candidates.
>>> FEATURED STOCK ARTICLE : Negated Recent Breakout and Testing Support at 50-Day Average - 3/24/2014
View all notes |
Set NEW NOTE alert |
CANSLIM.net Company Profile |
SEC
News |
Chart |
Request a new note
C
A N
S L
I M
|
GNRC
-
NYSE
Generac Hldgs Inc
Electrical-Power/Equipmt
|
$59.45
|
-0.91
-1.51% |
$60.99
|
477,873
54.61% of 50 DAV
50 DAV is 875,000
|
$62.50
-4.88%
|
2/14/2014
|
$56.50
|
PP = $57.39
|
|
MB = $60.26
|
Most Recent Note - 4/2/2014 5:38:46 PM
Y - Posted a 4th consecutive gain today with below average but increasing volume after finding support above prior highs in the $57 area again. More damaging losses below its recent low ($56.38 on 3/27/14) would raise greater concerns.
>>> FEATURED STOCK ARTICLE : Perched Near Highs With Mostly Quiet Volume Totals - 3/31/2014
View all notes |
Set NEW NOTE alert |
CANSLIM.net Company Profile |
SEC
News |
Chart |
Request a new note
C
A N
S L
I M
|
ICON
-
NASDAQ
Iconix Brand Group Inc
CONSUMER NON-DURABLES - Textile - Apparel Footwear
|
$39.96
|
-0.27
-0.67% |
$40.46
|
429,828
68.77% of 50 DAV
50 DAV is 625,000
|
$42.47
-5.90%
|
3/7/2014
|
$41.46
|
PP = $40.88
|
|
MB = $42.92
|
Most Recent Note - 4/2/2014 5:37:33 PM
Y - Rallied on higher volume today, climbing back above prior highs in the $40 area after finding prompt support at its 50 DMA line. Further deterioration would raise greater concerns and trigger technical sell signals.
>>> FEATURED STOCK ARTICLE : Falling Back Under Prior Highs Raises Concerns - 3/25/2014
View all notes |
Set NEW NOTE alert |
CANSLIM.net Company Profile |
SEC
News |
Chart |
Request a new note
C
A N
S L
I M
|
Symbol/Exchange
Company Name
Industry Group |
PRICE |
CHANGE
(%Change) |
Day High |
Volume
(% DAV)
(% 50 day avg vol) |
52 Wk Hi
% From Hi |
Featured
Date |
Price
Featured |
Pivot Featured |
|
Max Buy |
KORS
-
NYSE
Michael Kors Hldgs Ltd
RETAIL - Apparel Stores
|
$92.64
|
-2.39
-2.51% |
$95.59
|
2,008,967
63.57% of 50 DAV
50 DAV is 3,160,000
|
$101.04
-8.31%
|
3/12/2014
|
$98.03
|
PP = $101.14
|
|
MB = $106.20
|
Most Recent Note - 4/3/2014 5:28:54 PM
G - Color code is changed to green after quietly edging below its 50 DMA line. More damaging losses below the recent low ($89.43 on 3/27/14) would raise greater concerns and trigger a more worrisome technical sell signal.
>>> FEATURED STOCK ARTICLE : Fell Below 50-Day Average Line With 6th Consecutive Loss - 3/27/2014
View all notes |
Set NEW NOTE alert |
CANSLIM.net Company Profile |
SEC
News |
Chart |
Request a new note
C
A N
S L
I M
|
PSIX
-
NASDAQ
Power Solutions Intl Inc
Machinery-Gen Industrial
|
$77.53
|
-1.14
-1.45% |
$80.90
|
67,704
98.12% of 50 DAV
50 DAV is 69,000
|
$87.40
-11.29%
|
2/28/2014
|
$74.65
|
PP = $76.93
|
|
MB = $80.78
|
Most Recent Note - 4/2/2014 5:35:09 PM
Y - Color code is changed to yellow after a 4th consecutive gain today, rising back above its pivot point to within close striking distance of its 52-week high. Found prompt support at its 50 DMA line last week.
>>> FEATURED STOCK ARTICLE : Found Prompt Support Near 50-Day Average After Dip Back Into Prior Base - 4/1/2014
View all notes |
Set NEW NOTE alert |
CANSLIM.net Company Profile |
SEC
News |
Chart |
Request a new note
C
A N
S L
I M
|
SILC
-
NASDAQ
Silicom Ltd
COMPUTER HARDWARE - Networking andamp; Communication Dev
|
$61.67
|
-0.59
-0.95% |
$63.23
|
77,608
77.61% of 50 DAV
50 DAV is 100,000
|
$73.44
-16.03%
|
12/23/2013
|
$44.62
|
PP = $46.25
|
|
MB = $48.56
|
Most Recent Note - 4/3/2014 5:26:50 PM
G - Halted its slide following its damaging 50 DMA line violation last week. A rebound above that important short-term average would help its outlook improve. See the latest FSU analysis for more details and a new annotated graph.
>>> FEATURED STOCK ARTICLE : Halted Slide Following 50-Day Moving Average Violation - 4/3/2014
View all notes |
Set NEW NOTE alert |
CANSLIM.net Company Profile |
SEC
News |
Chart |
Request a new note
C
A N
S L
I M
|
VRX
-
NYSE
Valeant Pharmaceuticals
DRUGS - Drug Manufacturers - Other
|
$129.10
|
-4.59
-3.43% |
$135.03
|
1,948,793
110.04% of 50 DAV
50 DAV is 1,771,000
|
$153.10
-15.68%
|
9/11/2013
|
$100.26
|
PP = $105.50
|
|
MB = $110.78
|
Most Recent Note - 4/3/2014 5:31:01 PM
G - Slumped today after 4 consecutive gains. A violation of its recent low ($124.67 on 3/27/14) would raise more serious concerns. A rally back above the 50 DMA line is needed to help its outlook improve.
>>> FEATURED STOCK ARTICLE : After Damaging Losses a Rebound Above 50 DMA Line is Needed - 4/2/2014
View all notes |
Set NEW NOTE alert |
CANSLIM.net Company Profile |
SEC
News |
Chart |
Request a new note
C
A N
S L
I M
|
|
|
|
THESE ARE NOT BUY RECOMMENDATIONS!
Comments contained in the body of this report are technical
opinions only. The material herein has been obtained
from sources believed to be reliable and accurate, however,
its accuracy and completeness cannot be guaranteed.
This site is not an investment advisor, hence it does
not endorse or recommend any securities or other investments.
Any recommendation contained in this report may not
be suitable for all investors and it is not to be deemed
an offer or solicitation on our part with respect to
the purchase or sale of any securities. All trademarks,
service marks and trade names appearing in this report
are the property of their respective owners, and are
likewise used for identification purposes only.
This report is a service available
only to active Paid Premium Members.
You may opt-out of receiving report notifications
at any time. Questions or comments may be submitted
by writing to Premium Membership Services 665 S.E. 10 Street, Suite 201 Deerfield Beach, FL 33441-5634 or by calling 1-800-965-8307
or 954-785-1121.
|
|
|

