***Last / Change / Volume data in this table is the closing quote data***
Symbol/Exchange
Company Name
Industry Group |
PRICE |
CHANGE
(%Change) |
Day High |
Volume
(% DAV)
(% 50 day avg vol) |
52 Wk Hi
% From Hi |
Featured
Date |
Price
Featured |
Pivot Featured |
|
Max Buy |
ACN
-
NYSE
Accenture Plc
DIVERSIFIED SERVICES - Business/Management Services
|
$64.95
|
-0.54
-0.82% |
$65.49
|
2,264,900
68.46% of 50 DAV
50 DAV is 3,308,500
|
$65.89
-1.43%
|
3/23/2012
|
$64.13
|
PP = $63.76
|
|
MB = $66.95
|
Most Recent Note - 3/28/2012 6:01:25 PM
Y - Pulled back today on lighter (near average) volume. Featured in yellow in the 3/23/12 mid-day report (read here) with a pivot point cited based on its 7/07/11 high plus 10 cents, and its convincing volume-driven gain above the pivot point was backed by +88% above average volume as it triggered a new (or add-on) technical buy signal.
>>> The latest Featured Stock Update with an annotated graph appeared on 3/23/2012. Click here.
View all notes |
Alert me of new notes |
CANSLIM.net Company Profile |
SEC |
Zacks Reports |
StockTalk |
News |
Chart |
Request a new note
C
A N
S L
I M


|
ADS
-
NYSE
Alliance Data Sys Corp
COMPUTER SOFTWARE and SERVICES - Information and Delivery Service
|
$127.19
|
+0.62
0.49% |
$127.34
|
554,587
86.90% of 50 DAV
50 DAV is 638,200
|
$127.55
-0.28%
|
1/17/2012
|
$108.24
|
PP = $107.43
|
|
MB = $112.80
|
Most Recent Note - 3/28/2012 11:18:18 AM
G - Holding its ground stubbornly near its all-time high, still extended from any sound base pattern. Fundamental concerns were raised by earnings reported +9%, well below the +25% minimum guideline in the latest quarter ended December 31, 2011.
>>> The latest Featured Stock Update with an annotated graph appeared on 2/29/2012. Click here.
View all notes |
Alert me of new notes |
CANSLIM.net Company Profile |
SEC |
Zacks Reports |
StockTalk |
News |
Chart |
Request a new note
C
A N
S L
I M
|
ALLT
-
NASDAQ
Allot Communications Ltd
COMPUTER SOFTWARE andamp; SERVICES - Technical andamp; System Software
|
$23.54
|
-0.04
-0.17% |
$24.00
|
1,147,163
276.23% of 50 DAV
50 DAV is 415,300
|
$23.64
-0.42%
|
3/13/2012
|
$19.72
|
PP = $18.91
|
|
MB = $19.86
|
 Most Recent Note - 4/3/2012 11:48:55 AM
G - Churning above average volume today near its 52-week high, extended from its prior base. Prior highs near $18-19 define initial support to watch on pullbacks.
>>> The latest Featured Stock Update with an annotated graph appeared on 3/19/2012. Click here.
View all notes |
Alert me of new notes |
CANSLIM.net Company Profile |
SEC |
Zacks Reports |
StockTalk |
News |
Chart |
Request a new note
C
A N
S L
I M
|
ALXN
-
NASDAQ
Alexion Pharmaceuticals
DRUGS - Drug Manufacturers - Other
|
$93.87
|
+0.82
0.88% |
$93.87
|
1,010,719
76.14% of 50 DAV
50 DAV is 1,327,400
|
$95.01
-1.20%
|
3/12/2012
|
$87.87
|
PP = $87.73
|
|
MB = $92.12
|
Most Recent Note - 3/28/2012 11:53:46 AM
G - Pulling back today with above average volume, enduring distributional pressure after inching to a new all-time high on Monday. Support to watch is at its 50 DMA line ($82.97).
>>> The latest Featured Stock Update with an annotated graph appeared on 2/24/2012. Click here.
View all notes |
Alert me of new notes |
CANSLIM.net Company Profile |
SEC |
Zacks Reports |
StockTalk |
News |
Chart |
Request a new note
C
A N
S L
I M
|
BODY
-
NASDAQ
Body Central Corp
RETAIL - Catalog andamp; Mail Order Houses
|
$27.69
|
-0.06
-0.22% |
$28.00
|
194,630
89.40% of 50 DAV
50 DAV is 217,700
|
$29.49
-6.10%
|
1/27/2012
|
$26.69
|
PP = $25.46
|
|
MB = $26.73
|
Most Recent Note - 4/2/2012 10:27:30 AM
G - Pulling back today when perched within close striking distance of its 52-week high. Found support at its 50 DMA line and prior highs in the $26 area during its recent consolidation. Subsequent damaging losses may trigger a more worrisome technical sell signal.
>>> The latest Featured Stock Update with an annotated graph appeared on 3/13/2012. Click here.
View all notes |
Alert me of new notes |
CANSLIM.net Company Profile |
SEC |
Zacks Reports |
StockTalk |
News |
Chart |
Request a new note
C
A N
S L
I M
|
Symbol/Exchange
Company Name
Industry Group |
PRICE |
CHANGE
(%Change) |
Day High |
Volume
(% DAV)
(% 50 day avg vol) |
52 Wk Hi
% From Hi |
Featured
Date |
Price
Featured |
Pivot Featured |
|
Max Buy |
CDNS
-
NASDAQ
Cadence Design Systems
COMPUTER SOFTWARE and SERVICES - Technical and System Software
|
$11.89
|
+0.00
0.00% |
$11.96
|
2,727,317
81.31% of 50 DAV
50 DAV is 3,354,300
|
$12.60
-5.63%
|
2/3/2012
|
$11.66
|
PP = $11.15
|
|
MB = $11.71
|
Most Recent Note - 3/28/2012 11:21:52 AM
G - Volume totals have been cooling while holding its ground and consolidating near its 52-week high. Prior highs and its 50 DMA line define support to watch on pullbacks.
>>> The latest Featured Stock Update with an annotated graph appeared on 3/28/2012. Click here.
View all notes |
Alert me of new notes |
CANSLIM.net Company Profile |
SEC |
Zacks Reports |
StockTalk |
News |
Chart |
Request a new note
C
A N
S L
I M
|
CELG
-
NASDAQ
Celgene Corp
DRUGS - Drug Manufacturers - Major
|
$80.29
|
+2.09
2.67% |
$80.37
|
4,272,698
154.13% of 50 DAV
50 DAV is 2,772,100
|
$78.83
1.85%
|
2/2/2012
|
$74.16
|
PP = $75.21
|
|
MB = $78.97
|
Most Recent Note - 4/3/2012 4:14:45 PM
G - Today's gain backed by +52% above average volume confirmed a technical buy signal. Color code is changed to green after quickly rallying above its "max buy" level. Its 50 DMA line defines support to watch.
>>> The latest Featured Stock Update with an annotated graph appeared on 3/26/2012. Click here.
View all notes |
Alert me of new notes |
CANSLIM.net Company Profile |
SEC |
Zacks Reports |
StockTalk |
News |
Chart |
Request a new note
C
A N
S L
I M
|
COO
-
NYSE
Cooper Companies Inc
HEALTH SERVICES - Medical Instruments and Supplies
|
$81.55
|
-0.70
-0.85% |
$81.98
|
304,369
75.49% of 50 DAV
50 DAV is 403,200
|
$84.20
-3.14%
|
3/9/2012
|
$83.05
|
PP = $81.02
|
|
MB = $85.07
|
Most Recent Note - 3/30/2012 3:50:49 PM
Y - Perched near its 52-week high today and on track for a 3rd consecutive gain, and color code is changed to yellow again while inching above its pivot point with no resistance remaining. Its Relative Strength rating slumped to a mediocre 64, below the 80+ guideline for buy candidates
>>> The latest Featured Stock Update with an annotated graph appeared on 3/9/2012. Click here.
View all notes |
Alert me of new notes |
CANSLIM.net Company Profile |
SEC |
Zacks Reports |
StockTalk |
News |
Chart |
Request a new note
C
A N
S L
I M
|
DISH
-
NASDAQ
Dish Network Corp Cl A
CONSUMER DURABLES - Electronic Equipment
|
$33.29
|
-0.29
-0.86% |
$33.47
|
1,724,565
64.54% of 50 DAV
50 DAV is 2,672,100
|
$35.64
-6.59%
|
3/7/2012
|
$30.83
|
PP = $30.10
|
|
MB = $31.61
|
Most Recent Note - 3/28/2012 6:03:31 PM
G - Reversed into the red after early gains today. Consolidating above prior highs since blasting higher on 3/22/12 with heavy volume following news the FCC is maneuvering its rules in a way viewed as favorable for the company. Prior highs in the $30 area define initial support to watch on pullbacks.
>>> The latest Featured Stock Update with an annotated graph appeared on 3/14/2012. Click here.
View all notes |
Alert me of new notes |
CANSLIM.net Company Profile |
SEC |
Zacks Reports |
StockTalk |
News |
Chart |
Request a new note
C
A N
S L
I M
|
FEIC
-
NASDAQ
F E I Co
ELECTRONICS - Diversified Electronics
|
$49.02
|
-0.70
-1.41% |
$49.92
|
297,869
94.71% of 50 DAV
50 DAV is 314,500
|
$49.75
-1.47%
|
12/7/2011
|
$41.41
|
PP = $42.35
|
|
MB = $44.47
|
Most Recent Note - 4/3/2012 3:39:23 PM
G - Hovering at its 52-week high today with no resistance due to overhead supply. The latest quarterly report showed +21% earnings for the Dec '11 quarter, below the +25% minimum guideline for earnings growth.
>>> The latest Featured Stock Update with an annotated graph appeared on 3/12/2012. Click here.
View all notes |
Alert me of new notes |
CANSLIM.net Company Profile |
SEC |
Zacks Reports |
StockTalk |
News |
Chart |
Request a new note
C
A N
S L
I M
|
Symbol/Exchange
Company Name
Industry Group |
PRICE |
CHANGE
(%Change) |
Day High |
Volume
(% DAV)
(% 50 day avg vol) |
52 Wk Hi
% From Hi |
Featured
Date |
Price
Featured |
Pivot Featured |
|
Max Buy |
GNC
-
NYSE
G N C Holdings Inc
RETAIL - Drug Stores
|
$36.08
|
+1.18
3.38% |
$36.10
|
2,782,426
177.87% of 50 DAV
50 DAV is 1,564,300
|
$35.20
2.50%
|
1/19/2012
|
$28.99
|
PP = $29.60
|
|
MB = $31.08
|
Most Recent Note - 4/3/2012 12:03:09 PM
G - Its 50 DMA line defines near-term chart support to watch on pullbacks. Still inching higher, it touched a new high today while adding to its recent spurt of small gains on average volume. It completed Secondary Offerings on 10/25/11 and 3/13/12 after making steady progress following its 4/01/11 IPO.
>>> The latest Featured Stock Update with an annotated graph appeared on 3/5/2012. Click here.
View all notes |
Alert me of new notes |
CANSLIM.net Company Profile |
SEC |
Zacks Reports |
StockTalk |
News |
Chart |
Request a new note
C
A N
S L
I M
|
HLF
-
NYSE
Herbalife Ltd
DRUGS - Nutrition and Weight Management
|
$70.54
|
+0.43
0.61% |
$70.59
|
1,246,810
91.87% of 50 DAV
50 DAV is 1,357,100
|
$72.11
-2.18%
|
2/22/2012
|
$65.90
|
PP = $63.50
|
|
MB = $66.68
|
Most Recent Note - 3/28/2012 11:33:28 AM
G - Hovering near its all-time high, stubbornly holding its ground after getting extended from its prior base pattern. Prior highs in the $63 area define support to watch on pullbacks.
>>> The latest Featured Stock Update with an annotated graph appeared on 2/22/2012. Click here.
View all notes |
Alert me of new notes |
CANSLIM.net Company Profile |
SEC |
Zacks Reports |
StockTalk |
News |
Chart |
Request a new note
C
A N
S L
I M
|
ISRG
-
NASDAQ
Intuitive Surgical Inc
HEALTH SERVICES - Medical Appliances and Equipment
|
$548.39
|
+2.57
0.47% |
$549.10
|
202,822
66.83% of 50 DAV
50 DAV is 303,500
|
$550.47
-0.38%
|
12/20/2011
|
$442.43
|
PP = $449.16
|
|
MB = $471.62
|
Most Recent Note - 3/28/2012 11:36:17 AM
G - Stubbornly holding its ground and rising since last noted, getting more extended from any sound base pattern. Previously noted - "The December '11 quarterly earnings increased by just below the borderline +25% minimum guideline for ideal buy candidates. Rather than compromise, disciplined investors may sooner consider another Featured Stock when a fresh technical buy signal occurs."
>>> The latest Featured Stock Update with an annotated graph appeared on 3/1/2012. Click here.
View all notes |
Alert me of new notes |
CANSLIM.net Company Profile |
SEC |
Zacks Reports |
StockTalk |
News |
Chart |
Request a new note
C
A N
S L
I M
|
LULU
-
NASDAQ
Lululemon Athletica
MANUFACTURING - Textile Manufacturing
|
$76.61
|
+1.87
2.50% |
$76.72
|
2,401,570
119.87% of 50 DAV
50 DAV is 2,003,500
|
$76.66
-0.07%
|
1/10/2012
|
$60.97
|
PP = $59.46
|
|
MB = $62.43
|
Most Recent Note - 4/3/2012 4:16:39 PM
G - Up today with slightly higher volume for a best-ever close. It is extended from any sound base. An upward trendline connecting January-March lows defines initial near-term chart support to watch above its 50 DMA line.
>>> The latest Featured Stock Update with an annotated graph appeared on 2/21/2012. Click here.
View all notes |
Alert me of new notes |
CANSLIM.net Company Profile |
SEC |
Zacks Reports |
StockTalk |
News |
Chart |
Request a new note
C
A N
S L
I M
|
MA
-
NYSE
Mastercard Inc Cl A
DIVERSIFIED SERVICES - Business/Management Services
|
$438.02
|
+5.97
1.38% |
$440.60
|
1,152,298
123.35% of 50 DAV
50 DAV is 934,200
|
$437.56
0.11%
|
3/12/2012
|
$419.86
|
PP = $428.67
|
|
MB = $450.10
|
Most Recent Note - 4/2/2012 5:41:00 PM
Y - Up today for its second-best close. Volume-driven gains are needed to clinch a proper new (or add-on) technical buy signal. Its 50 DMA line defines near-term support to watch.
>>> The latest Featured Stock Update with an annotated graph appeared on 2/17/2012. Click here.
View all notes |
Alert me of new notes |
CANSLIM.net Company Profile |
SEC |
Zacks Reports |
StockTalk |
News |
Chart |
Request a new note
C
A N
S L
I M
|
Symbol/Exchange
Company Name
Industry Group |
PRICE |
CHANGE
(%Change) |
Day High |
Volume
(% DAV)
(% 50 day avg vol) |
52 Wk Hi
% From Hi |
Featured
Date |
Price
Featured |
Pivot Featured |
|
Max Buy |
MELI
-
NASDAQ
Mercadolibre Inc
INTERNET - Internet Software and; Services
|
$100.13
|
+2.66
2.73% |
$101.72
|
627,600
129.99% of 50 DAV
50 DAV is 482,800
|
$104.50
-4.18%
|
2/6/2012
|
$97.09
|
PP = $95.58
|
|
MB = $100.36
|
Most Recent Note - 4/3/2012 3:44:33 PM
Y - Up today with higher volume, trading near its "max buy" level. Recently consolidating and staying above its 50 DMA line and above the recent low ($91.38 on 3/06/12) defining important support areas to watch.
>>> The latest Featured Stock Update with an annotated graph appeared on 3/29/2012. Click here.
View all notes |
Alert me of new notes |
CANSLIM.net Company Profile |
SEC |
Zacks Reports |
StockTalk |
News |
Chart |
Request a new note
C
A N
S L
I M
|
MG
-
NYSE
Mistras Group Inc
DIVERSIFIED SERVICES - Bulding and Faci;ity Management Services
|
$24.84
|
+0.38
1.55% |
$25.46
|
96,946
80.65% of 50 DAV
50 DAV is 120,200
|
$26.24
-5.34%
|
3/22/2012
|
$24.96
|
PP = $26.34
|
|
MB = $27.66
|
Most Recent Note - 4/2/2012 5:37:55 PM
Y - Remains below the new pivot point cited in the 3/22/12 mid-day report based on its 52-week high plus 10 cents. See the latest FSU analysis for more details and a new annotated weekly graph.
>>> The latest Featured Stock Update with an annotated graph appeared on 4/2/2012. Click here.
View all notes |
Alert me of new notes |
CANSLIM.net Company Profile |
SEC |
Zacks Reports |
StockTalk |
News |
Chart |
Request a new note
C
A N
S L
I M
|
MKTX
-
NASDAQ
Marketaxess Holdings Inc
FINANCIAL SERVICES - Investment Brokerage - Nationa
|
$37.55
|
-0.10
-0.27% |
$37.64
|
232,538
82.61% of 50 DAV
50 DAV is 281,500
|
$37.95
-1.05%
|
3/8/2012
|
$35.80
|
PP = $35.52
|
|
MB = $37.30
|
Most Recent Note - 3/28/2012 5:27:04 PM
G - Finished near the session high with small gain today on average volume, touching a new all-time high. Color code is changed to green after rising above its "max buy" level. Its 50 DMA line defines important support to watch.
>>> The latest Featured Stock Update with an annotated graph appeared on 3/8/2012. Click here.
View all notes |
Alert me of new notes |
CANSLIM.net Company Profile |
SEC |
Zacks Reports |
StockTalk |
News |
Chart |
Request a new note
C
A N
S L
I M
|
NTES
-
NASDAQ
Netease.Com Inc Adr
INTERNET - Internet Information Providers
|
$59.05
|
-0.86
-1.44% |
$60.34
|
725,807
107.59% of 50 DAV
50 DAV is 674,600
|
$60.47
-2.35%
|
3/19/2012
|
$56.18
|
PP = $55.10
|
|
MB = $57.86
|
Most Recent Note - 4/2/2012 5:39:23 PM
G - Up today for its second-best close. It is extended from its prior base. Its old highs in the $55 area define initial support to watch on pullbacks.
>>> The latest Featured Stock Update with an annotated graph appeared on 3/27/2012. Click here.
View all notes |
Alert me of new notes |
CANSLIM.net Company Profile |
SEC |
Zacks Reports |
StockTalk |
News |
Chart |
Request a new note
C
A N
S L
I M
|
RAX
-
NYSE
Rackspace Hosting Inc
INTERNET - Internet Software and; Services
|
$58.94
|
+1.50
2.61% |
$59.08
|
2,330,333
111.84% of 50 DAV
50 DAV is 2,083,600
|
$59.43
-0.82%
|
2/2/2012
|
$46.69
|
PP = $45.55
|
|
MB = $47.83
|
Most Recent Note - 4/3/2012 3:41:43 PM
G - Up today, poised for a best-ever close, extended from its prior base. Its 50 DMA line defines important near-term support to watch.
>>> The latest Featured Stock Update with an annotated graph appeared on 2/16/2012. Click here.
View all notes |
Alert me of new notes |
CANSLIM.net Company Profile |
SEC |
Zacks Reports |
StockTalk |
News |
Chart |
Request a new note
C
A N
S L
I M
|
Symbol/Exchange
Company Name
Industry Group |
PRICE |
CHANGE
(%Change) |
Day High |
Volume
(% DAV)
(% 50 day avg vol) |
52 Wk Hi
% From Hi |
Featured
Date |
Price
Featured |
Pivot Featured |
|
Max Buy |
RGR
-
NYSE
Sturm Ruger & Co Inc
CONSUMER DURABLES - Sporting Goods
|
$51.51
|
+0.41
0.80% |
$53.29
|
690,024
219.33% of 50 DAV
50 DAV is 314,600
|
$50.72
1.56%
|
3/22/2012
|
$46.49
|
PP = $46.78
|
|
MB = $49.12
|
Most Recent Note - 4/3/2012 12:13:05 PM
G - Up today for a 4th consecutive gain and yet another new high. Prior high in the $46 area defines initial chart support to watch on pullbacks toward its 50 DMA line.
>>> The latest Featured Stock Update with an annotated graph appeared on 3/22/2012. Click here.
View all notes |
Alert me of new notes |
CANSLIM.net Company Profile |
SEC |
Zacks Reports |
StockTalk |
News |
Chart |
Request a new note
C
A N
S L
I M
|
RRTS
-
NYSE
Roadrunner Trans Systems
TRANSPORTATION - Air Delivery and Freight Service
|
$17.75
|
-0.08
-0.45% |
$17.92
|
42,244
28.66% of 50 DAV
50 DAV is 147,400
|
$18.59
-4.52%
|
2/10/2012
|
$17.40
|
PP = $17.50
|
|
MB = $18.38
|
Most Recent Note - 4/2/2012 12:19:16 PM
Y - Testing support at its 50 DMA line today. Subsequent losses would raise concerns and trigger technical sell signals. A new pivot point was not cited, yet it has built a base-on-base pattern while consolidating above prior highs in the $17 area.
>>> The latest Featured Stock Update with an annotated graph appeared on 2/13/2012. Click here.
View all notes |
Alert me of new notes |
CANSLIM.net Company Profile |
SEC |
Zacks Reports |
StockTalk |
News |
Chart |
Request a new note
C
A N
S L
I M
|
SHFL
-
NASDAQ
Shuffle Master Inc
MANUFACTURING - Diversified Machinery
|
$18.43
|
+0.15
0.82% |
$18.77
|
1,024,105
168.91% of 50 DAV
50 DAV is 606,300
|
$18.38
0.27%
|
3/6/2012
|
$17.07
|
PP = $15.25
|
|
MB = $16.01
|
Most Recent Note - 4/3/2012 12:19:56 PM
G - Today's 3rd consecutive gain helped it hit a new 52-week high. It may produce more climactic gains, but it is extended from any sound base pattern. Its 50 DMA line defines support to watch on pullbacks.
>>> The latest Featured Stock Update with an annotated graph appeared on 3/15/2012. Click here.
View all notes |
Alert me of new notes |
CANSLIM.net Company Profile |
SEC |
Zacks Reports |
StockTalk |
News |
Chart |
Request a new note
C
A N
S L
I M
|
SWI
-
NYSE
Solarwinds Inc
COMPUTER SOFTWARE and SERVICES - Application Software
|
$39.50
|
+0.14
0.36% |
$39.98
|
771,396
61.91% of 50 DAV
50 DAV is 1,245,900
|
$42.22
-6.44%
|
1/26/2012
|
$32.36
|
PP = $33.78
|
|
MB = $35.47
|
Most Recent Note - 3/28/2012 11:06:58 AM
G - Pulling back from its new all-time high hit with a volume-driven gain on Monday. It is extended from its last sound base pattern. Earnings below the +25% guideline for the Dec '11 quarter raised fundamental concerns, yet its bullish technical action has argued for disciplined investors to give it the benefit of the doubt until technical sell signals occur.
>>> The latest Featured Stock Update with an annotated graph appeared on 3/16/2012. Click here.
View all notes |
Alert me of new notes |
CANSLIM.net Company Profile |
SEC |
Zacks Reports |
StockTalk |
News |
Chart |
Request a new note
C
A N
S L
I M
|
SXCI
-
NASDAQ
S X C Health Solutions
COMPUTER SOFTWARE and SERVICES - Healthcare Information Service
|
$78.87
|
+4.77
6.44% |
$79.26
|
1,210,846
305.23% of 50 DAV
50 DAV is 396,700
|
$76.42
3.21%
|
2/23/2012
|
$68.24
|
PP = $66.05
|
|
MB = $69.35
|
Most Recent Note - 4/3/2012 12:21:17 PM
G - Considerable volume-driven gain today for a new 52-week high, getting more extended from its prior base. Its 50 DMA line and prior highs in the $66 area define support to watch on pullbacks.
>>> The latest Featured Stock Update with an annotated graph appeared on 3/6/2012. Click here.
View all notes |
Alert me of new notes |
CANSLIM.net Company Profile |
SEC |
Zacks Reports |
StockTalk |
News |
Chart |
Request a new note
C
A N
S L
I M
|
Symbol/Exchange
Company Name
Industry Group |
PRICE |
CHANGE
(%Change) |
Day High |
Volume
(% DAV)
(% 50 day avg vol) |
52 Wk Hi
% From Hi |
Featured
Date |
Price
Featured |
Pivot Featured |
|
Max Buy |
TDG
-
NYSE
Transdigm Group Inc
AEROSPACE/DEFENSE - Aerospace/Defense Products and; Services
|
$117.28
|
+0.28
0.24% |
$117.70
|
274,254
63.44% of 50 DAV
50 DAV is 432,300
|
$121.48
-3.46%
|
2/29/2012
|
$120.10
|
PP = $118.93
|
|
MB = $124.88
|
Most Recent Note - 3/30/2012 4:35:12 PM
Y - Up today on light volume after enduring mild distributional pressure this week. It remains below its latest pivot point cited, not having triggered a new buy signal. Its 50 DMA line defines important chart support to watch, and a violation of that important short-term average would trigger a technical sell signal. See the latest FSU analysis for more details and a new annotated graph.
>>> The latest Featured Stock Update with an annotated graph appeared on 3/30/2012. Click here.
View all notes |
Alert me of new notes |
CANSLIM.net Company Profile |
SEC |
Zacks Reports |
StockTalk |
News |
Chart |
Request a new note
C
A N
S L
I M
|
TIBX
-
NASDAQ
Tibco Software Inc
COMPUTER SOFTWARE and SERVICES - Business Software and Services
|
$31.56
|
+0.26
0.83% |
$31.97
|
3,358,006
138.12% of 50 DAV
50 DAV is 2,431,300
|
$33.00
-4.36%
|
3/30/2012
|
$31.01
|
PP = $31.25
|
|
MB = $32.81
|
Most Recent Note - 4/2/2012 5:47:02 PM
Y - Volume was 2 times average behind today's gain. Reported earnings +25% on +22% sales revenues for the quarter ended February 29, 2012 versus they year ago period. It was featured again in yellow in the 3/30/12 mid-day report with the graph below included while noted - "Fundamentals remain strong concerning the C and A criteria."

>>> The latest Featured Stock Update with an annotated graph appeared on 5/18/2011. Click here.
View all notes |
Alert me of new notes |
CANSLIM.net Company Profile |
SEC |
Zacks Reports |
StockTalk |
News |
Chart |
Request a new note
C
A N
S L
I M
|
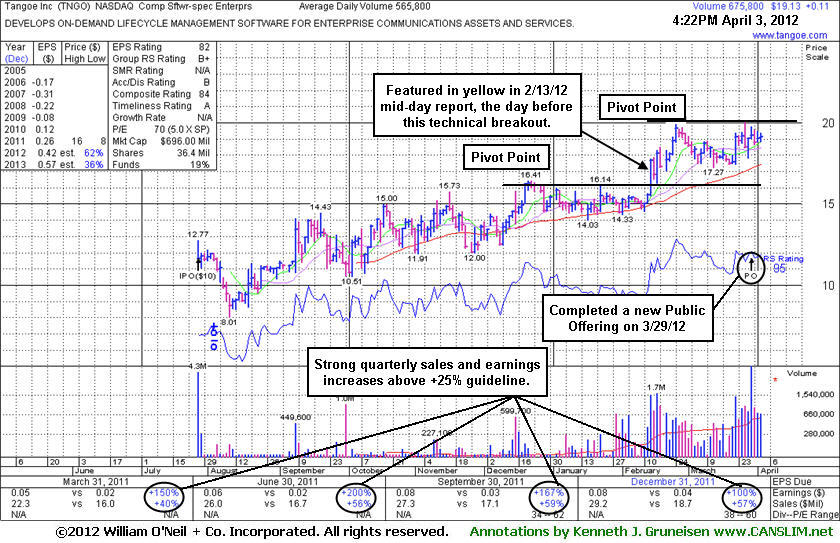
TNGO
-
NASDAQ
Tangoe Inc
COMPUTER SOFTWARE and SERVICES - Technical and System Software
|
$19.12
|
+0.10
0.53% |
$19.38
|
683,337
120.77% of 50 DAV
50 DAV is 565,800
|
$20.05
-4.64%
|
3/27/2012
|
$19.35
|
PP = $20.00
|
|
MB = $21.00
|
Most Recent Note - 4/3/2012 4:45:40 PM
Y - Still perched near its 52-week high, it completed a new Public Offering on 3/29/12. See the latest FSU analysis for more details and a new annotated graph.
>>> The latest Featured Stock Update with an annotated graph appeared on 4/3/2012. Click here.
View all notes |
Alert me of new notes |
CANSLIM.net Company Profile |
SEC |
Zacks Reports |
StockTalk |
News |
Chart |
Request a new note
C
A N
S L
I M
|
TSCO
-
NASDAQ
Tractor Supply Co
SPECIALTY RETAIL - Specialty Retail, Other
|
$92.89
|
+1.03
1.12% |
$93.22
|
668,999
103.51% of 50 DAV
50 DAV is 646,300
|
$92.74
0.16%
|
1/12/2012
|
$79.12
|
PP = $75.58
|
|
MB = $79.36
|
Most Recent Note - 4/2/2012 5:48:49 PM
G - Up today for its best-ever close. Its 50 DMA line defines support to watch on pullbacks.
>>> The latest Featured Stock Update with an annotated graph appeared on 2/27/2012. Click here.
View all notes |
Alert me of new notes |
CANSLIM.net Company Profile |
SEC |
Zacks Reports |
StockTalk |
News |
Chart |
Request a new note
C
A N
S L
I M
|
UA
-
NYSE
Under Armour Inc Cl A
CONSUMER NON-DURABLES - Textile - Apparel Clothing
|
$98.09
|
+1.90
1.98% |
$98.24
|
789,336
67.48% of 50 DAV
50 DAV is 1,169,700
|
$99.35
-1.27%
|
2/15/2012
|
$85.77
|
PP = $84.86
|
|
MB = $89.10
|
Most Recent Note - 4/3/2012 4:19:32 PM
G - Up today with light volume for its second-best close ever. It is extended from its last sound base pattern and recent gains above its pivot point did not have volume sufficient to trigger a proper technical buy signal.
>>> The latest Featured Stock Update with an annotated graph appeared on 2/15/2012. Click here.
View all notes |
Alert me of new notes |
CANSLIM.net Company Profile |
SEC |
Zacks Reports |
StockTalk |
News |
Chart |
Request a new note
C
A N
S L
I M
|
Symbol/Exchange
Company Name
Industry Group |
PRICE |
CHANGE
(%Change) |
Day High |
Volume
(% DAV)
(% 50 day avg vol) |
52 Wk Hi
% From Hi |
Featured
Date |
Price
Featured |
Pivot Featured |
|
Max Buy |
UBNT
-
NASDAQ
Ubiquiti Networks Inc
TELECOMMUNICATIONS - Diversified Communication Serv
|
$32.95
|
+0.62
1.92% |
$33.10
|
297,832
88.91% of 50 DAV
50 DAV is 335,000
|
$33.97
-3.00%
|
1/27/2012
|
$22.25
|
PP = $23.14
|
|
MB = $24.30
|
Most Recent Note - 3/30/2012 12:33:51 PM
G - Perched near its 52-week high today, extended from the previous base. Its 50 DMA line defines important near-term support to watch on pullbacks.
>>> The latest Featured Stock Update with an annotated graph appeared on 3/21/2012. Click here.
View all notes |
Alert me of new notes |
CANSLIM.net Company Profile |
SEC |
Zacks Reports |
StockTalk |
News |
Chart |
Request a new note
C
A N
S L
I M
|
ULTA
-
NASDAQ
Ulta Salon Cosm & Frag
SPECIALTY RETAIL - Specialty Retail, Other
|
$95.01
|
+1.09
1.16% |
$95.62
|
808,089
117.69% of 50 DAV
50 DAV is 686,600
|
$94.73
0.29%
|
1/11/2012
|
$71.97
|
PP = $75.80
|
|
MB = $79.59
|
Most Recent Note - 3/28/2012 11:45:09 AM
G - Perched near its all-time high today with volume totals cooling. Its 50 DMA line defines support above its prior highs in the $75 area. It is extended from any sound base pattern.
>>> The latest Featured Stock Update with an annotated graph appeared on 2/28/2012. Click here.
View all notes |
Alert me of new notes |
CANSLIM.net Company Profile |
SEC |
Zacks Reports |
StockTalk |
News |
Chart |
Request a new note
C
A N
S L
I M
|
V
-
NYSE
Visa Inc Cl A
DIVERSIFIED SERVICES - Business/Management Services
|
$120.36
|
+1.38
1.16% |
$120.59
|
3,922,596
109.36% of 50 DAV
50 DAV is 3,586,900
|
$120.70
-0.28%
|
3/12/2012
|
$116.53
|
PP = $119.46
|
|
MB = $125.43
|
Most Recent Note - 3/28/2012 11:47:08 AM
Y - Touched another new all-time high on 3/26/12 with a gain on average volume. Volume-driven gains may trigger a new (or add-on) technical buy signal, meanwhile its 50 DMA line defines support to watch above prior highs in the $103-104 area.
>>> The latest Featured Stock Update with an annotated graph appeared on 3/7/2012. Click here.
View all notes |
Alert me of new notes |
CANSLIM.net Company Profile |
SEC |
Zacks Reports |
StockTalk |
News |
Chart |
Request a new note
C
A N
S L
I M
|