You are not logged in.
This means you
CAN ONLY VIEW reports that were published prior to Monday, April 14, 2025.
You
MUST UPGRADE YOUR MEMBERSHIP if you want to see any current reports.
AFTER MARKET UPDATE - TUESDAY, APRIL 2ND, 2013
Previous After Market Report Next After Market Report >>>
|
|
|
|
DOW |
+89.16 |
14,662.01 |
+0.61% |
|
Volume |
639,449,610 |
+11% |
|
Volume |
1,525,907,370 |
+6% |
|
NASDAQ |
+15.69 |
3,254.86 |
+0.48% |
|
Advancers |
1,435 |
46% |
|
Advancers |
1,093 |
43% |
|
S&P 500 |
+8.08 |
1,570.25 |
+0.52% |
|
Decliners |
1,546 |
50% |
|
Decliners |
1,368 |
53% |
|
Russell 2000 |
-4.49 |
934.30 |
-0.48% |
|
52 Wk Highs |
279 |
|
|
52 Wk Highs |
133 |
|
|
S&P 600 |
-2.53 |
522.25 |
-0.48% |
|
52 Wk Lows |
23 |
|
|
52 Wk Lows |
27 |
|
|
 |
Major Indices Pushed To New Record High Closes
Kenneth J. Gruneisen - Passed the CAN SLIM® Master's Exam
Tuesday was a positive session for the major averages as the Dow Jones Industrial Average and the S&P 500 Index each closed at their best-ever levels, however breadth had a slightly negative tilt as decliners edged out advancers on the NYSE and the Nasdaq exchange. The volume totals were reported higher than the prior session total on the NYSE and on the Nasdaq exchange. The total number of stocks hitting new 52-week highs easily outnumbered new 52-week lows on the NYSE and on the Nasdaq exchange. There were 61 high-ranked companies from the CANSLIM.net Leaders List making new 52-week highs and appearing on the CANSLIM.net BreakOuts Page, matching the prior session total of 61 stocks. There were gains for only 4 of the 18 high-ranked companies currently included on the Featured Stocks Page.
New data showed February factory orders rose +3%, slightly above expectations, confirming that the economy is steadily improving. That followed a weak reading on U.S. manufacturing on Monday that sparked a pullback in stocks. Stocks rose on Tuesday, led by the healthcare sector after a government decision on payment rates. The U.S. government dropped plans to cut payments for private Medicare Advantage insurers and instead said it would allow a +3.3% raise. The news boosted shares of some health insurers, including Humana (HUM +5.5%), which reportedly derives about 2/3 of its revenue from Medicare Advantage business. The March jobs report due Friday could give clues on how successful the Federal Reserve has been in lowering unemployment, one of the primary headwinds for the economy. About 200,000 jobs were created last month, according to a Reuters poll, down from 236,000 in February. The unemployment rate is expected to come in at 7.7%, unchanged from the previous period.
Hertz Global Holdings Inc (HTZ +6.8%) rallied after the company forecast strong earnings and revenue through 2015 due to increasing global demand for car rentals and benefits from its recently completed acquisition of Dollar Thrifty. Delta Airlines Inc (DAL -8.06%) fell after the company said unit revenue for March rose at a slower pace than in the prior two months. Shares of Hewlett-Packard Co (HPQ -5.19%) fell after an analyst at Goldman Sachs Group Inc (GS +0.44%) downgraded the company to a "sell" rating.
New buying efforts are justified under the fact-based system since a follow-through day on 3/05/13 shifted the market's (M criteria) direction to a confirmed rally again after a brief correction. Any sustainable rally requires a healthy crop of companies hitting new 52-week highs, so it is always essential to see meaningful leadership (stocks hitting new 52-week highs).
Watch for an announcement via email concerning the next WEBCAST. The webcast will also be available via an updated link highlighted at the top of the Premium Member Homepage.
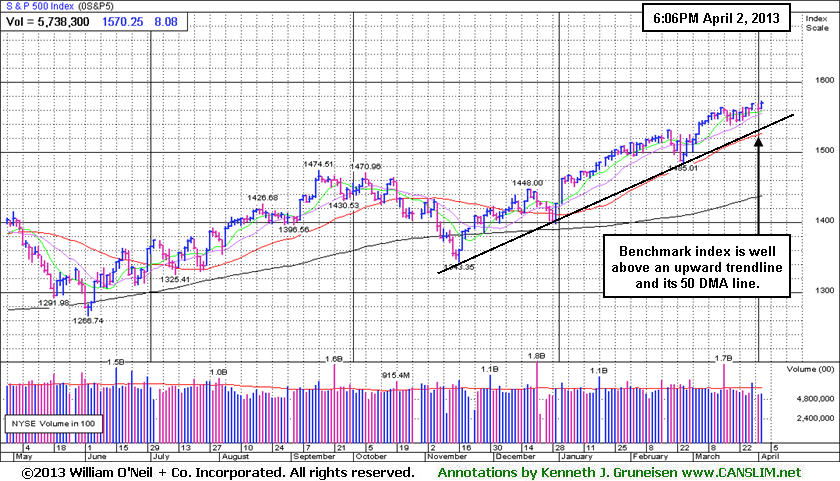
PICTURED: The S&P 500 Index ended at its best all-time high close and the benchmark index has rallied +10.1% year-to-date. It remains perched short of breaking above its October '07 all-time intra-day high of 1,576.09.
|
 Kenneth J. Gruneisen started out as a licensed stockbroker in August 1987, a couple of months prior to the historic stock market crash that took the Dow Jones Industrial Average down -22.6% in a single day. He has published daily fact-based fundamental and technical analysis on high-ranked stocks online for two decades. Through FACTBASEDINVESTING.COM, Kenneth provides educational articles, news, market commentary, and other information regarding proven investment systems that work in good times and bad.
Comments contained in the body of this report are technical opinions only and are not necessarily those of Gruneisen Growth Corp. The material herein has been obtained from sources believed to be reliable and accurate, however, its accuracy and completeness cannot be guaranteed. Our firm, employees, and customers may effect transactions, including transactions contrary to any recommendation herein, or have positions in the securities mentioned herein or options with respect thereto. Any recommendation contained in this report may not be suitable for all investors and it is not to be deemed an offer or solicitation on our part with respect to the purchase or sale of any securities. |
|
 |
Broker/Dealer Index Rally Follows BCG Partners' Sale to Nasdaq OMX
Kenneth J. Gruneisen - Passed the CAN SLIM® Master's Exam
The Broker/Dealer Index ($XBD +4.08%) was a standout gainer while the Gold & Silver Index ($XAU -3.94%) was a standout decliner on Tuesday. The Healthcare Index ($HMO +2.65%) and Biotechnology Index ($BTK +1.31%) each had a positive bias while medical-related shares rose. The Retail Index ($RLX +0.98%) helped the major averages have a positive bias. The Bank Index ($BKX -0.04%) finished flat and the Internet Index ($IIX +0.33%) edged higher. The tech sector generally created a drag as the Semiconductor Index ($SOX -0.84%) and Networking Index ($NWX -0.75%) both fell. Energy-related shares also drifted lower as the Integrated Oil Index ($XOI -0.50%) and Oil Services Index ($OSX -0.29%) each ended modestly lower.
Charts courtesy www.stockcharts.com
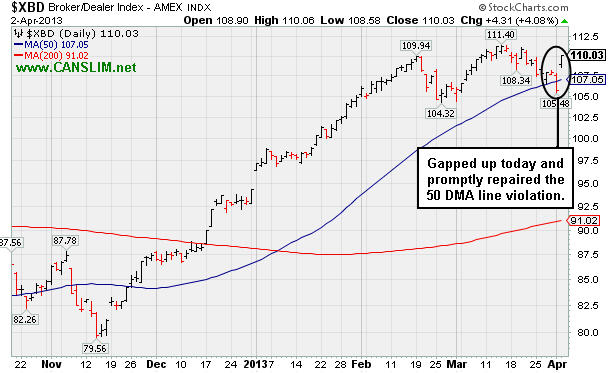
PICTURED: The Broker/Dealer Index ($XBD +4.08%) gapped up today, promptly repairing the 50-day moving average (DMA) violation previously shown. A big gain in one of the index's components was a factor as shares of BGC Partners, Inc. (BCGF +48.7%) blasted higher in reaction to Monday's late news of the sale of its eSpeed platform to Nasdaq OMX Group Inc (NDAQ -12.81%).
| Oil Services |
$OSX |
241.40 |
-0.69 |
-0.29% |
+9.65% |
| Healthcare |
$HMO |
2,919.21 |
+75.40 |
+2.65% |
+16.11% |
| Integrated Oil |
$XOI |
1,354.25 |
-6.83 |
-0.50% |
+9.05% |
| Semiconductor |
$SOX |
424.21 |
-3.59 |
-0.84% |
+10.45% |
| Networking |
$NWX |
228.94 |
-1.74 |
-0.75% |
+1.05% |
| Internet |
$IIX |
361.95 |
+1.20 |
+0.33% |
+10.69% |
| Broker/Dealer |
$XBD |
110.03 |
+4.31 |
+4.08% |
+16.65% |
| Retail |
$RLX |
729.14 |
+7.07 |
+0.98% |
+11.65% |
| Gold & Silver |
$XAU |
128.70 |
-5.28 |
-3.94% |
-22.28% |
| Bank |
$BKX |
55.81 |
-0.02 |
-0.04% |
+8.83% |
| Biotech |
$BTK |
1,838.18 |
+23.74 |
+1.31% |
+18.82% |
|
|
|
 |
Close Below 50-Day Moving Average Raises Concern
Kenneth J. Gruneisen - Passed the CAN SLIM® Master's Exam
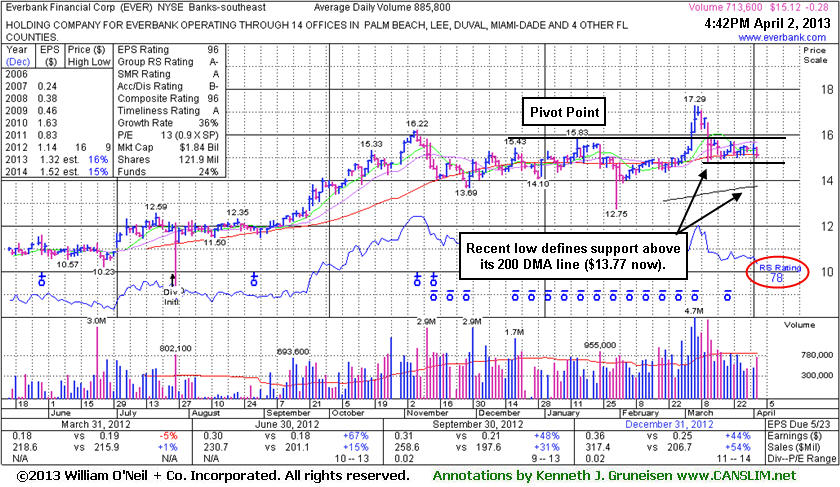
Everbank Financial Corp (EVER -$0.28 or -1.82% to $15.12) slumped to a close just below its 50-day moving average (DMA) line ($15.16 now) today raising additional concerns. That important short-term average has acted as support ever since damaging losses violated prior highs in the $16 area. The recent low of $14.78 on 3/12/13 defines near-term support above its longer-term 200 DMA line.
It was last shown in this FSU section on 3/04/13 with an annotated graph under the headline, "Financial Firm Has Formed Ideal Base But Needs Confirming Gains", after highlighted in yellow with pivot point cited based on its 1/15/13 high while building on a "double bottom" base pattern in the mid-day report (read here). Soon thereafter it produced volume-driven gains above its pivot point to trigger a technical buy signal, but it stalled and negated the breakout by closing back in the prior base. Disciplined investors avoid chasing extended stocks more than +5% above their pivot point and always limit losses by selling if any stock falls more than -7% from their purchase price.
It reported earnings +44% on +54% sales revenues for the Dec '12 quarter satisfying the C criteria with its 3rd quarter with earnings above the +25% minimum guideline (C criteria)." The number of top-rated funds owning its shat res rose from 101 in Jun '12 to 147 in Dec '12 a reassuring sign concerning the I criteria. The Banks - Southeast industry group has a high 88 Relative Strength Rating while other strong leadership in the group also helps in satisfying the L criteria.
|
|
|
Color Codes Explained :
Y - Better candidates highlighted by our
staff of experts.
G - Previously featured
in past reports as yellow but may no longer be buyable under the
guidelines.
***Last / Change / Volume data in this table is the closing quote data***
Symbol/Exchange
Company Name
Industry Group |
PRICE |
CHANGE
(%Change) |
Day High |
Volume
(% DAV)
(% 50 day avg vol) |
52 Wk Hi
% From Hi |
Featured
Date |
Price
Featured |
Pivot Featured |
|
Max Buy |
AMBA
-
NASDAQ
Ambarella Inc
ELECTRONICS - Semiconductor - Specialized
|
$14.94
|
+0.07
0.47% |
$15.54
|
276,567
96.47% of 50 DAV
50 DAV is 286,700
|
$16.00
-6.63%
|
3/26/2013
|
$15.31
|
PP = $14.83
|
|
MB = $15.57
|
Most Recent Note - 4/1/2013 11:58:31 AM
Y - Gapped up today and touched a new 52-week high then reversed into the red. Rallied above its pivot point with a considerable gain backed by 5 times average volume on 3/26/13 triggering a technical buy signal from a cup-with-high-handle base. See the latest FSU analysis for more details and a new annotated graph.
>>> The latest Featured Stock Update with an annotated graph appeared on 3/26/2013. Click here.
View all notes |
Alert me of new notes |
CANSLIM.net Company Profile |
SEC |
Zacks Reports |
StockTalk |
News |
Chart |
Request a new note
C
A N
S L
I M


|
CELG
-
NASDAQ
Celgene Corp
DRUGS - Drug Manufacturers - Major
|
$117.79
|
+0.75
0.64% |
$118.78
|
2,908,418
87.22% of 50 DAV
50 DAV is 3,334,500
|
$117.94
-0.13%
|
3/27/2013
|
$113.24
|
PP = $115.54
|
|
MB = $121.32
|
Most Recent Note - 3/28/2013 6:05:26 PM
Y - It wedged to new highs from an advanced "3-weeks tight" base with only average volume behind its gain today above the new pivot point cited based on its 3/14/13 high plus 10 cents. See the latest FSU analysis for more details and a new annotated weekly graph.
>>> The latest Featured Stock Update with an annotated graph appeared on 3/28/2013. Click here.
View all notes |
Alert me of new notes |
CANSLIM.net Company Profile |
SEC |
Zacks Reports |
StockTalk |
News |
Chart |
Request a new note
C
A N
S L
I M
|
CFNL
-
NASDAQ
Cardinal Financial Corp
BANKING - Regional - Southeast Banks
|
$17.58
|
-0.12
-0.68% |
$17.84
|
304,600
142.20% of 50 DAV
50 DAV is 214,200
|
$18.40
-4.46%
|
3/22/2013
|
$17.99
|
PP = $18.29
|
|
MB = $19.20
|
Most Recent Note - 3/28/2013 2:36:56 PM
Y - Inched higher with small gains lacking great volume conviction since forming the previously noted advanced "3-weeks tight" base. Gains above the pivot point must have at least the bare minimum +40% above average volume, preferably more, to trigger a proper new (or add-on) technical buy signal.
>>> The latest Featured Stock Update with an annotated graph appeared on 3/18/2013. Click here.
View all notes |
Alert me of new notes |
CANSLIM.net Company Profile |
SEC |
Zacks Reports |
StockTalk |
News |
Chart |
Request a new note
C
A N
S L
I M
|
CMCSA
-
NASDAQ
Comcast Corp Cl A
MEDIA - CATV Systems
|
$42.30
|
+0.92
2.21% |
$42.36
|
14,515,668
101.59% of 50 DAV
50 DAV is 14,289,000
|
$42.07
0.55%
|
12/3/2012
|
$37.08
|
PP = $38.06
|
|
MB = $39.96
|
 Most Recent Note - 4/2/2013 4:36:31 PM
G - Finished near the session high with a gain on average volume for a new 52-week high. Found recent support and rallied from its 50 DMA line. Relative Strength Rating is at 79, just below the 80+ guideline for buy candidates. Fundamental concerns also remain since it reported earnings +11% on +6% sales revenues for the Dec '12 quarter, below the +25% minimum guideline (C criteria).
>>> The latest Featured Stock Update with an annotated graph appeared on 3/19/2013. Click here.
View all notes |
Alert me of new notes |
CANSLIM.net Company Profile |
SEC |
Zacks Reports |
StockTalk |
News |
Chart |
Request a new note
C
A N
S L
I M
|
CVLT
-
NASDAQ
Commvault Systems Inc
COMPUTER SOFTWARE and SERVICES - Business Software and Services
|
$80.78
|
+0.01
0.01% |
$81.81
|
360,901
48.94% of 50 DAV
50 DAV is 737,500
|
$86.89
-7.03%
|
3/14/2013
|
$84.71
|
PP = $79.63
|
|
MB = $83.61
|
Most Recent Note - 4/2/2013 4:38:34 PM
Y - Quietly held its ground today. Volume totals have been cooling in recent weeks while consolidating above prior highs in the $79 area defining initial chart support to watch. Its technical breakout on 3/14/13 was backed by 4.5 times average volume. Prior highs define initial support to watch above its 50 DMA line.
>>> The latest Featured Stock Update with an annotated graph appeared on 3/14/2013. Click here.
View all notes |
Alert me of new notes |
CANSLIM.net Company Profile |
SEC |
Zacks Reports |
StockTalk |
News |
Chart |
Request a new note
C
A N
S L
I M
|
Symbol/Exchange
Company Name
Industry Group |
PRICE |
CHANGE
(%Change) |
Day High |
Volume
(% DAV)
(% 50 day avg vol) |
52 Wk Hi
% From Hi |
Featured
Date |
Price
Featured |
Pivot Featured |
|
Max Buy |
EVER
-
NYSE
Everbank Financial Corp
BANKING
|
$15.12
|
-0.28
-1.82% |
$15.50
|
714,467
80.66% of 50 DAV
50 DAV is 885,800
|
$17.29
-12.55%
|
3/4/2013
|
$15.38
|
PP = $15.83
|
|
MB = $16.62
|
Most Recent Note - 4/2/2013 4:40:04 PM
G - Slumped to a close just below its 50 DMA line ($15.16 now) today. That important short-term average has acted as support since damaging losses violated prior highs in the $16 area raising concerns while completely negating its prior technical breakout.
>>> The latest Featured Stock Update with an annotated graph appeared on 4/2/2013. Click here.
View all notes |
Alert me of new notes |
CANSLIM.net Company Profile |
SEC |
Zacks Reports |
StockTalk |
News |
Chart |
Request a new note
C
A N
S L
I M
|
FLT
-
NYSE
Fleetcor Technologies
DIVERSIFIED SERVICES - Business/Management Services
|
$77.83
|
+0.59
0.76% |
$78.13
|
825,981
107.16% of 50 DAV
50 DAV is 770,800
|
$77.91
-0.10%
|
3/21/2013
|
$71.14
|
PP = $73.00
|
|
MB = $76.65
|
Most Recent Note - 4/1/2013 6:04:06 PM
G - Color code is changed to green after a gain today with above average volume for another new 52-week high, getting extended above its "max buy" level. Prior high in the $72 area defines near-term support to watch on pullbacks.
>>> The latest Featured Stock Update with an annotated graph appeared on 3/21/2013. Click here.
View all notes |
Alert me of new notes |
CANSLIM.net Company Profile |
SEC |
Zacks Reports |
StockTalk |
News |
Chart |
Request a new note
C
A N
S L
I M
|
KORS
-
NYSE
Michael Kors Hldgs Ltd
RETAIL - Apparel Stores
|
$54.16
|
-1.34
-2.41% |
$56.35
|
4,338,358
71.61% of 50 DAV
50 DAV is 6,058,500
|
$65.10
-16.80%
|
1/23/2013
|
$54.98
|
PP = $58.72
|
|
MB = $61.66
|
Most Recent Note - 4/2/2013 4:29:26 PM
Slumping further below its 50 DMA line today. It will be dropped from the Featured Stocks list tonight. Relative Strength rating has slumped to 68, below the 80+ minimum guideline. May find support above its 200 DMA line, but gains above its 50 DMA line are needed for its outlook to improve.
>>> The latest Featured Stock Update with an annotated graph appeared on 3/8/2013. Click here.
View all notes |
Alert me of new notes |
CANSLIM.net Company Profile |
SEC |
Zacks Reports |
StockTalk |
News |
Chart |
Request a new note
C
A N
S L
I M
|
LNKD
-
NYSE
Linkedin Corp Class A
INTERNET - Internet Information Providers
|
$172.68
|
-0.93
-0.54% |
$175.70
|
1,376,524
56.21% of 50 DAV
50 DAV is 2,448,900
|
$184.15
-6.23%
|
2/8/2013
|
$147.04
|
PP = $127.55
|
|
MB = $133.93
|
Most Recent Note - 4/1/2013 6:09:52 PM
G - Volume was higher but below average behind today's loss. It is still extended from its prior base, meanwhile its 50 DMA line defines important near term support to watch on pullbacks.
>>> The latest Featured Stock Update with an annotated graph appeared on 3/11/2013. Click here.
View all notes |
Alert me of new notes |
CANSLIM.net Company Profile |
SEC |
Zacks Reports |
StockTalk |
News |
Chart |
Request a new note
C
A N
S L
I M
|
LOPE
-
NASDAQ
Grand Canyon Education
DIVERSIFIED SERVICES - Education and; Training Services
|
$23.91
|
-0.21
-0.87% |
$24.19
|
262,067
58.10% of 50 DAV
50 DAV is 451,100
|
$27.18
-12.03%
|
2/20/2013
|
$26.44
|
PP = $25.10
|
|
MB = $26.36
|
Most Recent Note - 4/2/2013 5:49:11 PM
Slumped to a weak close just below its 50 DMA line with above average volume behind today's loss. Its Relative Strength Rating has also slumped to 74, below the 80+ minimum guideline for buy candidates. It will be dropped from the Featured Stocks list tonight. Volume-driven gains to new highs are needed for its technical stance to improve.
>>> The latest Featured Stock Update with an annotated graph appeared on 3/13/2013. Click here.
View all notes |
Alert me of new notes |
CANSLIM.net Company Profile |
SEC |
Zacks Reports |
StockTalk |
News |
Chart |
Request a new note
C
A N
S L
I M
|
Symbol/Exchange
Company Name
Industry Group |
PRICE |
CHANGE
(%Change) |
Day High |
Volume
(% DAV)
(% 50 day avg vol) |
52 Wk Hi
% From Hi |
Featured
Date |
Price
Featured |
Pivot Featured |
|
Max Buy |
MIDD
-
NASDAQ
Middleby Corp
MANUFACTURING - Diversified Machinery
|
$149.99
|
-0.21
-0.14% |
$153.16
|
126,053
129.68% of 50 DAV
50 DAV is 97,200
|
$154.74
-3.07%
|
10/8/2012
|
$118.46
|
PP = $122.67
|
|
MB = $128.80
|
Most Recent Note - 4/1/2013 6:13:43 PM
G - Recently staying in tight trading range near all-time highs, stubbornly holding its ground above its 50 DMA line. Fundamental concerns were recently noted.
>>> The latest Featured Stock Update with an annotated graph appeared on 3/25/2013. Click here.
View all notes |
Alert me of new notes |
CANSLIM.net Company Profile |
SEC |
Zacks Reports |
StockTalk |
News |
Chart |
Request a new note
C
A N
S L
I M
|
MNTX
-
NASDAQ
Manitex International
MANUFACTURING - Diversified Machinery
|
$11.73
|
-0.59
-4.79% |
$12.95
|
460,932
244.14% of 50 DAV
50 DAV is 188,800
|
$13.14
-10.73%
|
3/20/2013
|
$11.29
|
PP = $12.05
|
|
MB = $12.65
|
Most Recent Note - 4/2/2013 4:33:23 PM
Y - Ended in the lower part its intra-day range with a damaging loss on heavy volume indicating more worrisome distributional pressure. Disciplined investors avoid chasing extended stocks and always limit losses by selling if any stock falls more than -7% from their purchase price.
>>> The latest Featured Stock Update with an annotated graph appeared on 3/20/2013. Click here.
View all notes |
Alert me of new notes |
CANSLIM.net Company Profile |
SEC |
Zacks Reports |
StockTalk |
News |
Chart |
Request a new note
C
A N
S L
I M
|
MRLN
-
NASDAQ
Marlin Business Services
DIVERSIFIED SERVICES - Rental and Leasing Services
|
$22.75
|
-0.41
-1.77% |
$23.85
|
18,100
75.42% of 50 DAV
50 DAV is 24,000
|
$23.98
-5.13%
|
3/15/2013
|
$22.29
|
PP = $23.18
|
|
MB = $24.34
|
Most Recent Note - 3/28/2013 6:18:39 PM
Y - Volume was above average today after a "negative reversal" as it hit a new 52-week high and then finished lower on the session. The action was indicative of distributional pressure, rather than institutional accumulation. MRLN wedged higher with gains lacking great volume conviction since last noted on 3/25/13 with caution - "Subsequent volume-driven gains above the pivot point could help clinch a more convincing technical buy signal."
>>> The latest Featured Stock Update with an annotated graph appeared on 3/15/2013. Click here.
View all notes |
Alert me of new notes |
CANSLIM.net Company Profile |
SEC |
Zacks Reports |
StockTalk |
News |
Chart |
Request a new note
C
A N
S L
I M
|
MWIV
-
NASDAQ
M W I Veterinary Supply
HEALTH SERVICES - Medical Instruments and; Supplies
|
$131.33
|
-1.54
-1.16% |
$134.87
|
33,043
58.48% of 50 DAV
50 DAV is 56,500
|
$137.18
-4.26%
|
3/4/2013
|
$130.90
|
PP = $129.45
|
|
MB = $135.92
|
Most Recent Note - 3/28/2013 2:42:58 PM
Y - Still consolidating above its pivot point with volume totals cooling. Its 50 DMA line defines near-term support. Disciplined investors limit loses by selling if ever any stock fall more than -7% from their purchase price.
>>> The latest Featured Stock Update with an annotated graph appeared on 3/6/2013. Click here.
View all notes |
Alert me of new notes |
CANSLIM.net Company Profile |
SEC |
Zacks Reports |
StockTalk |
News |
Chart |
Request a new note
C
A N
S L
I M
|
N
-
NYSE
Netsuite Inc
DIVERSIFIED SERVICES - Business/Management Services
|
$78.88
|
-0.01
-0.01% |
$80.00
|
426,424
114.60% of 50 DAV
50 DAV is 372,100
|
$80.33
-1.81%
|
12/12/2012
|
$64.75
|
PP = $67.12
|
|
MB = $70.48
|
Most Recent Note - 4/1/2013 7:26:50 PM
G - Perched at 52-week and all-time highs after 7 consecutive weekly gains, extended from its prior base. See the latest FSU analysis for more details and a new annotated graph.
>>> The latest Featured Stock Update with an annotated graph appeared on 4/1/2013. Click here.
View all notes |
Alert me of new notes |
CANSLIM.net Company Profile |
SEC |
Zacks Reports |
StockTalk |
News |
Chart |
Request a new note
C
A N
S L
I M
|
Symbol/Exchange
Company Name
Industry Group |
PRICE |
CHANGE
(%Change) |
Day High |
Volume
(% DAV)
(% 50 day avg vol) |
52 Wk Hi
% From Hi |
Featured
Date |
Price
Featured |
Pivot Featured |
|
Max Buy |
NSR
-
NYSE
Neustar Inc
TELECOMMUNICATIONS - Diversified Communication Serv
|
$44.45
|
-0.58
-1.29% |
$45.32
|
574,969
125.79% of 50 DAV
50 DAV is 457,100
|
$47.24
-5.91%
|
3/8/2013
|
$44.99
|
PP = $47.34
|
|
MB = $49.71
|
Most Recent Note - 4/1/2013 12:20:43 PM
Y - Still consolidating near its 50 DMA line which has acted as support in recent weeks. Its Relative Strength rating has slumped to 77, below the 80+ minimum guideline for buy candidates.
>>> The latest Featured Stock Update with an annotated graph appeared on 3/27/2013. Click here.
View all notes |
Alert me of new notes |
CANSLIM.net Company Profile |
SEC |
Zacks Reports |
StockTalk |
News |
Chart |
Request a new note
C
A N
S L
I M
|
SLCA
-
NYSE
U S Silica Holdings Inc
CHEMICALS - Specialty Chemicals
|
$22.31
|
-0.63
-2.75% |
$23.73
|
1,315,497
120.31% of 50 DAV
50 DAV is 1,093,400
|
$28.50
-21.72%
|
2/26/2013
|
$22.23
|
PP = $21.50
|
|
MB = $22.58
|
Most Recent Note - 4/2/2013 4:42:04 PM
G - Fell on lighter (near average) volume today, consolidating above its 50 DMA line. Completed a Secondary Offering on 3/14/13. Previously noted - "Any violation of its 50 DMA line or recent low ($21.24 on 3/15/13) would raise concerns and trigger technical sell signals."
>>> The latest Featured Stock Update with an annotated graph appeared on 3/22/2013. Click here.
View all notes |
Alert me of new notes |
CANSLIM.net Company Profile |
SEC |
Zacks Reports |
StockTalk |
News |
Chart |
Request a new note
C
A N
S L
I M
|
VRX
-
NYSE
Valeant Pharmaceuticals
DRUGS - Drug Manufacturers - Other
|
$75.37
|
-0.68
-0.89% |
$76.56
|
1,958,238
156.91% of 50 DAV
50 DAV is 1,248,000
|
$76.44
-1.40%
|
12/20/2012
|
$60.24
|
PP = $61.21
|
|
MB = $64.27
|
Most Recent Note - 4/2/2013 1:19:23 PM
G - Still hovering near its all-time high today, extended from the secondary buy point noted earlier. The 50 DMA line and recent low ($64.05 on 2/21/13) define important support areas to watch on pullbacks.
>>> The latest Featured Stock Update with an annotated graph appeared on 3/12/2013. Click here.
View all notes |
Alert me of new notes |
CANSLIM.net Company Profile |
SEC |
Zacks Reports |
StockTalk |
News |
Chart |
Request a new note
C
A N
S L
I M
|
|
|
|
THESE ARE NOT BUY RECOMMENDATIONS!
Comments contained in the body of this report are technical
opinions only. The material herein has been obtained
from sources believed to be reliable and accurate, however,
its accuracy and completeness cannot be guaranteed.
This site is not an investment advisor, hence it does
not endorse or recommend any securities or other investments.
Any recommendation contained in this report may not
be suitable for all investors and it is not to be deemed
an offer or solicitation on our part with respect to
the purchase or sale of any securities. All trademarks,
service marks and trade names appearing in this report
are the property of their respective owners, and are
likewise used for identification purposes only.
This report is a service available
only to active Paid Premium Members.
You may opt-out of receiving report notifications
at any time. Questions or comments may be submitted
by writing to Premium Membership Services 665 S.E. 10 Street, Suite 201 Deerfield Beach, FL 33441-5634 or by calling 1-800-965-8307
or 954-785-1121.
|
|
|

