You are not logged in.
This means you
CAN ONLY VIEW reports that were published prior to Monday, February 26, 2024.
You
MUST UPGRADE YOUR MEMBERSHIP if you want to see any current reports.
AFTER MARKET UPDATE - FRIDAY, APRIL 1ST, 2022
Previous After Market Report Next After Market Report >>>
|
|
|
|
DOW |
+139.92 |
34,818.27 |
+0.40% |
|
Volume |
995,807,410 |
-16% |
|
Volume |
4,974,268,700 |
-7% |
|
NASDAQ |
+40.98 |
14,261.50 |
+0.29% |
|
Advancers |
2,097 |
65% |
|
Advancers |
2,577 |
59% |
|
S&P 500 |
+15.45 |
4,545.86 |
+0.34% |
|
Decliners |
1,133 |
35% |
|
Decliners |
1,755 |
41% |
|
Russell 2000 |
+20.99 |
2,091.11 |
+1.01% |
|
52 Wk Highs |
111 |
|
|
52 Wk Highs |
75 |
|
|
S&P 600 |
+12.80 |
1,331.34 |
+0.97% |
|
52 Wk Lows |
76 |
|
|
52 Wk Lows |
130 |
|
|
 |
Major Indices Ended Higher With Lighter Volume Totals
Kenneth J. Gruneisen - Passed the CAN SLIM® Master's Exam
The S&P 500 and Nasdaq Composite each rose 0.3%, enough to help the two indexes string together a three-week winning streak for the first time since November 5. The broad benchmark ended the week less than 0.1% higher, while the tech-heavy Nasdaq capped a 0.7% weekly gain. The Dow added 139 points, paring its five-day decline to just 0.1%. All three major averages just weathered their worst quarterly performance since 2020 despite robust monthly gains. Volume totals reported were lighter than the prior session on the NYSE and on the Nasdaq exchange. Breadth was positive as advancers led decliners by almost a 2-1 margin on the NYSE and 4-3 on the Nasdaq exchange. There were 29 high-ranked companies from the Leaders List that hit new 52-week highs and were listed on the BreakOuts Page, versus the total of 46 on the prior session. New 52-week highs totals outnumbered new 52-week lows totals on the NYSE, but again new lows outnumbered new highs on the Nasdaq exchange. The recently noted follow-through day confirmed a new uptrend (M criteria). Strict followers of the fact-based investment system only buy stocks fitting all key fundamental and technical investment criteria.
Chart courtesy of www.stockcharts.com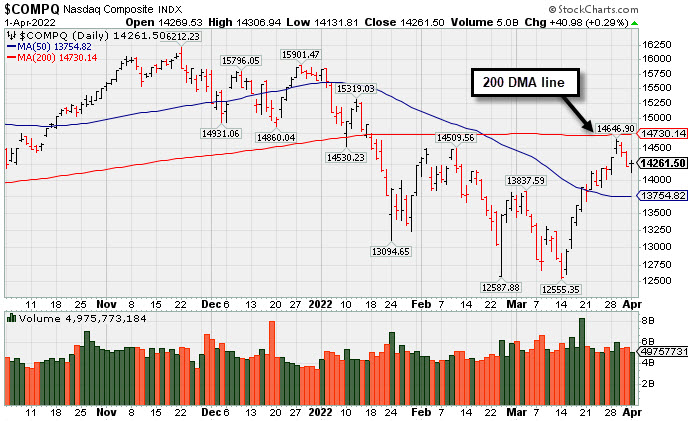 PICTURED: The Nasdaq Composite Index finished higher on Friday with lighter volume. It met resistance recently near its 200-day moving average (DMA) line. Subsequent gains above the 200 DMA line would be a reassuring bullish sign, meanwhile, any deterioration becomes increasing worrisome for the market outlook.
U.S. stocks turned higher on Friday despite some concerns on Wall Street around an inverting Treasury yield curve following an upbeat monthly jobs report. On the data front, non-farm payrolls increased by 431,000 in March, modestly below estimates of a 490,000 gain, though headline numbers from the prior two months were upwardly revised. The unemployment rate fell to a fresh pandemic-low of 3.6%, while wage inflation jumped a larger-than-projected 5.6% year-over-year. Separately, an update from the Institute for Supply Management (ISM) revealed U.S. manufacturing growth unexpectedly decelerated in March. The prices paid component reflected the largest monthly increase since December 2020.
Shorter-term Treasuries were pressured as the solid jobs report bolstered the case for more aggressive monetary policy tightening by the Federal Reserve (Fed). The more Fed-sensitive two-year note yield spiked 14 basis points (0.14%) to 2.45%, eclipsing the yields on both the longer-dated 10-year note and 30-year bond (2.37% and 2.42%, respectively). In commodities, West Texas Intermediate crude suffered its worst week since April 2020, sliding 12.6% to $99.54/barrel.
|
 Kenneth J. Gruneisen started out as a licensed stockbroker in August 1987, a couple of months prior to the historic stock market crash that took the Dow Jones Industrial Average down -22.6% in a single day. He has published daily fact-based fundamental and technical analysis on high-ranked stocks online for two decades. Through FACTBASEDINVESTING.COM, Kenneth provides educational articles, news, market commentary, and other information regarding proven investment systems that work in good times and bad.
Comments contained in the body of this report are technical opinions only and are not necessarily those of Gruneisen Growth Corp. The material herein has been obtained from sources believed to be reliable and accurate, however, its accuracy and completeness cannot be guaranteed. Our firm, employees, and customers may effect transactions, including transactions contrary to any recommendation herein, or have positions in the securities mentioned herein or options with respect thereto. Any recommendation contained in this report may not be suitable for all investors and it is not to be deemed an offer or solicitation on our part with respect to the purchase or sale of any securities. |
|
 |
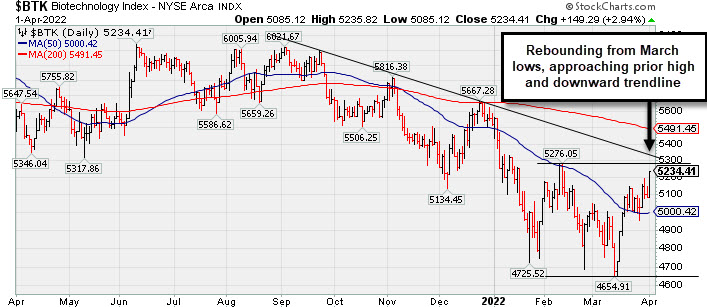
Commodity-Linked Groups and Biotech Index Led Gainers
Kenneth J. Gruneisen - Passed the CAN SLIM® Master's Exam
The tech sector was mixed as the Biotech Index ($BTK +2.94%) posted a solid gain, the Networking Index ($NWX +0.04%) finished flat, and the Semiconductor Index ($SOX -1.82%) lost ground. Commodity-linked groups had a positive bias as the Gold & Silver Index ($XAU +3.01%) outpaced the Oil Services Index ($OSX +2.21%) and Integrated Oil Index ($XOI +0.96%). The Bank Index ($BKX -1.26%) lost ground while the Broker/Dealer Index ($XBD +0.22%) and Retail Index ($RLX +0.20%) each posted a small gain. PICTURED: The Biotech Index ($BTK +2.94%) is rebounding from March lows, approaching its February high and a multi-month downward trendline.
| Oil Services |
$OSX |
81.72 |
+1.77 |
+2.21% |
+55.02% |
| Integrated Oil |
$XOI |
1,589.96 |
+15.11 |
+0.96% |
+34.95% |
| Semiconductor |
$SOX |
3,366.64 |
-62.36 |
-1.82% |
-14.69% |
| Networking |
$NWX |
893.69 |
+0.32 |
+0.04% |
-7.97% |
| Broker/Dealer |
$XBD |
469.85 |
+1.01 |
+0.22% |
-3.49% |
| Retail |
$RLX |
3,809.63 |
+7.60 |
+0.20% |
-9.86% |
| Gold & Silver |
$XAU |
163.20 |
+4.77 |
+3.01% |
+23.21% |
| Bank |
$BKX |
122.58 |
-1.56 |
-1.26% |
-7.29% |
| Biotech |
$BTK |
5,234.41 |
+149.29 |
+2.94% |
-5.15% |
|
|
|
 |
Featured Stocks
Kenneth J. Gruneisen - Passed the CAN SLIM® Master's Exam
|
|
|
Color Codes Explained :
Y - Better candidates highlighted by our
staff of experts.
G - Previously featured
in past reports as yellow but may no longer be buyable under the
guidelines.
***Last / Change / Volume data in this table is the closing quote data***
Symbol/Exchange
Company Name
Industry Group |
PRICE |
CHANGE
(%Change) |
Day High |
Volume
(% DAV)
(% 50 day avg vol) |
52 Wk Hi
% From Hi |
Featured
Date |
Price
Featured |
Pivot Featured |
|
Max Buy |
 REGN
-
NASDAQ
REGN
-
NASDAQ
Regeneron Pharmaceutical
DRUGS - Biotechnology
|
$694.83
|
-3.59
-0.51% |
$701.95
|
603,470
79.93% of 50 DAV
50 DAV is 755,000
|
$710.21
-2.17%
|
3/14/2022
|
$647.95
|
PP = $673.96
|
|
MB = $707.66
|
 Most Recent Note - 4/1/2022 12:54:37 PM
Y - Hit a new all-time high with Thursday's noted gain backed by +41% above average volume. Remains below the "max buy" level. Its 50 DMA line ($638.50) defines important near-term support to watch on pullbacks.
>>> FEATURED STOCK ARTICLE : 6th Straight Gain Leaves Regeneron Near Record High - 3/16/2022 |
View all notes |
Set NEW NOTE alert |
Company Profile |
SEC
News |
Chart |
Request a new note
C
A
S
I |
TGH
-
NYSE
Textainer Group Holdings
TRANSPORTATION - Logistics
|
$38.49
|
+0.42
1.10% |
$38.98
|
305,563
65.71% of 50 DAV
50 DAV is 465,000
|
$41.89
-8.12%
|
1/31/2022
|
$36.68
|
PP = $41.34
|
|
MB = $43.41
|
Most Recent Note - 4/1/2022 12:56:07 PM
Y - Hovering within close striking distance of its all-time high, consolidating above its 50 DMA line ($37.77). Any violations would raise serious concerns and trigger technical sell signals. Fundamentals remain strong.
>>> FEATURED STOCK ARTICLE : Recently Perched Within Striking Distance of Prior Highs - 3/30/2022 |
View all notes |
Set NEW NOTE alert |
Company Profile |
SEC
News |
Chart |
Request a new note
C
A
S
I |
HWKN
-
NASDAQ
Hawkins Inc
CHEMICALS - Basic Chemicals
|
$45.70
|
-0.20
-0.44% |
$46.36
|
110,299
147.07% of 50 DAV
50 DAV is 75,000
|
$48.12
-5.03%
|
2/3/2022
|
$39.81
|
PP = $41.07
|
|
MB = $43.12
|
Most Recent Note - 4/1/2022 12:51:03 PM
G - Sputtering after a "negative reversal" at its all-time high this week. It has been noted as extended from the previously noted base, with its 50 DMA line ($42.98) defining near-term support to watch.
>>> FEATURED STOCK ARTICLE : Hovering Near High After Rising From Prior Base - 3/15/2022 |
View all notes |
Set NEW NOTE alert |
Company Profile |
SEC
News |
Chart |
Request a new note
C
A
S
I |
IMXI
-
NASDAQ
International Money Exp
Financial Svcs-Specialty
|
$21.01
|
+0.40
1.94% |
$21.11
|
323,549
96.58% of 50 DAV
50 DAV is 335,000
|
$21.98
-4.41%
|
3/8/2022
|
$18.64
|
PP = $19.06
|
|
MB = $20.01
|
Most Recent Note - 4/1/2022 12:52:45 PM
G - Consolidating in a very tight range, stubbornly holding its ground. Prior highs in the high $18 area define initial support to watch.
>>> FEATURED STOCK ARTICLE : Holding Ground After Rallying From Prior Base - 3/24/2022 |
View all notes |
Set NEW NOTE alert |
Company Profile |
SEC
News |
Chart |
Request a new note
C
A
S
I |
|
|
|
THESE ARE NOT BUY RECOMMENDATIONS!
Comments contained in the body of this report are technical
opinions only. The material herein has been obtained
from sources believed to be reliable and accurate, however,
its accuracy and completeness cannot be guaranteed.
This site is not an investment advisor, hence it does
not endorse or recommend any securities or other investments.
Any recommendation contained in this report may not
be suitable for all investors and it is not to be deemed
an offer or solicitation on our part with respect to
the purchase or sale of any securities. All trademarks,
service marks and trade names appearing in this report
are the property of their respective owners, and are
likewise used for identification purposes only.
This report is a service available
only to active Paid Premium Members.
You may opt-out of receiving report notifications
at any time. Questions or comments may be submitted
by writing to Premium Membership Services 665 S.E. 10 Street, Suite 201 Deerfield Beach, FL 33441-5634 or by calling 1-800-965-8307
or 954-785-1121.
|
|
|