You are not logged in.
This means you
CAN ONLY VIEW reports that were published prior to Monday, February 26, 2024.
You
MUST UPGRADE YOUR MEMBERSHIP if you want to see any current reports.
AFTER MARKET UPDATE - WEDNESDAY, APRIL 1ST, 2020
Previous After Market Report Next After Market Report >>>
|
|
|
|
DOW |
-973.65 |
20,943.51 |
-4.44% |
|
Volume |
1,299,523,492 |
-26% |
|
Volume |
3,686,466,800 |
-9% |
|
NASDAQ |
-339.52 |
7,360.58 |
-4.41% |
|
Advancers |
214 |
7% |
|
Advancers |
475 |
14% |
|
S&P 500 |
-114.09 |
2,470.50 |
-4.41% |
|
Decliners |
2,728 |
93% |
|
Decliners |
2,820 |
86% |
|
Russell 2000 |
-81.11 |
1,071.99 |
-7.03% |
|
52 Wk Highs |
3 |
|
|
52 Wk Highs |
14 |
|
|
S&P 600 |
-49.18 |
635.66 |
-7.18% |
|
52 Wk Lows |
116 |
|
|
52 Wk Lows |
83 |
|
|
During market corrections it is especially important to reduce exposure, preserve your capital, and just be patient. Be safe! Historic studies have shown that the biggest up sessions have occurred during market corrections and bear markets.
Disciplined investors know to wait until a new confirmed rally marked by a solid follow-through day. The bold portion of the daily market commentary will note when that happens. For any clarification or additional help applying the fact-based investment system, we invite members to call, or contact us via the inquiry form.
|
 |
Leadership Lacking and Breadth Negative as Major Indices Sink
Kenneth J. Gruneisen - Passed the CAN SLIM® Master's Exam
The Dow fell 973 points for its third daily decline in the past four trading sessions. The S&P 500 lost 4.4%, its largest drawdown in two-weeks. The Nasdaq Composite also slipped 4.4%. Wednesday's breadth was negative as decliners led advancers by more than a 12-1 margin on the NYSE and nearly 6-1 on the Nasdaq exchange. The reported volume totals were lighter than the prior session totals on the NYSE and on the Nasdaq exchange, indicative of less selling conviction coming from large institutional investors. Leadership remained thin as only 1 high-ranked company from the Leaders List hit new 52-week highs and was listed on the BreakOuts Page, versus 2 on the prior session. New 52-week lows totals still outnumbered the small new 52-week highs totals on both the NYSE and on the Nasdaq exchange. The major indices' (M criteria) have been in a noted "market correction" and investors have been prompted since February 25th to reduce market exposure. Charts used courtesy of www.stockcharts.com
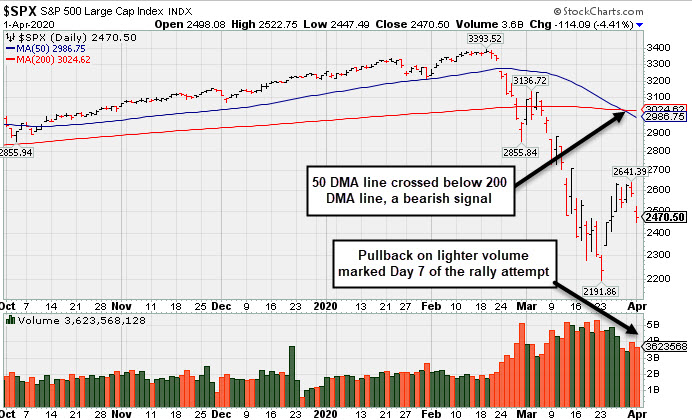
PICTURED: The S&P 500 Index pulled back with slightly lower volume marking Day 7 of the new rally attempt. Disciplined investors know before initiating any new buying efforts to watch for a follow-through day of big confirming gains from the major indices on higher volume coupled with an increase in the number of stocks hitting new highs to signal a valid new market uptrend (M criteria). Confirmation days that come after Day 7 could be worrisome signs of a weaker and less productive market rally. Remember that any sustainable rally requires a healthy crop of new leaders.
Stocks finished firmly lower Wednesday, on the heels of the worst quarter for global equities in 12 years. President Trump cautioned Americans of the upcoming two weeks that could prove “painful” despite social distancing measures, as the country may see a death count up to 240,000. Meanwhile, Investors grappled with the possibility of a prolonged economic shutdown weighing on corporate profits and dividends.
All 11 S&P 500 sectors ended the session in negative territory, with Financials, Utilities, and Real Estate all sinking roughly 6%. Airlines also underperformed with United Airlines (UAL -18.7%) and Delta Airlines (DAL -16.33%) tumbling. Elsewhere, Consumer Staples outperformed on a relative basis with Walmart (WMT +0.46%) being the only company in the Dow 30 to buck the downtrend.
On the data front, a report from the ISM showed U.S. manufacturing activity edged into contractionary territory in March, though the PMI figure came in at 49.1, better than the forecasted 44.5 print. A separate gauge from research firm IHS Markit also indicated the sector contracted by less than anticipated last month. Additionally, Automated Date Processing (ADP -5.09%) revealed private payrolls shrank 27,000, the figures first contraction since 2008. Treasuries extended their March rally, with the yield on the 10-year note dropping five basis points to 0.62%. In commodities, gold gained 0.5% to $1,591.80/ounce, while WTI Crude added 2.2% to 20.93/barrel despite fears of oversupply.
|
 Kenneth J. Gruneisen started out as a licensed stockbroker in August 1987, a couple of months prior to the historic stock market crash that took the Dow Jones Industrial Average down -22.6% in a single day. He has published daily fact-based fundamental and technical analysis on high-ranked stocks online for two decades. Through FACTBASEDINVESTING.COM, Kenneth provides educational articles, news, market commentary, and other information regarding proven investment systems that work in good times and bad.
Comments contained in the body of this report are technical opinions only and are not necessarily those of Gruneisen Growth Corp. The material herein has been obtained from sources believed to be reliable and accurate, however, its accuracy and completeness cannot be guaranteed. Our firm, employees, and customers may effect transactions, including transactions contrary to any recommendation herein, or have positions in the securities mentioned herein or options with respect thereto. Any recommendation contained in this report may not be suitable for all investors and it is not to be deemed an offer or solicitation on our part with respect to the purchase or sale of any securities. |
|
 |
Financial, Energy, Tech, and Retail Indices Fell
Kenneth J. Gruneisen - Passed the CAN SLIM® Master's Exam
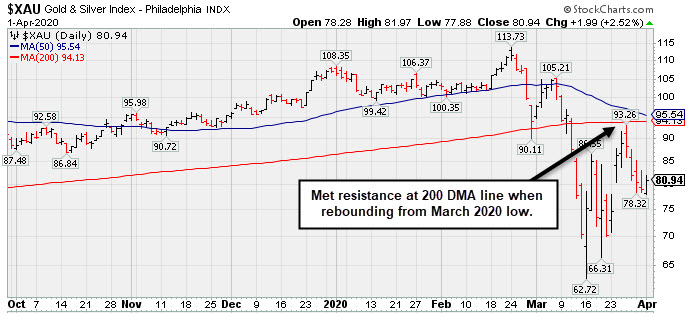
The Bank Index ($BKX -6.90%) and Broker/Dealer Index ($XBD -4.16%) both outpaced the Retail Index ($RLX -3.14%),to the downside on Wednesday. The tech sector was unanimously negative as the Semiconductor Index ($SOX -5.49%), Networking Index ($NWX -4.46%) and the Biotech Index ($BTK -3.12%) each lost considerable ground. Commodity-linked groups were mixed as the Gold & Silver Index ($XAU +2.52%) posted a standout gain, meanwhile the Oil Services Index ($OSX -5.65%) and the Integrated Oil Index ($XOI -4.01%) both suffered large losses.
PICTURED: The Gold & Silver Index ($XAU +2.52%) remains below its 200-day moving average (DMA) line which acted as resistance when recently rebounding from the March 2020 low..
| Oil Services |
$OSX |
23.33 |
-1.40 |
-5.66% |
-70.20% |
| Integrated Oil |
$XOI |
597.33 |
-24.93 |
-4.01% |
-52.99% |
| Semiconductor |
$SOX |
1,427.73 |
-82.86 |
-5.49% |
-22.81% |
| Networking |
$NWX |
438.30 |
-20.48 |
-4.46% |
-24.87% |
| Broker/Dealer |
$XBD |
204.93 |
-8.91 |
-4.16% |
-29.43% |
| Retail |
$RLX |
2,119.36 |
-68.60 |
-3.14% |
-13.47% |
| Gold & Silver |
$XAU |
80.94 |
+1.99 |
+2.52% |
-24.30% |
| Bank |
$BKX |
60.93 |
-4.52 |
-6.91% |
-46.25% |
| Biotech |
$BTK |
4,332.20 |
-139.42 |
-3.12% |
-14.51% |
|
|
|
 |
No Featured Stocks
Kenneth J. Gruneisen - Passed the CAN SLIM® Master's Exam
During extremely bearish markets the number of stocks covered in this area has sometimes been reduced to zero. We suggest making no excuses for weak stocks in weak markets. Feel free to contact us if you have a need for any additional information. |
|
|
Color Codes Explained :
Y - Better candidates highlighted by our
staff of experts.
G - Previously featured
in past reports as yellow but may no longer be buyable under the
guidelines.
***Last / Change / Volume data in this table is the closing quote data***
|
|
|
THESE ARE NOT BUY RECOMMENDATIONS!
Comments contained in the body of this report are technical
opinions only. The material herein has been obtained
from sources believed to be reliable and accurate, however,
its accuracy and completeness cannot be guaranteed.
This site is not an investment advisor, hence it does
not endorse or recommend any securities or other investments.
Any recommendation contained in this report may not
be suitable for all investors and it is not to be deemed
an offer or solicitation on our part with respect to
the purchase or sale of any securities. All trademarks,
service marks and trade names appearing in this report
are the property of their respective owners, and are
likewise used for identification purposes only.
This report is a service available
only to active Paid Premium Members.
You may opt-out of receiving report notifications
at any time. Questions or comments may be submitted
by writing to Premium Membership Services 665 S.E. 10 Street, Suite 201 Deerfield Beach, FL 33441-5634 or by calling 1-800-965-8307
or 954-785-1121.
|
|
|