You are not logged in.
This means you
CAN ONLY VIEW reports that were published prior to Monday, April 14, 2025.
You
MUST UPGRADE YOUR MEMBERSHIP if you want to see any current reports.
AFTER MARKET UPDATE - WEDNESDAY, MARCH 31ST, 2010
Previous After Market Report Next After Market Report >>>
|
|
|
|
DOW |
-50.79 |
10,856.63 |
-0.47% |
|
Volume |
1,152,473,010 |
+27% |
|
Volume |
2,475,775,130 |
+19% |
|
NASDAQ |
-12.73 |
2,397.96 |
-0.53% |
|
Advancers |
1,210 |
38% |
|
Advancers |
1,014 |
36% |
|
S&P 500 |
-3.84 |
1,169.43 |
-0.33% |
|
Decliners |
1,817 |
58% |
|
Decliners |
1,687 |
60% |
|
Russell 2000 |
-5.30 |
678.64 |
-0.77% |
|
52 Wk Highs |
175 |
|
|
52 Wk Highs |
109 |
|
|
S&P 600 |
-3.32 |
360.30 |
-0.91% |
|
52 Wk Lows |
5 |
|
|
52 Wk Lows |
16 |
|
|
 |
Indices Encounter Mild Distribution While Ending First Quarter Up
Adam Sarhan, Contributing Writer,
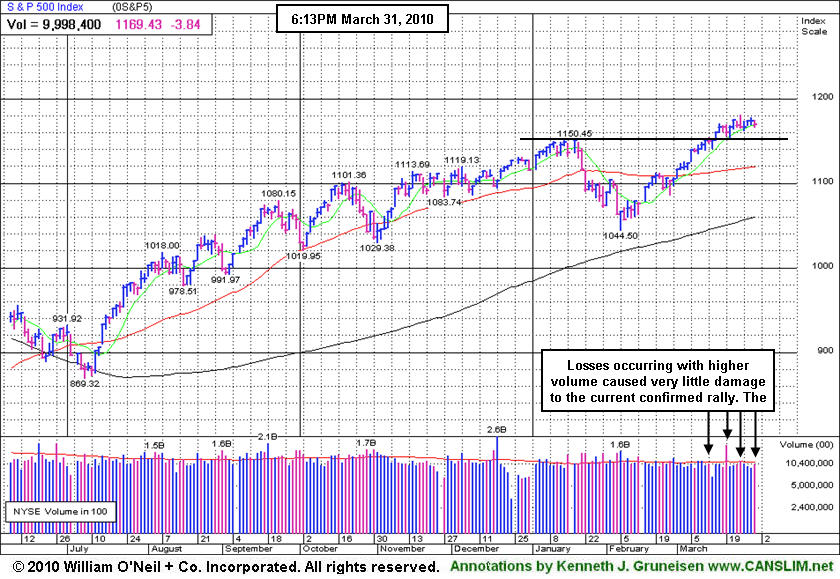
Stocks have tallied modest gains for the year thus far as investors look past the Greek woes and remain optimistic about the economic recovery. The major averages ended lower on Wednesday as the first quarter of 2010 came to a close. Volume totals on the NYSE and on the Nasdaq exchange were reported higher compared to Tuesday's session, which marked another mild distribution day. Breadth was not especially negative, but decliners led advancers by about a 3-to-2 ratio on the NYSE and on the Nasdaq exchange. New 52-week highs outnumbered new lows on both exchanges yet again, however only 16 high-ranked companies from the CANSLIM.net Leaders List made a new 52-week high and appeared on the CANSLIM.net BreakOuts Page, lower than the 44 issues that appeared on the prior session.
Before Wednesday's opening bell, ADP, the country's largest private payrolls company, said US employers slashed -23,000 jobs in March which fell short of the Street's +40,000 estimate. Elsewhere, the Chicago PMI index grew to 58.8 but fell short of the Street's more robust 61 forecast. A separate report showed that factory orders grew +0.6% as the economy continues to improve.
The benchmark S&P 500 Index currently has 4 distribution days while the Nasdaq Composite and Dow Jones Industrial Average have 3 since the March 1, 2010 follow-though-day (FTD). These distribution days have not been damaging, and normally it is considered healthy for the major averages to have less than 4 distribution days in a four week period. It is also a welcome sign to see the market continue to improve as investors digest the latest round of stronger than expected economic and earnings data. Remember that now that a new rally has been confirmed, the window is open to proactively be buying high quality breakouts meeting the investment system guidelines. Trade accordingly.
First Quarter 2010 Webcast (AVAILABLE "ON DEMAND" NOW)
Don't miss your opportunity to view CANSLIM.net's Q1 2010 Webcast - Available free of charge now to all active StockNews (pay premium) members! The link to access the webcast is posted at the top of the white portion of the Premium Membership Homepage (click here). You may take advantage of the SPRING SPECIAL to reactivate an expired membership, start a new membership, or upgrade from your free membership level so you can access this informative webcast.
PICTURED: The S&P 500 Index's losses occurring with higher volume have caused very little damage to the current confirmed rally. The benchmark index is consolidating above prior chart highs.
|
|
|
 |
Semiconductor Index Encountering Resistance Near Prior Highs
Kenneth J. Gruneisen - Passed the CAN SLIM® Master's Exam
Commodity-linked groups traded with a positive bias as the Gold & Silver Index ($XAU +0.95%), Oil Services Index ($OSX +1.09%), and Integrated Oil Index ($XOI +0.46%) posted modest gains. Financial shares were mixed as the Broker/Dealer Index ($XBD -0.95%) fell and the Bank Index ($BKX +0.48%) posted a small gain. The Healthcare Index ($HMO -0.71%) and Retail Index ($RLX -0.82%) slumped, and the tech sector had a negative bias as the Biotechnology Index ($BTK -1.10%), Networking Index ($NWX -1.02%), Semiconductor Index ($SOX -0.63%), and Internet Index ($IIX -0.45%) ended Wednesday's session unanimously lower.
Charts courtesy www.stockcharts.com

PICTURED: The Semiconductor Index ($SOX -0.63%) has recently been encountering resistance near prior chart highs.
| Oil Services |
$OSX |
205.97 |
+2.22 |
+1.09% |
+5.67% |
| Healthcare |
$HMO |
1,575.01 |
-11.19 |
-0.71% |
+6.93% |
| Integrated Oil |
$XOI |
1,081.20 |
+4.94 |
+0.46% |
+1.22% |
| Semiconductor |
$SOX |
366.57 |
-2.33 |
-0.63% |
+1.85% |
| Networking |
$NWX |
255.09 |
-2.64 |
-1.02% |
+10.40% |
| Internet |
$IIX |
248.18 |
-1.11 |
-0.45% |
+6.12% |
| Broker/Dealer |
$XBD |
116.65 |
-1.12 |
-0.95% |
+1.39% |
| Retail |
$RLX |
449.79 |
-3.73 |
-0.82% |
+9.41% |
| Gold & Silver |
$XAU |
165.28 |
+1.56 |
+0.95% |
-1.77% |
| Bank |
$BKX |
52.00 |
+0.25 |
+0.48% |
+21.75% |
| Biotech |
$BTK |
1,227.55 |
-13.65 |
-1.10% |
+30.30% |
|
|
|
 |
New High Today For Networking Firm Posting 5th Straight Gain
Kenneth J. Gruneisen - Passed the CAN SLIM® Master's Exam
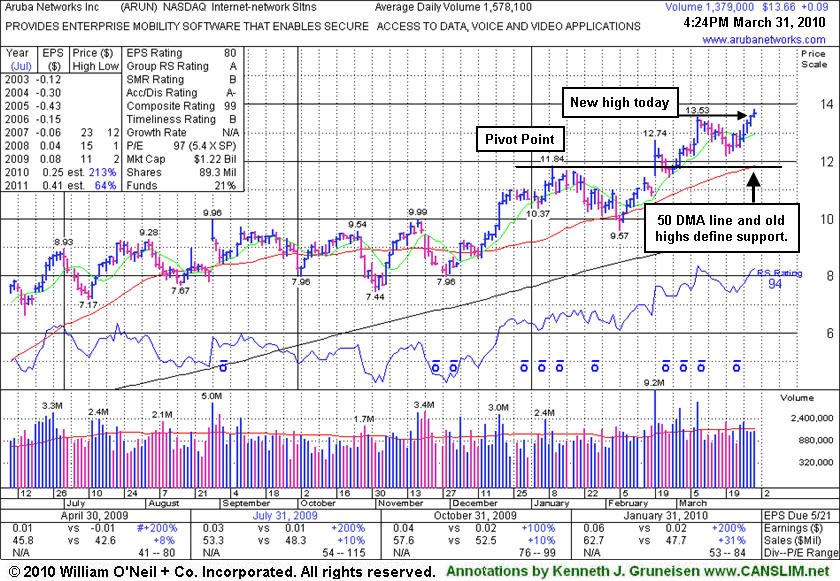
Aruba Networks Inc. (ARUN +$0.09 or +0.66% to $13.66) rallied today on near average volume for its 5th consecutive gain and a new 52-week high. It is extended from its prior base, and disciplined investors would avoid chasing it and wait for another ideal entry point within the investment system's guidelines. Support to watch is defined by prior chart highs and its 50-day moving average (DMA) line in the upper $11 area. It was first featured in yellow on 2/19/10 in the mid-day report with a note that it - "Gapped up today for a considerable gain and new 52 week high, rising from a flat base-on-base pattern" (read here).
Some of the strong technical action recently was an immediate response to its improving fundamentals. Its current quarterly earnings (C criteria) increases have been above the +25% minimum guideline and earnings in recent years followed prior annual losses. The quarter ended Dec 31, 2009 also showed a more impressive +30% sales revenues increase continuing its acceleration. The number of top-rated funds owning an interest in its shares rose from 45 in Mar '09 to 82 in Dec '09 providing a nice reassurance with respect to the investment system's I criteria. Return On Equity reported at 6% is below the 17% guideline, leaving some concerns. However, management's 26% ownership interest keeps the directors' focus on maintaining and growing shareholder value.
|
|
|
Color Codes Explained :
Y - Better candidates highlighted by our
staff of experts.
G - Previously featured
in past reports as yellow but may no longer be buyable under the
guidelines.
***Last / Change / Volume quote data in this table corresponds with the timestamp on the note***
Symbol/Exchange
Company Name
Industry Group |
Last |
Chg. |
Vol
% DAV |
Date Featured |
Price Featured |
Latest Pivot Point
Featured |
Status |
| Latest Max Buy Price |
ARUN
- NASDAQ
Aruba Networks Inc
COMPUTER HARDWARE - Networking & Communication Dev
|
$13.66
|
+0.09
|
1,468,717
94% DAV
1,569,200
|
2/19/2010
(Date
Featured) |
$12.71
(Price
Featured) |
PP = $11.94 |
G |
| MB = $12.54 |
Most Recent Note - 3/31/2010 5:22:03 PM
G - Rallied today with near average volume for its 5th consecutive gain and a new 52-week high. Support to watch is defined by prior chart highs and its 50 DMA line in the upper $11 area.
>>> The latest Featured Stock Update with an annotated graph appeared on 3/31/2010. click here.
|
|
C
A
S
I |
News |
Chart |
SEC
View all notes Alert
me of new notes
Company
Profile
|
BIDU
- NASDAQ
Baidu Inc Ads
INTERNET - Internet Information Providers
|
$597.00
|
-1.20
|
659,230
35% DAV
1,867,300
|
1/13/2010
(Date
Featured) |
$431.25
(Price
Featured) |
PP = $426.75 |
G |
| MB = $448.09 |
Most Recent Note - 3/31/2010 5:23:04 PM
G - Small loss today on very light volume, still quietly hovering near all-time highs. As recently noted, "It is extended from any sound base now. An upward trendline connecting its January-March lows is an initial chart support level to watch, where a subsequent violation may prompt investors to lock in gains."
>>> The latest Featured Stock Update with an annotated graph appeared on 3/24/2010. click here.
|
|
C
A
S
I |
News |
Chart |
SEC
View all notes Alert
me of new notes
Company
Profile
|
BRLI
- NASDAQ
Bio Reference Labs Inc
HEALTH SERVICES - Medical Laboratories & Researc
|
$43.97
|
-0.19
|
83,088
84% DAV
98,400
|
2/12/2010
(Date
Featured) |
$39.02
(Price
Featured) |
PP = $40.97 |
G |
| MB = $43.02 |
Most Recent Note - 3/31/2010 5:25:04 PM
G - This high-ranked Medical/Dental Services firm is consolidating above its "max buy" level. Prior chart highs and its 50 DMA line coincide in the $40 area, defining important support to watch.
>>> The latest Featured Stock Update with an annotated graph appeared on 3/22/2010. click here.
|
|
C
A
S
I |
News |
Chart |
SEC
View all notes Alert
me of new notes
Company
Profile
|
CISG
- NASDAQ
Cninsure Inc Ads
INSURANCE - Insurance Brokers
|
$26.61
|
-0.32
|
169,138
74% DAV
228,900
|
3/3/2010
(Date
Featured) |
$24.38
(Price
Featured) |
PP = $23.10 |
G |
| MB = $24.26 |
Most Recent Note - 3/31/2010 5:29:29 PM
G - Holding its ground today in a very tight trading range near its 52-week high. Volume totals have been cooling since its considerable gain on 3/23/10 with 3 times average volume. Extended from a sound base, yet no overhead supply remains to act as resistance. It rose from a 20-week double bottom base with 8 times average volume as it was featured in the 3/03/10 mid-day report (read here).
>>> The latest Featured Stock Update with an annotated graph appeared on 3/23/2010. click here.
|
|
C
A
S
I |
News |
Chart |
SEC
View all notes Alert
me of new notes
Company
Profile
|
CRM
- NYSE
Salesforce.com Inc
INTERNET - Internet Software & Services
|
$74.45
|
-0.96
|
1,136,664
62% DAV
1,820,600
|
3/5/2010
(Date
Featured) |
$72.28
(Price
Featured) |
PP = $75.53 |
Y |
| MB = $79.31 |
Most Recent Note - 3/31/2010 5:31:49 PM
Y - Loss today with light volume, closing below its pivot point and yet only -4.5% from its all-time high. A solid gain above its pivot point with at least +50% above average volume is required to trigger a technical buy signal.
>>> The latest Featured Stock Update with an annotated graph appeared on 3/25/2010. click here.
|
|
C
A
S
I |
News |
Chart |
SEC
View all notes Alert
me of new notes
Company
Profile
|
CTRP
- NASDAQ
Ctrip.com Intl Ltd Adr
LEISURE - Resorts & Casinos
|
$39.20
|
-1.48
|
1,617,042
74% DAV
2,191,800
|
3/25/2010
(Date
Featured) |
$40.74
(Price
Featured) |
PP = $39.40 |
Y |
| MB = $41.37 |
Most Recent Note - 3/31/2010 5:35:30 PM
Y - Gapped down for a small loss today on below average volume. It has stalled since its 3/25/10 gain for a new 52-week high with +81% above average volume triggered a technical buy signal. Recently found prompt support near its 50 DMA line. A detailed new Stock Bulletin with annotated graph and expert analysis was published on 3/25/10 (read here).
>>> The latest Featured Stock Update with an annotated graph appeared on 3/25/2010. click here.
|
|
C
A
S
I |
News |
Chart |
SEC
View all notes Alert
me of new notes
Company
Profile
|
EZPW
- NASDAQ
Ezcorp Inc Cl A
SPECIALTY RETAIL - Specialty Retail, Other
|
$20.60
|
-0.19
|
470,244
87% DAV
543,300
|
2/19/2010
(Date
Featured) |
$19.03
(Price
Featured) |
PP = $18.80 |
G |
| MB = $19.74 |
Most Recent Note - 3/31/2010 5:38:54 PM
G - Small loss today, still quietly consolidating above its 50 DMA line and its recent chart low ($19.73 on 3/16/10) which define near-term support. This high-ranked Finance - Consumer/Commercial Loans firm is only -7.2% from its all-time high and has no overhead supply to act as resistance.
>>> The latest Featured Stock Update with an annotated graph appeared on 3/29/2010. click here.
|
|
C
A
S
I |
News |
Chart |
SEC
View all notes Alert
me of new notes
Company
Profile
|
GMCR
- NASDAQ
Green Mtn Coffee Roastrs
FOOD & BEVERAGE - Processed & Packaged Goods
|
$96.87
|
+3.01
|
1,724,667
142% DAV
1,211,900
|
2/26/2010
(Date
Featured) |
$84.39
(Price
Featured) |
PP = $88.75 |
G |
| MB = $93.19 |
Most Recent Note - 3/31/2010 5:41:17 PM
G - Gain today with above average volume helped it hit a new all-time high. Initial support to watch is at prior chart highs and its 50 DMA line in the $86-88 area.
>>> The latest Featured Stock Update with an annotated graph appeared on 3/12/2010. click here.
|
|
C
A
S
I |
News |
Chart |
SEC
View all notes Alert
me of new notes
Company
Profile
|
ISRG
- NASDAQ
Intuitive Surgical Inc
HEALTH SERVICES - Medical Appliances & Equipment
|
$348.13
|
-0.78
|
270,280
51% DAV
535,100
|
1/22/2010
(Date
Featured) |
$340.40
(Price
Featured) |
PP = $314.00 |
G |
| MB = $329.70 |
Most Recent Note - 3/31/2010 5:42:19 PM
G - Making a stand this week near prior chart highs ($346) and its 50 DMA line - important support levels to watch. As previously repeated in notes, it did not trigger a technical buy signal in recent weeks.
>>> The latest Featured Stock Update with an annotated graph appeared on 3/16/2010. click here.
|
|
C
A
S
I |
News |
Chart |
SEC
View all notes Alert
me of new notes
Company
Profile
|
PCLN
- NASDAQ
Priceline.com Inc
INTERNET - Internet Software & Services
|
$399.55
|
-4.72
|
584,812
N/A
|
11/1/2002
(Date
Featured) |
$399.55
(Price
Featured) |
PP = $428.20 |
Y |
| MB = $449.61 |
Most Recent Note - 1/2/2011
Y - Returns to Featured Stocks list with its appearance in the January 2011 CANSLIM.net News including detailed analysis and annotated daily and weekly graphs.
>>> The latest Featured Stock Update with an annotated graph appeared on 3/30/2010. click here.
|
|
C
A
S
I |
News |
Chart |
SEC
View all notes Alert
me of new notes
Company
Profile
|
PEGA
- NASDAQ
Pegasystems Inc
COMPUTER SOFTWARE & SERVICES - Business Software & Services
|
$37.00
|
-0.31
|
129,072
60% DAV
213,700
|
2/26/2010
(Date
Featured) |
$36.00
(Price
Featured) |
PP = $38.55 |
Y |
| MB = $40.48 |
Most Recent Note - 3/31/2010 5:47:59 PM
Y - Today marked its 6th consecutive small loss with below average volume, pulling back near prior chart highs and its 50 DMA line which coincide in the $37 area. Volume totals have cooled while it has hovered in a tight range near all-time highs, but it has failed to follow through with confirming gains since its considerable gap up gain on 3/15/10 triggered a technical buy signal.
>>> The latest Featured Stock Update with an annotated graph appeared on 3/15/2010. click here.
|
|
C
A
S
I |
News |
Chart |
SEC
View all notes Alert
me of new notes
Company
Profile
|
ROVI
- NASDAQ
Rovi Corp
COMPUTER SOFTWARE & SERVICES - Security Software & Services
|
$37.13
|
-0.13
|
704,962
51% DAV
1,376,800
|
2/25/2010
(Date
Featured) |
$33.54
(Price
Featured) |
PP = $34.87 |
G |
| MB = $36.61 |
Most Recent Note - 3/31/2010 5:49:29 PM
G - Posted a 6th consecutive small loss today on light volume, yet it is still perched only -3.6% from its all-time high. It is slightly extended from its latest base, while prior chart highs in the $34 area define an important support level to watch on pullbacks.
>>> The latest Featured Stock Update with an annotated graph appeared on 3/17/2010. click here.
|
|
C
A
S
I |
News |
Chart |
SEC
View all notes Alert
me of new notes
Company
Profile
|
SIRO
- NASDAQ
Sirona Dental Systems
HEALTH SERVICES - Medical Instruments & Supplies
|
$38.03
|
+0.07
|
373,504
63% DAV
589,100
|
2/16/2010
(Date
Featured) |
$36.43
(Price
Featured) |
PP = $36.15 |
G |
| MB = $37.96 |
Most Recent Note - 3/31/2010 5:51:53 PM
G - Hovering near its 52-week high and just above its "max buy" level with volume totals recently cooling. Color code was changed to green. Prior chart highs and its 50 DMA line in the $35-36 area define important support to watch.
>>> The latest Featured Stock Update with an annotated graph appeared on 3/26/2010. click here.
|
|
C
A
S
I |
News |
Chart |
SEC
View all notes Alert
me of new notes
Company
Profile
|
ULTA
- NASDAQ
Ulta Salon Cosm & Frag
SPECIALTY RETAIL - Specialty Retail, Other
|
$22.62
|
-0.59
|
459,712
126% DAV
365,900
|
3/12/2010
(Date
Featured) |
$22.81
(Price
Featured) |
PP = $21.72 |
G |
| MB = $22.81 |
Most Recent Note - 3/31/2010 5:55:30 PM
G - Loss today with slightly higher than average volume may be a sign of distributional pressure, closing the session just below its "max buy" level. A detailed Stock Bulletin with annotated graph was published soon after it was featured in the 3/12/10 mid-day report.
>>> The latest Featured Stock Update with an annotated graph appeared on 3/12/2010. click here.
|
|
C
A
S
I |
News |
Chart |
SEC
View all notes Alert
me of new notes
Company
Profile
|
VPRT
- NASDAQ
Vistaprint Nv
DIVERSIFIED SERVICES - Business/Management Services
|
$57.37
|
+0.15
|
440,709
99% DAV
447,000
|
3/1/2010
(Date
Featured) |
$57.72
(Price
Featured) |
PP = $59.70 |
G |
| MB = $62.69 |
Most Recent Note - 3/31/2010 5:57:33 PM
G - Held its ground today after its 3/30/10 positive reversal to close near the session high and near its 50 DMA line. Weak action recently raised concerns and its color code was changed to green. It did not trigger a technical buy signal since it was featured in the March 2010 CANSLIM.net News monthly newsletter (read here). As previously noted, "Its gain on 3/02/10 was below the volume guidelines for buyable breakouts under the investment system."
>>> The latest Featured Stock Update with an annotated graph appeared on 3/19/2010. click here.
|
|
C
A
S
I |
News |
Chart |
SEC
View all notes Alert
me of new notes
Company
Profile
|
|
|
|
THESE ARE NOT BUY RECOMMENDATIONS!
Comments contained in the body of this report are technical
opinions only. The material herein has been obtained
from sources believed to be reliable and accurate, however,
its accuracy and completeness cannot be guaranteed.
This site is not an investment advisor, hence it does
not endorse or recommend any securities or other investments.
Any recommendation contained in this report may not
be suitable for all investors and it is not to be deemed
an offer or solicitation on our part with respect to
the purchase or sale of any securities. All trademarks,
service marks and trade names appearing in this report
are the property of their respective owners, and are
likewise used for identification purposes only.
This report is a service available
only to active Paid Premium Members.
You may opt-out of receiving report notifications
at any time. Questions or comments may be submitted
by writing to Premium Membership Services 665 S.E. 10 Street, Suite 201 Deerfield Beach, FL 33441-5634 or by calling 1-800-965-8307
or 954-785-1121.
|
|
|


