You are not logged in.
This means you
CAN ONLY VIEW reports that were published prior to Monday, April 14, 2025.
You
MUST UPGRADE YOUR MEMBERSHIP if you want to see any current reports.
AFTER MARKET UPDATE - MONDAY, MARCH 29TH, 2010
Previous After Market Report Next After Market Report >>>
|
|
|
|
DOW |
+45.50 |
10,895.86 |
+0.42% |
|
Volume |
944,409,630 |
-8% |
|
Volume |
1,894,432,760 |
-17% |
|
NASDAQ |
+9.23 |
2,404.36 |
+0.39% |
|
Advancers |
2,092 |
66% |
|
Advancers |
1,557 |
55% |
|
S&P 500 |
+6.63 |
1,173.22 |
+0.57% |
|
Decliners |
949 |
30% |
|
Decliners |
1,123 |
40% |
|
Russell 2000 |
+3.28 |
682.25 |
+0.48% |
|
52 Wk Highs |
209 |
|
|
52 Wk Highs |
94 |
|
|
S&P 600 |
+1.43 |
362.53 |
+0.40% |
|
52 Wk Lows |
9 |
|
|
52 Wk Lows |
15 |
|
|
 |
Indices Rise With Lighter Volume Behind Gains
Adam Sarhan, Contributing Writer,
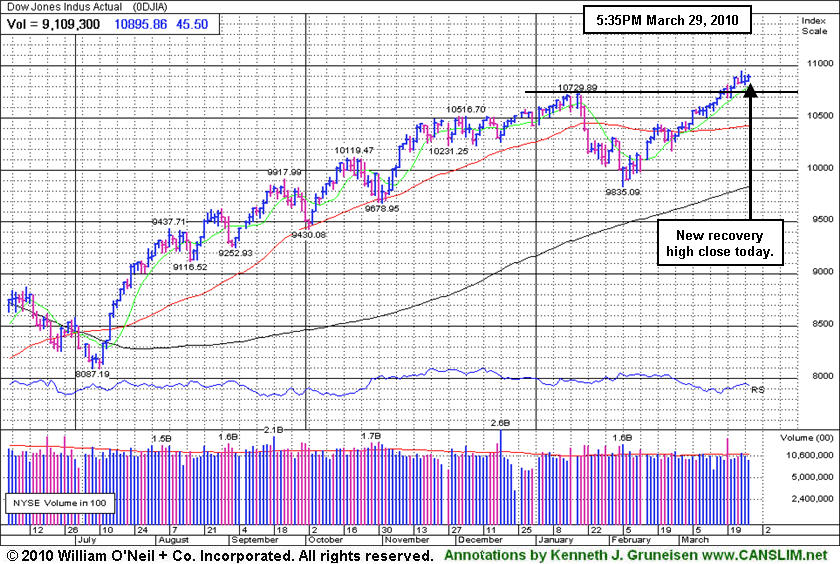
The US dollar fell which helped send a slew of dollar denominated assets higher on Monday. Volume totals on the NYSE and on the Nasdaq exchange were reported lower compared to Friday's totals while advancers led decliners by about a 2-to-1 ratio on the NYSE and by about a 3-to-2 ratio on the Nasdaq exchanges. There were 31 high-ranked companies from the CANSLIM.net Leaders List that made a new 52-week high and appeared on the CANSLIM.net BreakOuts Page, higher than the 17 issues that appeared on the prior session. New 52-week highs outnumbered new lows on both exchanges yet again.
The government said consumer spending rose in February for a fifth consecutive month while personal income levels held steady. The Labor Department is slated to release February's jobs report this Friday even though the stock market will be closed in observance of Good Friday. Many pundits believe that Friday's report will show the largest monthly increase in payrolls in three years, which may bode well for the economic recovery. Elsewhere, the European Union said business and consumer confidence rose, which were welcome signs.
The US dollar's weakness, in turn, sent a slew of stocks and commodities higher. Oil enjoyed its largest single-day advance in 5 weeks. Crude oil for May delivery jumped nearly +3% to $82.18 a barrel in New York. Meanwhile, Copper rose nearly +4% and hit a fresh 11- week high, and gold and silver both advanced.
The fact that there have only been two distribution days since the follow-though-day (FTD) bodes well for this nascent rally. It is also a welcome sign to see the market continue to improve as investors digest the latest round of stronger than expected economic and earnings data. Remember that now that a new rally has been confirmed, the window is open to proactively be buying high quality breakouts meeting the investment system guidelines. Trade accordingly. Professional Money Management Services - Free Portfolio Review!!
Our skilled team of portfolio managers knows how to follow the rules of this fact-based investment system. If your portfolio is greater than $100,000 and you would like a free portfolio review, please click here to get connected with one of our portfolio managers. ** Serious inquires only, please.
PICTURED: The Dow Jones Industrial Average closed at a fresh recovery high.
|
|
|
 |
Defensive Groups Led Monday's Gainers
Kenneth J. Gruneisen - Passed the CAN SLIM® Master's Exam
Defensive groups posted standout gains on Monday as the Gold & Silver Index ($XAU +1.94%), Oil Services Index ($OSX +1.91%), Integrated Oil Index ($XOI +1.42%), and Healthcare Index ($HMO +1.43%) posted solid gains. The Broker/Dealer Index ($XBD +0.97%) posted a respectable gain, but the Bank Index ($BKX -0.25%) and Retail Index ($RLX -0.25%) closed with a slightly negative bias. The Semiconductor Index ($SOX +0.96%) and Networking Index ($NWX +0.64%) led the tech sector higher while the Internet Index ($IIX +0.26%) posted a smaller gain and the Biotechnology Index ($BTK -0.13%) edged lower.
Charts courtesy www.stockcharts.com
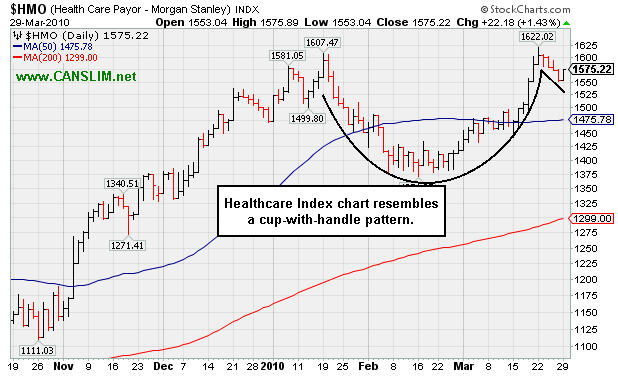
PICTURED: The Healthcare Index ($HMO +1.43%) chart resembles a cup-with-handle pattern.
| Oil Services |
$OSX |
203.10 |
+3.81 |
+1.91% |
+4.20% |
| Healthcare |
$HMO |
1,575.22 |
+22.19 |
+1.43% |
+6.94% |
| Integrated Oil |
$XOI |
1,073.22 |
+15.05 |
+1.42% |
+0.47% |
| Semiconductor |
$SOX |
366.37 |
+3.48 |
+0.96% |
+1.79% |
| Networking |
$NWX |
258.00 |
+1.65 |
+0.64% |
+11.66% |
| Internet |
$IIX |
248.36 |
+0.65 |
+0.26% |
+6.20% |
| Broker/Dealer |
$XBD |
117.73 |
+1.13 |
+0.97% |
+2.33% |
| Retail |
$RLX |
453.06 |
-1.13 |
-0.25% |
+10.20% |
| Gold & Silver |
$XAU |
164.54 |
+3.13 |
+1.94% |
-2.21% |
| Bank |
$BKX |
52.17 |
-0.13 |
-0.25% |
+22.15% |
| Biotech |
$BTK |
1,242.98 |
-1.66 |
-0.13% |
+31.93% |
|
|
|
 |
Financial Firm Consolidating After Getting Extended From Latest Base
Kenneth J. Gruneisen - Passed the CAN SLIM® Master's Exam
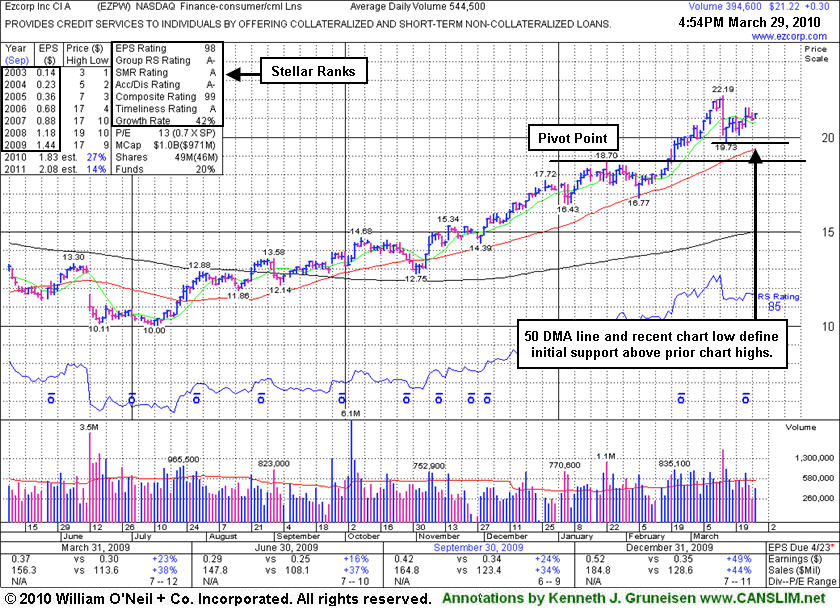
Ezcorp Inc (EZPW +$0.30 or +1.43% to $21.22) is a high-ranked Finance - Consumer/Commercial Loans firm that is now quietly consolidating well above its 50-day moving average (DMA) line and its recent chart low ($19.73 on 3/16/10) which define near-term support above prior chart highs. It is extended from its latest sound base of support. As previously noted, "Since it managed to top its 2008 all-time high, no resistance remains due to overhead supply, but disciplined investors avoid chasing extended stocks trading more than +5% above prior chart highs."
EZPW was featured in yellow with new pivot point and may buy levels noted in the 2/19/10 mid-day report (read here). It followed a negative reversal on 2/19/10 with a considerable gain on the very next session (2/22/10) with twice average volume triggering a technical buy signal. By the evening of 2/24/10 its color code was changed to green as it had rallied above its "max buy" level. This previously featured stock was dropped from the Featured Stocks list on 10/09/08, yet it continued to show strong sales and earnings growth (solid fundamentals). Earnings per share increases have shown acceleration along with greater than +25% sales revenues increases in the latest quarterly comparisons (good C criteria) versus the year earlier, and a great annual earnings history (good A criteria).
|
|
|
Color Codes Explained :
Y - Better candidates highlighted by our
staff of experts.
G - Previously featured
in past reports as yellow but may no longer be buyable under the
guidelines.
***Last / Change / Volume quote data in this table corresponds with the timestamp on the note***
Symbol/Exchange
Company Name
Industry Group |
Last |
Chg. |
Vol
% DAV |
Date Featured |
Price Featured |
Latest Pivot Point
Featured |
Status |
| Latest Max Buy Price |
ARUN
- NASDAQ
Aruba Networks Inc
COMPUTER HARDWARE - Networking & Communication Dev
|
$13.31
|
+0.38
|
1,369,385
91% DAV
1,504,500
|
2/19/2010
(Date
Featured) |
$12.71
(Price
Featured) |
PP = $11.94 |
G |
| MB = $12.54 |
Most Recent Note - 3/29/2010 4:16:37 PM
G - Small gap up gain today for its second best close of 2010. Support to watch is defined by prior chart highs and its 50 DMA line in the upper $11 area.
>>> The latest Featured Stock Update with an annotated graph appeared on 3/11/2010. click here.
|
|
C
A
S
I |
News |
Chart |
SEC
View all notes Alert
me of new notes
Company
Profile
|
BIDU
- NASDAQ
Baidu Inc Ads
INTERNET - Internet Information Providers
|
$603.50
|
+7.13
|
922,785
42% DAV
2,194,100
|
1/13/2010
(Date
Featured) |
$431.25
(Price
Featured) |
PP = $426.75 |
G |
| MB = $448.09 |
Most Recent Note - 3/29/2010 4:17:25 PM
G - Quietly hovering near all-time highs. As recently noted, "It is extended from any sound base now. An upward trendline connecting its January-March lows is an initial chart support level to watch, where a subsequent violation may prompt investors to lock in gains."
>>> The latest Featured Stock Update with an annotated graph appeared on 3/24/2010. click here.
|
|
C
A
S
I |
News |
Chart |
SEC
View all notes Alert
me of new notes
Company
Profile
|
BRLI
- NASDAQ
Bio Reference Labs Inc
HEALTH SERVICES - Medical Laboratories & Researc
|
$43.93
|
+0.45
|
71,964
74% DAV
96,700
|
2/12/2010
(Date
Featured) |
$39.02
(Price
Featured) |
PP = $40.97 |
G |
| MB = $43.02 |
Most Recent Note - 3/29/2010 4:21:35 PM
G - Consolidating above its "max buy" level, its color code was changed to green. Prior chart highs and its 50 DMA line coincide in the $40 area, defining important support to watch.
>>> The latest Featured Stock Update with an annotated graph appeared on 3/22/2010. click here.
|
|
C
A
S
I |
News |
Chart |
SEC
View all notes Alert
me of new notes
Company
Profile
|
CISG
- NASDAQ
Cninsure Inc Ads
INSURANCE - Insurance Brokers
|
$26.64
|
-0.19
|
139,530
61% DAV
229,400
|
3/3/2010
(Date
Featured) |
$24.38
(Price
Featured) |
PP = $23.10 |
G |
| MB = $24.26 |
Most Recent Note - 3/29/2010 4:28:33 PM
G - Quietly holding its ground near its 52-week high since its considerable gain on 3/23/10 with 3 times average volume. Extended from a sound base, yet no overhead supply remains to act as resistance. It rose from a 20-week double bottom base with 8 times average volume as it was featured in the 3/03/10 mid-day report (read here).
>>> The latest Featured Stock Update with an annotated graph appeared on 3/23/2010. click here.
|
|
C
A
S
I |
News |
Chart |
SEC
View all notes Alert
me of new notes
Company
Profile
|
CRM
- NYSE
Salesforce.com Inc
INTERNET - Internet Software & Services
|
$74.77
|
-0.18
|
1,047,553
52% DAV
2,009,700
|
3/5/2010
(Date
Featured) |
$72.28
(Price
Featured) |
PP = $75.53 |
Y |
| MB = $79.31 |
Most Recent Note - 3/29/2010 4:29:22 PM
Y - Posted a 5th consecutive small loss today on light volume, slumping under its pivot point near prior chart highs in the $75 area. It recently rose above its pivot point to a new 52-week high without the required volume to trigger a proper technical buy signal.
>>> The latest Featured Stock Update with an annotated graph appeared on 3/25/2010. click here.
|
|
C
A
S
I |
News |
Chart |
SEC
View all notes Alert
me of new notes
Company
Profile
|
CTRP
- NASDAQ
Ctrip.com Intl Ltd Adr
LEISURE - Resorts & Casinos
|
$40.39
|
+0.87
|
1,685,169
77% DAV
2,184,600
|
3/25/2010
(Date
Featured) |
$40.74
(Price
Featured) |
PP = $39.40 |
Y |
| MB = $41.37 |
Most Recent Note - 3/29/2010 4:30:43 PM
Y - Gain today on light volume for its second best close ever. Its 3/25/10 gain for a new 52-week high with +81% above average volume triggered a technical buy signal. Recently found prompt support near its 50 DMA line. A detailed new Stock Bulletin with annotated graphs and expert analysis was published on 3/25/10 (read here).
>>> The latest Featured Stock Update with an annotated graph appeared on 3/25/2010. click here.
|
|
C
A
S
I |
News |
Chart |
SEC
View all notes Alert
me of new notes
Company
Profile
|
EZPW
- NASDAQ
Ezcorp Inc Cl A
SPECIALTY RETAIL - Specialty Retail, Other
|
$21.22
|
+0.30
|
400,719
73% DAV
547,300
|
2/19/2010
(Date
Featured) |
$19.03
(Price
Featured) |
PP = $18.80 |
G |
| MB = $19.74 |
Most Recent Note - 3/29/2010 4:32:53 PM
G - High-ranked Finance - Consumer/Commercial Loans firm is quietly consolidating above its 50 DMA line and its recent chart low ($19.73 on 3/16/10) which define near-term support.
>>> The latest Featured Stock Update with an annotated graph appeared on 3/29/2010. click here.
|
|
C
A
S
I |
News |
Chart |
SEC
View all notes Alert
me of new notes
Company
Profile
|
GMCR
- NASDAQ
Green Mtn Coffee Roastrs
FOOD & BEVERAGE - Processed & Packaged Goods
|
$94.01
|
+0.88
|
561,322
44% DAV
1,277,100
|
2/26/2010
(Date
Featured) |
$84.39
(Price
Featured) |
PP = $88.75 |
G |
| MB = $93.19 |
Most Recent Note - 3/29/2010 4:36:10 PM
G - Posted a small gain today on very light volume after 4 consecutive small losses. Color code is changed to green as it finished above the previously cited "max buy" level. Its high volume gain on 3/08/10 triggered the latest technical buy signal. Initial support to watch is at prior chart highs and its 50 DMA line in the $86-88 area.
>>> The latest Featured Stock Update with an annotated graph appeared on 3/12/2010. click here.
|
|
C
A
S
I |
News |
Chart |
SEC
View all notes Alert
me of new notes
Company
Profile
|
ISRG
- NASDAQ
Intuitive Surgical Inc
HEALTH SERVICES - Medical Appliances & Equipment
|
$347.79
|
+5.79
|
442,611
83% DAV
530,300
|
1/22/2010
(Date
Featured) |
$340.40
(Price
Featured) |
PP = $314.00 |
G |
| MB = $329.70 |
Most Recent Note - 3/29/2010 4:38:07 PM
G - Posted a gain today, rallying near prior chart highs ($346) and its 50 DMA line -important support levels to watch. As previously repeated in notes, it did not trigger a technical buy signal in recent weeks.
>>> The latest Featured Stock Update with an annotated graph appeared on 3/16/2010. click here.
|
|
C
A
S
I |
News |
Chart |
SEC
View all notes Alert
me of new notes
Company
Profile
|
PCLN
- NASDAQ
Priceline.com Inc
INTERNET - Internet Software & Services
|
$399.55
|
-4.72
|
584,812
N/A
|
11/1/2002
(Date
Featured) |
$399.55
(Price
Featured) |
PP = $428.20 |
Y |
| MB = $449.61 |
Most Recent Note - 1/2/2011
Y - Returns to Featured Stocks list with its appearance in the January 2011 CANSLIM.net News including detailed analysis and annotated daily and weekly graphs.
>>> The latest Featured Stock Update with an annotated graph appeared on 3/10/2010. click here.
|
|
C
A
S
I |
News |
Chart |
SEC
View all notes Alert
me of new notes
Company
Profile
|
PEGA
- NASDAQ
Pegasystems Inc
COMPUTER SOFTWARE & SERVICES - Business Software & Services
|
$37.64
|
-0.16
|
116,121
53% DAV
217,100
|
2/26/2010
(Date
Featured) |
$36.00
(Price
Featured) |
PP = $38.55 |
Y |
| MB = $40.48 |
Most Recent Note - 3/29/2010 4:42:02 PM
Y - Today marked its 4th consecutive small loss with light volume. Volume totals have cooled while it has hovered in a tight range near all-time highs, but it has failed to follow through with confirming gains since its considerable gap up gain on 3/15/10 triggered a technical buy signal. Prior chart highs near $37-38 are initial chart support above its 50 DMA line.
>>> The latest Featured Stock Update with an annotated graph appeared on 3/15/2010. click here.
|
|
C
A
S
I |
News |
Chart |
SEC
View all notes Alert
me of new notes
Company
Profile
|
ROVI
- NASDAQ
Rovi Corp
COMPUTER SOFTWARE & SERVICES - Security Software & Services
|
$37.28
|
-0.04
|
757,625
56% DAV
1,364,500
|
2/25/2010
(Date
Featured) |
$33.54
(Price
Featured) |
PP = $34.87 |
G |
| MB = $36.61 |
Most Recent Note - 3/29/2010 4:43:26 PM
G - Posted a 4th consecutive small loss today on light volume, perched -3.2% from its all-time high. It is slightly extended from its latest base, while prior chart highs in the $34 area define an important support level to watch on pullbacks.
>>> The latest Featured Stock Update with an annotated graph appeared on 3/17/2010. click here.
|
|
C
A
S
I |
News |
Chart |
SEC
View all notes Alert
me of new notes
Company
Profile
|
SIRO
- NASDAQ
Sirona Dental Systems
HEALTH SERVICES - Medical Instruments & Supplies
|
$38.15
|
+0.68
|
618,456
107% DAV
579,100
|
2/16/2010
(Date
Featured) |
$36.43
(Price
Featured) |
PP = $36.15 |
G |
| MB = $37.96 |
Most Recent Note - 3/29/2010 4:45:56 PM
G - Today's gain helped it close above its "max buy" level for its best close of 2010. Color code is changed to green. Prior chart highs and its 50 DMA line in the $35-36 area define important support to watch.
>>> The latest Featured Stock Update with an annotated graph appeared on 3/26/2010. click here.
|
|
C
A
S
I |
News |
Chart |
SEC
View all notes Alert
me of new notes
Company
Profile
|
ULTA
- NASDAQ
Ulta Salon Cosm & Frag
SPECIALTY RETAIL - Specialty Retail, Other
|
$22.81
|
+0.31
|
209,572
58% DAV
363,100
|
3/12/2010
(Date
Featured) |
$22.81
(Price
Featured) |
PP = $21.72 |
Y |
| MB = $22.81 |
Most Recent Note - 3/29/2010 4:47:41 PM
Y - Small gain today with lighter than average volume, closing at its "max buy" level. A detailed Stock Bulletin with annotated graph was published soon after it was featured in the 3/12/10 mid-day report.
>>> The latest Featured Stock Update with an annotated graph appeared on 3/12/2010. click here.
|
|
C
A
S
I |
News |
Chart |
SEC
View all notes Alert
me of new notes
Company
Profile
|
VPRT
- NASDAQ
Vistaprint Nv
DIVERSIFIED SERVICES - Business/Management Services
|
$57.16
|
-2.82
|
1,162,434
261% DAV
446,100
|
3/1/2010
(Date
Featured) |
$57.72
(Price
Featured) |
PP = $59.70 |
G |
| MB = $62.69 |
Most Recent Note - 3/29/2010 4:52:37 PM
G - Gapped down today and slumped below its pivot point after an analyst downgrade, closing near its 50 DMA line with a considerable loss on nearly 3 times average volume. The weak action raises concerns and its color code is changed to green. It did not trigger a technical buy signal since it was featured in the March 2010 CANSLIM.net News monthly newsletter (read here). As previously noted, "Its gain on 3/02/10 was below the volume guidelines for buyable breakouts under the investment system."
>>> The latest Featured Stock Update with an annotated graph appeared on 3/19/2010. click here.
|
|
C
A
S
I |
News |
Chart |
SEC
View all notes Alert
me of new notes
Company
Profile
|
|
|
|
THESE ARE NOT BUY RECOMMENDATIONS!
Comments contained in the body of this report are technical
opinions only. The material herein has been obtained
from sources believed to be reliable and accurate, however,
its accuracy and completeness cannot be guaranteed.
This site is not an investment advisor, hence it does
not endorse or recommend any securities or other investments.
Any recommendation contained in this report may not
be suitable for all investors and it is not to be deemed
an offer or solicitation on our part with respect to
the purchase or sale of any securities. All trademarks,
service marks and trade names appearing in this report
are the property of their respective owners, and are
likewise used for identification purposes only.
This report is a service available
only to active Paid Premium Members.
You may opt-out of receiving report notifications
at any time. Questions or comments may be submitted
by writing to Premium Membership Services 665 S.E. 10 Street, Suite 201 Deerfield Beach, FL 33441-5634 or by calling 1-800-965-8307
or 954-785-1121.
|
|
|


