You are not logged in.
This means you
CAN ONLY VIEW reports that were published prior to Monday, April 14, 2025.
You
MUST UPGRADE YOUR MEMBERSHIP if you want to see any current reports.
AFTER MARKET UPDATE - FRIDAY, MARCH 28TH, 2014
Previous After Market Report Next After Market Report >>>
|
|
|
|
DOW |
+58.83 |
16,323.06 |
+0.36% |
|
Volume |
627,178,920 |
-19% |
|
Volume |
1,892,024,400 |
-11% |
|
NASDAQ |
+4.53 |
4,155.76 |
+0.11% |
|
Advancers |
2,179 |
69% |
|
Advancers |
1,379 |
50% |
|
S&P 500 |
+8.58 |
1,857.62 |
+0.46% |
|
Decliners |
861 |
27% |
|
Decliners |
1,306 |
47% |
|
Russell 2000 |
+0.37 |
1,151.81 |
+0.03% |
|
52 Wk Highs |
77 |
|
|
52 Wk Highs |
36 |
|
|
S&P 600 |
+1.54 |
659.25 |
+0.23% |
|
52 Wk Lows |
13 |
|
|
52 Wk Lows |
40 |
|
|
 |
Major Averages Posted Gains on Lighter Volume
Kenneth J. Gruneisen - Passed the CAN SLIM® Master's Exam
The Nasdaq Composite Index posted its biggest weekly loss since October 2012 as it fell -2.8%. The S&P 500 Index lost -0.5% but the Dow rose +0.1% for its second straight week of gains. Behind Friday's modest gains the volume totals were reported lighter on the Nasdaq exchange and on the NYSE. Advancers led decliners by more than a 2-1 margin on the NYSE while advancers had only a narrow lead over decliners on the Nasdaq exchange. There were 13 high-ranked companies from the CANSLIM.net Leaders List that made new 52-week highs and appeared on the CANSLIM.net BreakOuts Page, up from the total of 5 stocks on the prior session. The list of stocks hitting new 52-week highs outnumbered new 52-week lows on the NYSE, however new lows outnumbered new highs on the Nasdaq exchange. Gains were posted by 6 of the 9 high-ranked companies currently included on the Featured Stocks Page. Weakness in the major indices coupled with waning of leadership in the Market (M criteria) earned the label of a "correction" again. Investors are reminded to reduce market exposure and avoid new buying efforts until the market produces a new confirmed uptrend.
The major averages pared earlier gains on Friday but managed to snap a two-day slump. The Dow gained 58 points to 16,323. The S&P 500 increased 8 points to close at 1,857. The Nasdaq Composite Index was flat as it added less than 5 points to 4,155.
Investors were focused on a batch of economic data. Personal spending rose the most in three months while incomes increased for a second month. On the downside, the University of Michigan consumer confidence index slipped in March from the previous month.
Eight of the 10 S&P 500 sectors advanced. Energy and industrials were the best performing groups as Schlumberger (SLB +1.1%) and 3M (MMM +0.9%) edged higher. However, losses in health care limited the day's gains amid a retreat in biotechnology stocks including Gilead Sciences (GILD -4%) and Biogen (BIIB -5.4%).
Treasury prices fell for the first time in three sessions. The 10-year note lost 10/32 to yield 2.72%. The 30-year bond declined 12/32 to yield 3.55%.
The CANSLIM.net Featured Stocks Page shows the most action-worthy candidates and their latest notes and a Headline Link directs members to the latest detailed analysis with data-packed graphs annotated by a Certified expert along with links to additional resources. The Premium Member Homepage includes "dynamic archives" to all prior pay reports published. Watch for an announcement via email concerning the next WEBCAST.
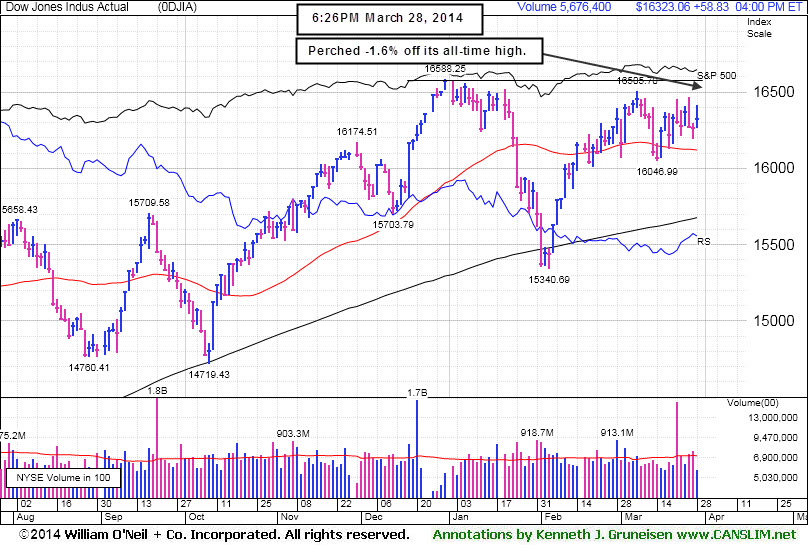
PICTURED: The Dow Jones Industrial Average is perched -1.6% off its all-time high, consolidating above its 50-day moving average (DMA) line.
|
 Kenneth J. Gruneisen started out as a licensed stockbroker in August 1987, a couple of months prior to the historic stock market crash that took the Dow Jones Industrial Average down -22.6% in a single day. He has published daily fact-based fundamental and technical analysis on high-ranked stocks online for two decades. Through FACTBASEDINVESTING.COM, Kenneth provides educational articles, news, market commentary, and other information regarding proven investment systems that work in good times and bad.
Comments contained in the body of this report are technical opinions only and are not necessarily those of Gruneisen Growth Corp. The material herein has been obtained from sources believed to be reliable and accurate, however, its accuracy and completeness cannot be guaranteed. Our firm, employees, and customers may effect transactions, including transactions contrary to any recommendation herein, or have positions in the securities mentioned herein or options with respect thereto. Any recommendation contained in this report may not be suitable for all investors and it is not to be deemed an offer or solicitation on our part with respect to the purchase or sale of any securities. |
|
 |
Semicondutor, Retail, Financial, and Commodity Linked Groups Rose
Kenneth J. Gruneisen - Passed the CAN SLIM® Master's Exam
The Retail Index ($RLX +0.51%) was a positive influence on the major averages and financial shares helped as the Broker/Dealer Index ($XBD +0.20%) and the Bank Index ($BKX +0.52%) edged higher. The Biotechnology Index ($BTK -2.81%) dragged the tech sector down with a big loss, meanwhile the Networking Index ($NWX +0.00%) finished flat and the Semiconductor Index ($SOX +0.73%) posted a gain. Commodity-linked groups had a positive bias as the Integrated Oil Index ($XOI +1.16%) and Oil Services Index ($OSX +1.58%) rose and the Gold & Silver Index ($XAU +1.68%) also tallied a gain.
Charts courtesy www.stockcharts.com
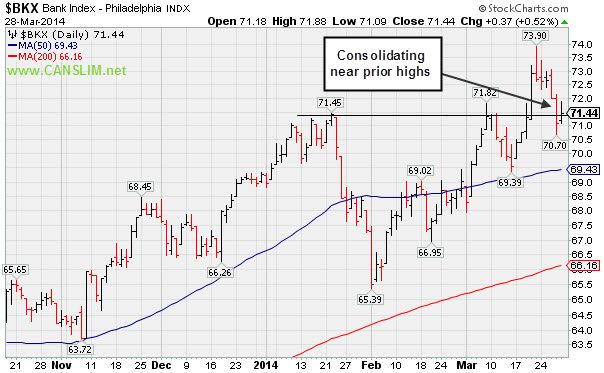
PICTURED 1: The Bank Index ($BKX +0.52%) posted a small gain while consolidating near prior highs and above its 50-day moving average (DMA) line.
Charts courtesy www.stockcharts.com
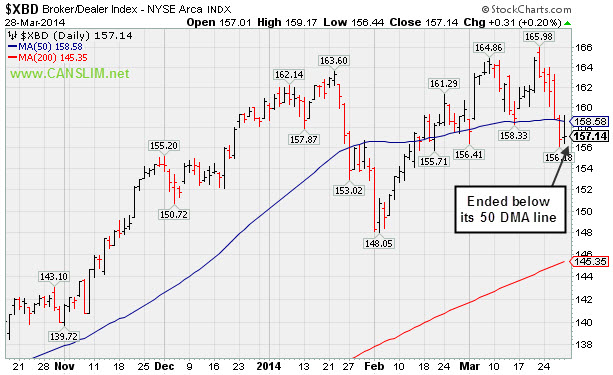
PICTURED 2: The Broker/Dealer Index ($XBD +0.20%) ended the week below its 50 DMA line.
| Oil Services |
$OSX |
288.63 |
+4.48 |
+1.58% |
+2.70% |
| Integrated Oil |
$XOI |
1,509.52 |
+17.34 |
+1.16% |
+0.42% |
| Semiconductor |
$SOX |
577.48 |
+4.16 |
+0.73% |
+7.93% |
| Networking |
$NWX |
333.54 |
+0.01 |
+0.00% |
+2.96% |
| Broker/Dealer |
$XBD |
157.14 |
+0.31 |
+0.20% |
-2.13% |
| Retail |
$RLX |
887.78 |
+4.52 |
+0.51% |
-5.54% |
| Gold & Silver |
$XAU |
93.36 |
+1.54 |
+1.68% |
+10.94% |
| Bank |
$BKX |
71.44 |
+0.37 |
+0.52% |
+3.15% |
| Biotech |
$BTK |
2,507.10 |
-72.60 |
-2.81% |
+7.58% |
|
|
|
 |
Major Averages Posted Gains on Lighter Volume
Kenneth J. Gruneisen - Passed the CAN SLIM® Master's Exam
The Nasdaq Composite Index posted its biggest weekly loss since October 2012 as it fell -2.8%. The S&P 500 Index lost -0.5% but the Dow rose +0.1% for its second straight week of gains. Behind Friday's modest gains the volume totals were reported lighter on the Nasdaq exchange and on the NYSE. Advancers led decliners by more than a 2-1 margin on the NYSE while advancers had only a narrow lead over decliners on the Nasdaq exchange. There were 13 high-ranked companies from the CANSLIM.net Leaders List that made new 52-week highs and appeared on the CANSLIM.net BreakOuts Page, up from the total of 5 stocks on the prior session. The list of stocks hitting new 52-week highs outnumbered new 52-week lows on the NYSE, however new lows outnumbered new highs on the Nasdaq exchange. Gains were posted by 6 of the 9 high-ranked companies currently included on the Featured Stocks Page. Weakness in the major indices coupled with waning of leadership in the Market (M criteria) earned the label of a "correction" again. Investors are reminded to reduce market exposure and avoid new buying efforts until the market produces a new confirmed uptrend.
The major averages pared earlier gains on Friday but managed to snap a two-day slump. The Dow gained 58 points to 16,323. The S&P 500 increased 8 points to close at 1,857. The Nasdaq Composite Index was flat as it added less than 5 points to 4,155.
Investors were focused on a batch of economic data. Personal spending rose the most in three months while incomes increased for a second month. On the downside, the University of Michigan consumer confidence index slipped in March from the previous month.
Eight of the 10 S&P 500 sectors advanced. Energy and industrials were the best performing groups as Schlumberger (SLB +1.1%) and 3M (MMM +0.9%) edged higher. However, losses in health care limited the day's gains amid a retreat in biotechnology stocks including Gilead Sciences (GILD -4%) and Biogen (BIIB -5.4%).
Treasury prices fell for the first time in three sessions. The 10-year note lost 10/32 to yield 2.72%. The 30-year bond declined 12/32 to yield 3.55%.
The CANSLIM.net Featured Stocks Page shows the most action-worthy candidates and their latest notes and a Headline Link directs members to the latest detailed analysis with data-packed graphs annotated by a Certified expert along with links to additional resources. The Premium Member Homepage includes "dynamic archives" to all prior pay reports published. Watch for an announcement via email concerning the next WEBCAST.
PICTURED: The Dow Jones Industrial Average is perched -1.6% off its all-time high, consolidating above its 50-day moving average (DMA) line. |
|
|
Color Codes Explained :
Y - Better candidates highlighted by our
staff of experts.
G - Previously featured
in past reports as yellow but may no longer be buyable under the
guidelines.
***Last / Change / Volume data in this table is the closing quote data***
Symbol/Exchange
Company Name
Industry Group |
PRICE |
CHANGE
(%Change) |
Day High |
Volume
(% DAV)
(% 50 day avg vol) |
52 Wk Hi
% From Hi |
Featured
Date |
Price
Featured |
Pivot Featured |
|
Max Buy |
EQM
-
NYSE
E Q T Midstream Partners
ENERGY - Oil and Gas Pipelines
|
$69.50
|
+0.65
0.94% |
$69.99
|
141,081
129.43% of 50 DAV
50 DAV is 109,000
|
$69.84
-0.49%
|
12/12/2013
|
$53.17
|
PP = $56.51
|
|
MB = $59.34
|
 Most Recent Note - 3/28/2014 12:21:50 PM
G - Inching further into new high territory with today's gain. Held its ground since reporting earnings -2% on +22% sales revenues for the Dec '13 quarter, below the +25% minimum earnings guideline (C criteria), raising fundamental concerns. Its 50 DMA line defines near-term support where a violation may trigger a technical sell signal.
>>> FEATURED STOCK ARTICLE : Hit New Highs But Fundamental Concerns Remain - 3/21/2014
View all notes |
Set NEW NOTE alert |
CANSLIM.net Company Profile |
SEC
News |
Chart |
Request a new note
C
A N
S L
I M


|
FB
-
NASDAQ
Facebook Inc Cl A
INTERNET
|
$60.01
|
-0.96
-1.57% |
$61.95
|
66,976,894
110.36% of 50 DAV
50 DAV is 60,688,000
|
$72.59
-17.33%
|
12/12/2013
|
$51.40
|
PP = $54.93
|
|
MB = $57.68
|
Most Recent Note - 3/28/2014 6:53:57 PM
G - Violated its 50 DMA line this week triggering a technical sell signal. Only a prompt rebound above that important short term average would help its outlook improve. See the latest FSU analysis for more details and new annotated graphs.
>>> FEATURED STOCK ARTICLE : Pulling Back After Getting Extended From Prior Base - 3/14/2014
View all notes |
Set NEW NOTE alert |
CANSLIM.net Company Profile |
SEC
News |
Chart |
Request a new note
C
A N
S L
I M
|
FLT
-
NYSE
Fleetcor Technologies
DIVERSIFIED SERVICES - Business/Management Services
|
$113.36
|
+0.23
0.20% |
$114.66
|
1,072,960
92.46% of 50 DAV
50 DAV is 1,160,500
|
$132.22
-14.26%
|
3/5/2014
|
$125.40
|
PP = $124.06
|
|
MB = $130.26
|
Most Recent Note - 3/26/2014 5:56:18 PM
G - Failing to find support, it quietly has slumped below its 50 DMA line and its color code is changed to green. Relative Strength rating has slumped to 75, below the 80+ minimum guideline for buy candidates.
>>> FEATURED STOCK ARTICLE : Negated Recent Breakout and Testing Support at 50-Day Average - 3/24/2014
View all notes |
Set NEW NOTE alert |
CANSLIM.net Company Profile |
SEC
News |
Chart |
Request a new note
C
A N
S L
I M
|
GNRC
-
NYSE
Generac Hldgs Inc
Electrical-Power/Equipmt
|
$58.11
|
+0.92
1.61% |
$58.53
|
346,869
36.36% of 50 DAV
50 DAV is 954,000
|
$62.50
-7.02%
|
2/14/2014
|
$56.50
|
PP = $57.39
|
|
MB = $60.26
|
Most Recent Note - 3/26/2014 5:53:57 PM
Y - Ended near the session low today with a loss on below average volume. Trading near prior highs in the $57 area defining near-term support to watch.
>>> FEATURED STOCK ARTICLE : Bullish Gap Up Followed By Wedging and Stalling Action - 3/11/2014
View all notes |
Set NEW NOTE alert |
CANSLIM.net Company Profile |
SEC
News |
Chart |
Request a new note
C
A N
S L
I M
|
ICON
-
NASDAQ
Iconix Brand Group Inc
CONSUMER NON-DURABLES - Textile - Apparel Footwear
|
$39.28
|
-0.17
-0.43% |
$39.54
|
328,458
53.76% of 50 DAV
50 DAV is 611,000
|
$42.47
-7.50%
|
3/7/2014
|
$41.46
|
PP = $40.88
|
|
MB = $42.92
|
Most Recent Note - 3/25/2014 6:07:38 PM
Y - Ended near the session low today with a loss on higher volume, sputtering near prior highs in the $40 area. More damaging losses and deterioration below recent lows ($39.75 on 3/14/14) would raise greater concerns. See the latest FSU analysis for more details and new annotated graphs.
>>> FEATURED STOCK ARTICLE : Falling Back Under Prior Highs Raises Concerns - 3/25/2014
View all notes |
Set NEW NOTE alert |
CANSLIM.net Company Profile |
SEC
News |
Chart |
Request a new note
C
A N
S L
I M
|
Symbol/Exchange
Company Name
Industry Group |
PRICE |
CHANGE
(%Change) |
Day High |
Volume
(% DAV)
(% 50 day avg vol) |
52 Wk Hi
% From Hi |
Featured
Date |
Price
Featured |
Pivot Featured |
|
Max Buy |
KORS
-
NYSE
Michael Kors Hldgs Ltd
RETAIL - Apparel Stores
|
$92.75
|
+1.21
1.32% |
$93.39
|
1,294,656
38.51% of 50 DAV
50 DAV is 3,362,000
|
$101.04
-8.20%
|
3/12/2014
|
$98.03
|
PP = $101.14
|
|
MB = $106.20
|
Most Recent Note - 3/27/2014 6:40:23 PM
G - Color code is changed to green after today's 6th consecutive loss as it slumped below its 50 DMA line. Prior highs in the $84 area define the next support level. See the latest FSU analysis for more details and new annotated graphs.
>>> FEATURED STOCK ARTICLE : Fell Below 50-Day Average Line With 6th Consecutive Loss - 3/27/2014
View all notes |
Set NEW NOTE alert |
CANSLIM.net Company Profile |
SEC
News |
Chart |
Request a new note
C
A N
S L
I M
|
PSIX
-
NASDAQ
Power Solutions Intl Inc
Machinery-Gen Industrial
|
$71.59
|
+1.51
2.15% |
$74.29
|
52,037
77.67% of 50 DAV
50 DAV is 67,000
|
$87.40
-18.09%
|
2/28/2014
|
$74.65
|
PP = $76.93
|
|
MB = $80.78
|
Most Recent Note - 3/27/2014 6:46:37 PM
G - Color code is changed to green. Today's 5th consecutive loss led to a close below its 50 DMA line raising more serious concerns and triggering a technical sell signal.
>>> FEATURED STOCK ARTICLE : Halted Slide After Undercutting Prior Highs on Pullback - 3/18/2014
View all notes |
Set NEW NOTE alert |
CANSLIM.net Company Profile |
SEC
News |
Chart |
Request a new note
C
A N
S L
I M
|
SILC
-
NASDAQ
Silicom Ltd
COMPUTER HARDWARE - Networking andamp; Communication Dev
|
$60.29
|
-1.95
-3.13% |
$62.59
|
84,733
86.46% of 50 DAV
50 DAV is 98,000
|
$73.44
-17.91%
|
12/23/2013
|
$44.62
|
PP = $46.25
|
|
MB = $48.56
|
Most Recent Note - 3/27/2014 6:48:18 PM
G - Rebounded toward its 50 DMA line today with a solid gain after a damaging volume-driven loss on the prior session raised concerns and triggered a technical sell signal. Only a prompt rebound above that important short-term average would help its outlook improve.
>>> FEATURED STOCK ARTICLE : Traded Up +64.6% in Under 3 Months Since Featured in Mid-Day Report - 3/20/2014
View all notes |
Set NEW NOTE alert |
CANSLIM.net Company Profile |
SEC
News |
Chart |
Request a new note
C
A N
S L
I M
|
VRX
-
NYSE
Valeant Pharmaceuticals
DRUGS - Drug Manufacturers - Other
|
$127.68
|
+0.49
0.39% |
$132.05
|
2,178,809
125.36% of 50 DAV
50 DAV is 1,738,000
|
$153.10
-16.60%
|
9/11/2013
|
$100.26
|
PP = $105.50
|
|
MB = $110.78
|
Most Recent Note - 3/26/2014 1:56:35 PM
G- Slumping further below its 50 DMA line and below Monday's lows today. Damaging losses were recently noted as weakness triggered a technical sell signal.
>>> FEATURED STOCK ARTICLE : Finding Support Above 50-Day Moving Average Line - 3/17/2014
View all notes |
Set NEW NOTE alert |
CANSLIM.net Company Profile |
SEC
News |
Chart |
Request a new note
C
A N
S L
I M
|
|
|
|
THESE ARE NOT BUY RECOMMENDATIONS!
Comments contained in the body of this report are technical
opinions only. The material herein has been obtained
from sources believed to be reliable and accurate, however,
its accuracy and completeness cannot be guaranteed.
This site is not an investment advisor, hence it does
not endorse or recommend any securities or other investments.
Any recommendation contained in this report may not
be suitable for all investors and it is not to be deemed
an offer or solicitation on our part with respect to
the purchase or sale of any securities. All trademarks,
service marks and trade names appearing in this report
are the property of their respective owners, and are
likewise used for identification purposes only.
This report is a service available
only to active Paid Premium Members.
You may opt-out of receiving report notifications
at any time. Questions or comments may be submitted
by writing to Premium Membership Services 665 S.E. 10 Street, Suite 201 Deerfield Beach, FL 33441-5634 or by calling 1-800-965-8307
or 954-785-1121.
|
|
|

