You are not logged in.
This means you
CAN ONLY VIEW reports that were published prior to Monday, April 14, 2025.
You
MUST UPGRADE YOUR MEMBERSHIP if you want to see any current reports.
AFTER MARKET UPDATE - THURSDAY, MARCH 27TH, 2014
Previous After Market Report Next After Market Report >>>
|
|
|
|
DOW |
-4.76 |
16,264.23 |
-0.03% |
|
Volume |
778,126,990 |
+5% |
|
Volume |
2,123,040,250 |
-7% |
|
NASDAQ |
-22.35 |
4,151.23 |
-0.54% |
|
Advancers |
1,633 |
52% |
|
Advancers |
1,040 |
36% |
|
S&P 500 |
-3.52 |
1,849.04 |
-0.19% |
|
Decliners |
1,416 |
45% |
|
Decliners |
1,731 |
61% |
|
Russell 2000 |
-4.04 |
1,151.44 |
-0.35% |
|
52 Wk Highs |
51 |
|
|
52 Wk Highs |
22 |
|
|
S&P 600 |
-2.26 |
657.71 |
-0.34% |
|
52 Wk Lows |
31 |
|
|
52 Wk Lows |
51 |
|
|
 |
Waning Leadership and Weakness Labeled a Market Correction
Kenneth J. Gruneisen - Passed the CAN SLIM® Master's Exam
Stocks finished modestly lower on Thursday's session. The volume totals were reported mixed, lighter on the Nasdaq exchange and higher on the NYSE. Advancers led decliners by an 8-7 margin on the NYSE but decliners led advancers by more than 3-2 on the Nasdaq exchange. There were only 5 high-ranked companies from the CANSLIM.net Leaders List that made new 52-week highs and appeared on the CANSLIM.net BreakOuts Page, down from the total of 17 stocks on the prior session. The list of stocks hitting new 52-week highs outnumbered new 52-week lows on the NYSE, however new lows outnumbered new highs on the Nasdaq exchange. Gains were posted by only 2 of the 10 high-ranked companies currently included on the Featured Stocks Page. Weakness in the major indices coupled with waning of leadership in the Market (M criteria) earned the label of a "correction" again per the newspaper. Investors are reminded to reduce market exposure and avoid new buying efforts until the market produces a new confirmed uptrend.
The major averages declined for a second day as weakness in tech and financials offset gains in the energy and telecom sectors. Google (GOOG -1.6%) edged lower. Citigroup Inc (C -5.4%) fell after its capital plan failed the Fed's stress test. Exxon (XOM +1.6%) edged higher as the price of crude oil advanced on the session. Shares of Verizon (VZ +1.5%) rose. On the earnings front, GameStop (GME -4%) was down after the video-game retailer cut its full-year profit forecast.
The latest economic releases failed to provide a tailwind to the market. Before the open, a report showed GDP grew at a 2.6% annualized rate in the fourth-quarter, less than the 2.7% consensus estimate. A separate release revealed initial jobless claims unexpectedly fell to its lowest level in almost four months. A gauge of the housing market showed pending home sales declined for an eighth consecutive month in February.
Treasuries were higher at the long end of the yield curve. Benchmark 10-year notes gained 4/32 to yield 2.68%.
The CANSLIM.net Featured Stocks Page shows the most action-worthy candidates and their latest notes and a Headline Link directs members to the latest detailed analysis with data-packed graphs annotated by a Certified expert along with links to additional resources. The Premium Member Homepage includes "dynamic archives" to all prior pay reports published. Watch for an announcement via email concerning the next WEBCAST.
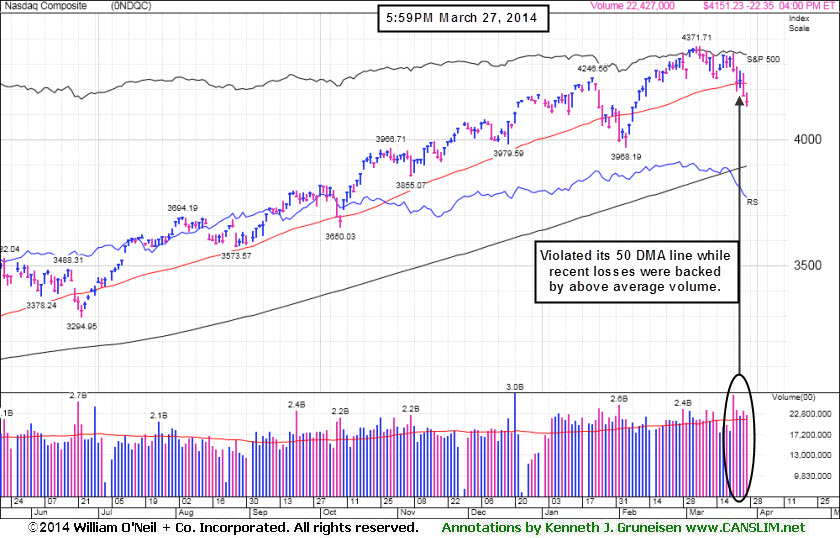
PICTURED: The Nasdaq Composite Index slumped further below its 50-day moving average (DMA) line on Thursday while leadership waned. Recent losses backed by above average volume have raised more serious concerns as technical damage has mounted.
|
 Kenneth J. Gruneisen started out as a licensed stockbroker in August 1987, a couple of months prior to the historic stock market crash that took the Dow Jones Industrial Average down -22.6% in a single day. He has published daily fact-based fundamental and technical analysis on high-ranked stocks online for two decades. Through FACTBASEDINVESTING.COM, Kenneth provides educational articles, news, market commentary, and other information regarding proven investment systems that work in good times and bad.
Comments contained in the body of this report are technical opinions only and are not necessarily those of Gruneisen Growth Corp. The material herein has been obtained from sources believed to be reliable and accurate, however, its accuracy and completeness cannot be guaranteed. Our firm, employees, and customers may effect transactions, including transactions contrary to any recommendation herein, or have positions in the securities mentioned herein or options with respect thereto. Any recommendation contained in this report may not be suitable for all investors and it is not to be deemed an offer or solicitation on our part with respect to the purchase or sale of any securities. |
|
 |
Commodity-Linked Groups Rose While Most Groups Fell
Kenneth J. Gruneisen - Passed the CAN SLIM® Master's Exam
Financial shares were among the negative influences on Thursday's session as the Bank Index ($BKX -1.31%) and Broker/Dealer Index ($XBD -1.23%) both lost ground. The Retail Index ($RLX -0.44%) edged lower and the Semiconductor Index ($SOX -0.78%) and the Networking Index ($NWX -0.39%) suffered modest losses while the Biotechnology Index ($BTK +0.64%) tallied a gain. Commodity-linked shares had a positive bias as the Integrated Oil Index ($XOI +0.47%) and the Oil Services Index ($OSX +0.86%) edged higher and the Gold & Silver Index ($XAU +1.10%) posted a gain.
Charts courtesy www.stockcharts.com
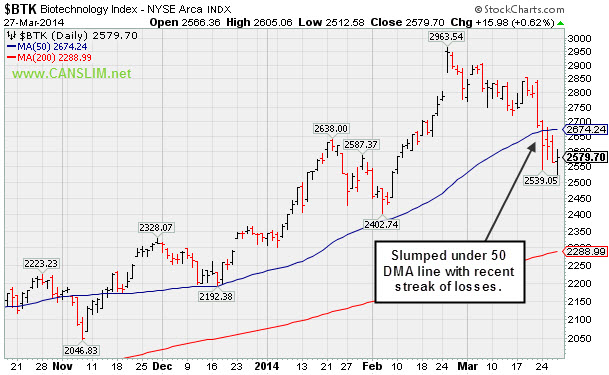
PICTURED: The Biotechnology Index ($BTK +0.64%) recently slumped under its 50-day moving average (DMA) line with a streak of losses.
| Oil Services |
$OSX |
284.15 |
+2.43 |
+0.86% |
+1.11% |
| Integrated Oil |
$XOI |
1,492.18 |
+6.97 |
+0.47% |
-0.73% |
| Semiconductor |
$SOX |
573.32 |
-4.52 |
-0.78% |
+7.16% |
| Networking |
$NWX |
333.53 |
-1.30 |
-0.39% |
+2.96% |
| Broker/Dealer |
$XBD |
156.83 |
-1.95 |
-1.23% |
-2.32% |
| Retail |
$RLX |
883.26 |
-3.92 |
-0.44% |
-6.02% |
| Gold & Silver |
$XAU |
91.82 |
+1.00 |
+1.10% |
+9.11% |
| Bank |
$BKX |
71.07 |
-0.94 |
-1.31% |
+2.61% |
| Biotech |
$BTK |
2,580.01 |
+16.29 |
+0.64% |
+10.71% |
|
|
|
 |
Fell Below 50-Day Average Line With 6th Consecutive Loss
Kenneth J. Gruneisen - Passed the CAN SLIM® Master's Exam
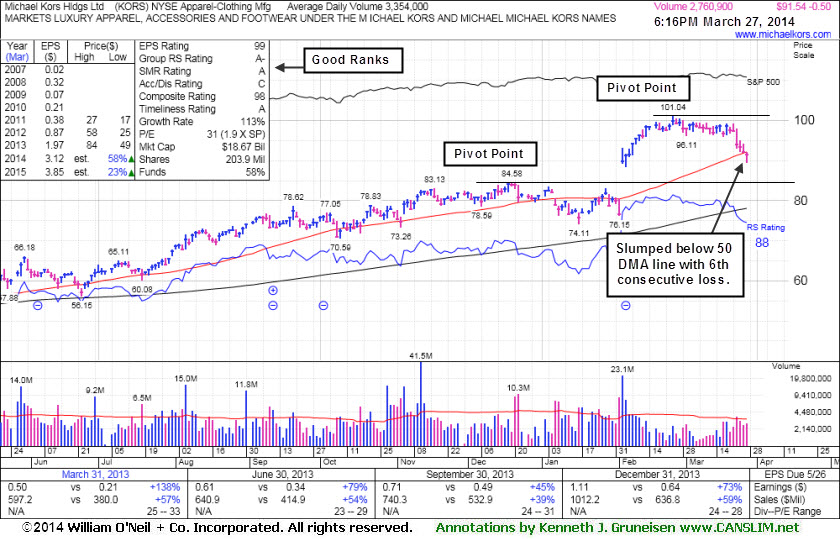
Michael Kors Hldgs Ltd (KORS -$0.01 or -0.01% to $98.03) lost ground today for a 6th consecutive session and slumped below its 50-day moving average (DMA) line ($92.16) raising concerns and its color code was changed to green. It may likely find support near that short-term average, meanwhile it faces resistance due to overhead supply up through the $101 level. The next level of support that comes into play is at prior highs in the $84 area.
KORS did not break out from the advanced "3-weeks tight" base pattern since last appearing in this FSU section on 3/12/14 with annotated graphs under the headline, "Formed Advanced Base Pattern With Volume Totals Cooling". Members were reminded - "Subsequent volume-driven gains to new highs may trigger a new (or add-on) technical buy signal. Disciplined investors may watch for proof of fresh institutional buying demand and yet avoid chasing stocks more than +5% above prior highs."
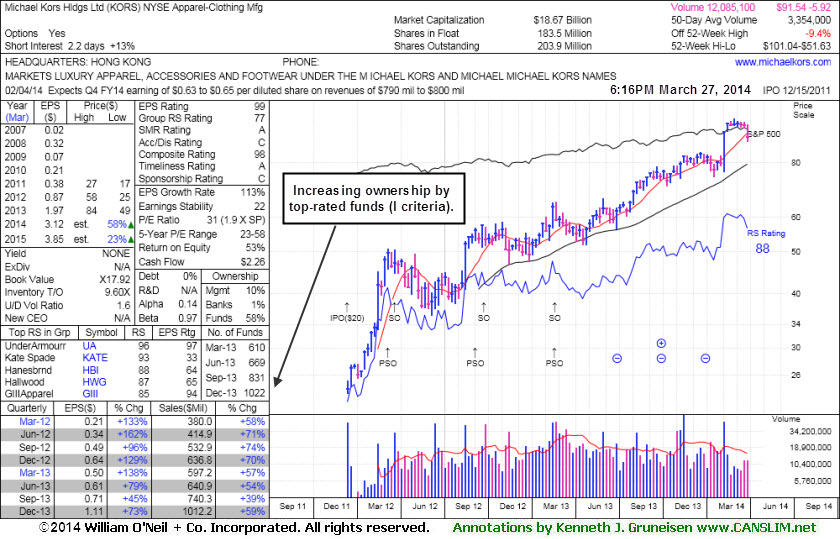
The company reported +73% earnings on +59% sales revenues for the Dec '13 quarter, continuing its strong earnings history (meeting C and A criteria). This high-ranked Apparel - Clothing Manufacturing firm has headquarters in Hong Kong. It completed Secondary Offerings on 9/25/12 and 2/20/13, each time while perched near its all-time highs. Prior reports noted - "Such offerings often are a short-term hindrance to upward price progress yet typically result in broader institutional ownership interest." The number of top-rated funds owning its shares rose from 326 in Mar '12 to 1,022 in Dec '13, a reassuring sign concerning the I criteria. Its current Up/Down Volume Ratio of 1.6 is an unbiased indication its shares have been under accumulation over the past 50 days.
|
|
|
Color Codes Explained :
Y - Better candidates highlighted by our
staff of experts.
G - Previously featured
in past reports as yellow but may no longer be buyable under the
guidelines.
***Last / Change / Volume data in this table is the closing quote data***
Symbol/Exchange
Company Name
Industry Group |
PRICE |
CHANGE
(%Change) |
Day High |
Volume
(% DAV)
(% 50 day avg vol) |
52 Wk Hi
% From Hi |
Featured
Date |
Price
Featured |
Pivot Featured |
|
Max Buy |
EQM
-
NYSE
E Q T Midstream Partners
ENERGY - Oil and Gas Pipelines
|
$68.85
|
-0.05
-0.07% |
$69.84
|
163,503
154.25% of 50 DAV
50 DAV is 106,000
|
$69.66
-1.16%
|
12/12/2013
|
$53.17
|
PP = $56.51
|
|
MB = $59.34
|
 Most Recent Note - 3/27/2014 12:32:39 PM
G - Inching into new high territory with today's 5th consecutive gain. Held its ground since reporting earnings -2% on +22% sales revenues for the Dec '13 quarter, below the +25% minimum earnings guideline (C criteria), raising fundamental concerns. Its 50 DMA line defines near-term support where a violation may trigger a technical sell signal.
>>> FEATURED STOCK ARTICLE : Hit New Highs But Fundamental Concerns Remain - 3/21/2014
View all notes |
Set NEW NOTE alert |
CANSLIM.net Company Profile |
SEC
News |
Chart |
Request a new note
C
A N
S L
I M


|
FB
-
NASDAQ
Facebook Inc Cl A
INTERNET
|
$60.97
|
+0.59
0.97% |
$61.90
|
112,443,048
189.98% of 50 DAV
50 DAV is 59,187,000
|
$72.59
-16.01%
|
12/12/2013
|
$51.40
|
PP = $54.93
|
|
MB = $57.68
|
Most Recent Note - 3/26/2014 1:51:34 PM
G - Violating its 50 DMA line and undercutting Monday's low today with a damaging loss raising concerns and triggering a technical sell signal. Only a prompt rebound above that important short term average would help its outlook improve.
>>> FEATURED STOCK ARTICLE : Pulling Back After Getting Extended From Prior Base - 3/14/2014
View all notes |
Set NEW NOTE alert |
CANSLIM.net Company Profile |
SEC
News |
Chart |
Request a new note
C
A N
S L
I M
|
FLT
-
NYSE
Fleetcor Technologies
DIVERSIFIED SERVICES - Business/Management Services
|
$113.13
|
-1.14
-1.00% |
$114.88
|
696,312
59.16% of 50 DAV
50 DAV is 1,176,900
|
$132.22
-14.44%
|
3/5/2014
|
$125.40
|
PP = $124.06
|
|
MB = $130.26
|
Most Recent Note - 3/26/2014 5:56:18 PM
G - Failing to find support, it quietly has slumped below its 50 DMA line and its color code is changed to green. Relative Strength rating has slumped to 75, below the 80+ minimum guideline for buy candidates.
>>> FEATURED STOCK ARTICLE : Negated Recent Breakout and Testing Support at 50-Day Average - 3/24/2014
View all notes |
Set NEW NOTE alert |
CANSLIM.net Company Profile |
SEC
News |
Chart |
Request a new note
C
A N
S L
I M
|
GNRC
-
NYSE
Generac Hldgs Inc
Electrical-Power/Equipmt
|
$57.19
|
-0.71
-1.23% |
$58.07
|
603,055
63.55% of 50 DAV
50 DAV is 949,000
|
$62.50
-8.50%
|
2/14/2014
|
$56.50
|
PP = $57.39
|
|
MB = $60.26
|
Most Recent Note - 3/26/2014 5:53:57 PM
Y - Ended near the session low today with a loss on below average volume. Trading near prior highs in the $57 area defining near-term support to watch.
>>> FEATURED STOCK ARTICLE : Bullish Gap Up Followed By Wedging and Stalling Action - 3/11/2014
View all notes |
Set NEW NOTE alert |
CANSLIM.net Company Profile |
SEC
News |
Chart |
Request a new note
C
A N
S L
I M
|
ICON
-
NASDAQ
Iconix Brand Group Inc
CONSUMER NON-DURABLES - Textile - Apparel Footwear
|
$39.45
|
-0.14
-0.35% |
$39.76
|
281,530
45.56% of 50 DAV
50 DAV is 618,000
|
$42.47
-7.10%
|
3/7/2014
|
$41.46
|
PP = $40.88
|
|
MB = $42.92
|
Most Recent Note - 3/25/2014 6:07:38 PM
Y - Ended near the session low today with a loss on higher volume, sputtering near prior highs in the $40 area. More damaging losses and deterioration below recent lows ($39.75 on 3/14/14) would raise greater concerns. See the latest FSU analysis for more details and new annotated graphs.
>>> FEATURED STOCK ARTICLE : Falling Back Under Prior Highs Raises Concerns - 3/25/2014
View all notes |
Set NEW NOTE alert |
CANSLIM.net Company Profile |
SEC
News |
Chart |
Request a new note
C
A N
S L
I M
|
Symbol/Exchange
Company Name
Industry Group |
PRICE |
CHANGE
(%Change) |
Day High |
Volume
(% DAV)
(% 50 day avg vol) |
52 Wk Hi
% From Hi |
Featured
Date |
Price
Featured |
Pivot Featured |
|
Max Buy |
KORS
-
NYSE
Michael Kors Hldgs Ltd
RETAIL - Apparel Stores
|
$91.54
|
-0.50
-0.54% |
$92.04
|
2,760,901
82.32% of 50 DAV
50 DAV is 3,354,000
|
$101.04
-9.40%
|
3/12/2014
|
$98.03
|
PP = $101.14
|
|
MB = $106.20
|
Most Recent Note - 3/27/2014 6:40:23 PM
G - Color code is changed to green after today's 6th consecutive loss as it slumped below its 50 DMA line. Prior highs in the $84 area define the next support level. See the latest FSU analysis for more details and new annotated graphs.
>>> FEATURED STOCK ARTICLE : Fell Below 50-Day Average Line With 6th Consecutive Loss - 3/27/2014
View all notes |
Set NEW NOTE alert |
CANSLIM.net Company Profile |
SEC
News |
Chart |
Request a new note
C
A N
S L
I M
|
PCLN
-
NASDAQ
Priceline.com Inc
INTERNET - Internet Software and Services
|
$1,182.25
|
-6.52
-0.55% |
$1,191.97
|
1,629,452
190.36% of 50 DAV
50 DAV is 856,000
|
$1,378.96
-14.27%
|
12/18/2013
|
$1,156.20
|
PP = $1,198.85
|
|
MB = $1,258.79
|
Most Recent Note - 3/27/2014 6:44:01 PM
Still below its 50 DMA line today after 5 consecutive losses with above average volume, action indicative of distributional pressure. It will be dropped from the Featured Stocks list tonight.
>>> FEATURED STOCK ARTICLE : Technical Deterioration Raised Concerns - 3/26/2014
View all notes |
Set NEW NOTE alert |
CANSLIM.net Company Profile |
SEC
News |
Chart |
Request a new note
C
A N
S L
I M
|
PSIX
-
NASDAQ
Power Solutions Intl Inc
Machinery-Gen Industrial
|
$70.08
|
-1.88
-2.61% |
$73.74
|
74,912
111.81% of 50 DAV
50 DAV is 67,000
|
$87.40
-19.82%
|
2/28/2014
|
$74.65
|
PP = $76.93
|
|
MB = $80.78
|
Most Recent Note - 3/27/2014 6:46:37 PM
G - Color code is changed to green. Today's 5th consecutive loss led to a close below its 50 DMA line raising more serious concerns and triggering a technical sell signal.
>>> FEATURED STOCK ARTICLE : Halted Slide After Undercutting Prior Highs on Pullback - 3/18/2014
View all notes |
Set NEW NOTE alert |
CANSLIM.net Company Profile |
SEC
News |
Chart |
Request a new note
C
A N
S L
I M
|
SILC
-
NASDAQ
Silicom Ltd
COMPUTER HARDWARE - Networking andamp; Communication Dev
|
$62.24
|
+3.39
5.76% |
$62.38
|
101,539
104.68% of 50 DAV
50 DAV is 97,000
|
$73.44
-15.25%
|
12/23/2013
|
$44.62
|
PP = $46.25
|
|
MB = $48.56
|
Most Recent Note - 3/27/2014 6:48:18 PM
G - Rebounded toward its 50 DMA line today with a solid gain after a damaging volume-driven loss on the prior session raised concerns and triggered a technical sell signal. Only a prompt rebound above that important short-term average would help its outlook improve.
>>> FEATURED STOCK ARTICLE : Traded Up +64.6% in Under 3 Months Since Featured in Mid-Day Report - 3/20/2014
View all notes |
Set NEW NOTE alert |
CANSLIM.net Company Profile |
SEC
News |
Chart |
Request a new note
C
A N
S L
I M
|
VRX
-
NYSE
Valeant Pharmaceuticals
DRUGS - Drug Manufacturers - Other
|
$127.19
|
-1.88
-1.46% |
$129.06
|
2,638,434
153.49% of 50 DAV
50 DAV is 1,719,000
|
$153.10
-16.92%
|
9/11/2013
|
$100.26
|
PP = $105.50
|
|
MB = $110.78
|
Most Recent Note - 3/26/2014 1:56:35 PM
G- Slumping further below its 50 DMA line and below Monday's lows today. Damaging losses were recently noted as weakness triggered a technical sell signal.
>>> FEATURED STOCK ARTICLE : Finding Support Above 50-Day Moving Average Line - 3/17/2014
View all notes |
Set NEW NOTE alert |
CANSLIM.net Company Profile |
SEC
News |
Chart |
Request a new note
C
A N
S L
I M
|
Symbol/Exchange
Company Name
Industry Group |
PRICE |
CHANGE
(%Change) |
Day High |
Volume
(% DAV)
(% 50 day avg vol) |
52 Wk Hi
% From Hi |
Featured
Date |
Price
Featured |
Pivot Featured |
|
Max Buy |
|
|
|
THESE ARE NOT BUY RECOMMENDATIONS!
Comments contained in the body of this report are technical
opinions only. The material herein has been obtained
from sources believed to be reliable and accurate, however,
its accuracy and completeness cannot be guaranteed.
This site is not an investment advisor, hence it does
not endorse or recommend any securities or other investments.
Any recommendation contained in this report may not
be suitable for all investors and it is not to be deemed
an offer or solicitation on our part with respect to
the purchase or sale of any securities. All trademarks,
service marks and trade names appearing in this report
are the property of their respective owners, and are
likewise used for identification purposes only.
This report is a service available
only to active Paid Premium Members.
You may opt-out of receiving report notifications
at any time. Questions or comments may be submitted
by writing to Premium Membership Services 665 S.E. 10 Street, Suite 201 Deerfield Beach, FL 33441-5634 or by calling 1-800-965-8307
or 954-785-1121.
|
|
|

