***Last / Change / Volume data in this table is the closing quote data***
Symbol/Exchange
Company Name
Industry Group |
PRICE |
CHANGE
(%Change) |
Day High |
Volume
(% DAV)
(% 50 day avg vol) |
52 Wk Hi
% From Hi |
Featured
Date |
Price
Featured |
Pivot Featured |
|
Max Buy |
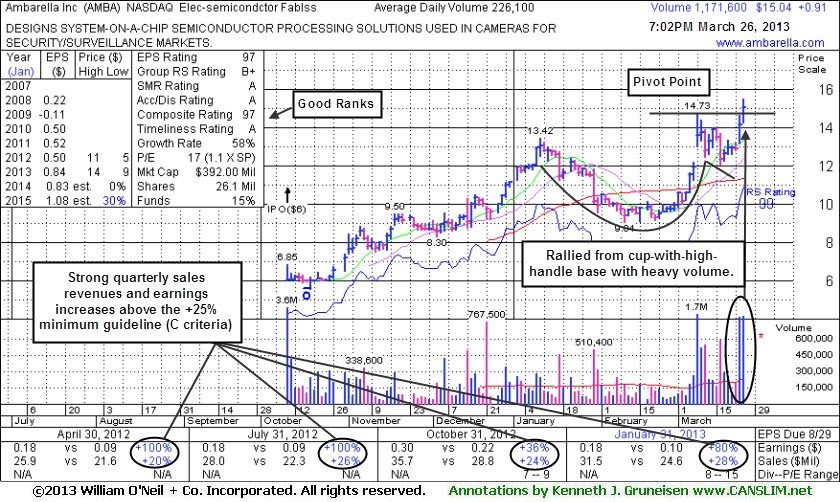
AMBA
-
NASDAQ
Ambarella Inc
ELECTRONICS - Semiconductor - Specialized
|
$15.04
|
+0.91
6.44% |
$15.47
|
1,171,674
518.21% of 50 DAV
50 DAV is 226,100
|
$14.73
2.10%
|
3/26/2013
|
$15.31
|
PP = $14.83
|
|
MB = $15.57
|
 Most Recent Note - 3/26/2013 7:23:01 PM
Y - Finished above its pivot point with a considerable gain backed by heavy volume triggering a technical buy signal. Hit a new 52 week high while rising from a cup-with-high-handle base. See the latest FSU analysis for more details and a new annotated graph.
>>> The latest Featured Stock Update with an annotated graph appeared on 3/26/2013. Click here.
View all notes |
Alert me of new notes |
CANSLIM.net Company Profile |
SEC |
Zacks Reports |
StockTalk |
News |
Chart |
Request a new note
C
A N
S L
I M


|
CELG
-
NASDAQ
Celgene Corp
DRUGS - Drug Manufacturers - Major
|
$112.47
|
+0.68
0.61% |
$113.39
|
2,364,906
67.27% of 50 DAV
50 DAV is 3,515,600
|
$115.44
-2.57%
|
12/11/2012
|
$82.24
|
PP = $81.34
|
|
MB = $85.41
|
Most Recent Note - 3/19/2013 5:34:37 PM
G - Hovering near its all-time high after 3 consecutive small losses. Very extended from any sound base. Its 50 DMA line defines important support to watch.
>>> The latest Featured Stock Update with an annotated graph appeared on 2/28/2013. Click here.
View all notes |
Alert me of new notes |
CANSLIM.net Company Profile |
SEC |
Zacks Reports |
StockTalk |
News |
Chart |
Request a new note
C
A N
S L
I M
|
CFNL
-
NASDAQ
Cardinal Financial Corp
BANKING - Regional - Southeast Banks
|
$18.23
|
+0.03
0.16% |
$18.38
|
140,275
65.46% of 50 DAV
50 DAV is 214,300
|
$18.40
-0.92%
|
3/22/2013
|
$17.99
|
PP = $18.29
|
|
MB = $19.20
|
Most Recent Note - 3/22/2013 8:19:04 PM
Y - Closed 3 weeks in a row in a very tight range forming an advanced "3-weeks tight" base. Color code is changed to yellow with new pivot point cited based on its 3/08/13 high plus 10 cents. Subsequent volume-driven gains into new high territory may trigger a new (or add-on) technical buy signal.
>>> The latest Featured Stock Update with an annotated graph appeared on 3/18/2013. Click here.
View all notes |
Alert me of new notes |
CANSLIM.net Company Profile |
SEC |
Zacks Reports |
StockTalk |
News |
Chart |
Request a new note
C
A N
S L
I M
|
CMCSA
-
NASDAQ
Comcast Corp Cl A
MEDIA - CATV Systems
|
$41.47
|
-0.25
-0.59% |
$42.00
|
12,964,870
92.13% of 50 DAV
50 DAV is 14,071,800
|
$42.00
-1.26%
|
12/3/2012
|
$37.08
|
PP = $38.06
|
|
MB = $39.96
|
Most Recent Note - 3/19/2013 5:32:52 PM
G - Testing support at its 50 DMA line while enduring mild distributional pressure. Relative Strength Rating has slumped to 75, below the 80+ guideline. Fundamental concerns remain since it reported earnings +11% on +6% sales revenues for the Dec '12 quarter. See latest FSU analysis for more details and a new annotated graph.
>>> The latest Featured Stock Update with an annotated graph appeared on 3/19/2013. Click here.
View all notes |
Alert me of new notes |
CANSLIM.net Company Profile |
SEC |
Zacks Reports |
StockTalk |
News |
Chart |
Request a new note
C
A N
S L
I M
|
CVLT
-
NASDAQ
Commvault Systems Inc
COMPUTER SOFTWARE and SERVICES - Business Software and Services
|
$82.00
|
+0.74
0.91% |
$82.76
|
272,743
37.20% of 50 DAV
50 DAV is 733,200
|
$86.89
-5.63%
|
3/14/2013
|
$84.71
|
PP = $79.63
|
|
MB = $83.61
|
Most Recent Note - 3/21/2013 7:10:56 PM
Y - Volume totals have been cooling while consolidating following its technical breakout on 3/14/13 with a solid gain backed by 4.5 times average volume. Prior highs define initial support to watch above its 50 DMA line.
>>> The latest Featured Stock Update with an annotated graph appeared on 3/14/2013. Click here.
View all notes |
Alert me of new notes |
CANSLIM.net Company Profile |
SEC |
Zacks Reports |
StockTalk |
News |
Chart |
Request a new note
C
A N
S L
I M
|
Symbol/Exchange
Company Name
Industry Group |
PRICE |
CHANGE
(%Change) |
Day High |
Volume
(% DAV)
(% 50 day avg vol) |
52 Wk Hi
% From Hi |
Featured
Date |
Price
Featured |
Pivot Featured |
|
Max Buy |
EVER
-
NYSE
Everbank Financial Corp
BANKING
|
$15.44
|
+0.19
1.25% |
$15.47
|
561,217
62.65% of 50 DAV
50 DAV is 895,800
|
$17.29
-10.70%
|
3/4/2013
|
$15.38
|
PP = $15.83
|
|
MB = $16.62
|
Most Recent Note - 3/22/2013 8:14:53 PM
G - Quietly consolidating near its 50 DMA line. That important short-term average has acted as support since damaging losses violated prior highs in the $16 area raising concerns while completely negating its prior technical breakout.
>>> The latest Featured Stock Update with an annotated graph appeared on 3/4/2013. Click here.
View all notes |
Alert me of new notes |
CANSLIM.net Company Profile |
SEC |
Zacks Reports |
StockTalk |
News |
Chart |
Request a new note
C
A N
S L
I M
|
FLT
-
NYSE
Fleetcor Technologies
DIVERSIFIED SERVICES - Business/Management Services
|
$76.69
|
+1.23
1.63% |
$77.46
|
911,207
124.06% of 50 DAV
50 DAV is 734,500
|
$76.88
-0.25%
|
3/21/2013
|
$71.14
|
PP = $73.00
|
|
MB = $76.65
|
Most Recent Note - 3/25/2013 12:14:11 PM
Y - Perched at its 52-week high today. Rallied above its pivot point with 2 consecutive volume-driven gains last week triggering a technical buy signal. Prior high in the $72 area defines near-term support to watch on pullbacks.
>>> The latest Featured Stock Update with an annotated graph appeared on 3/21/2013. Click here.
View all notes |
Alert me of new notes |
CANSLIM.net Company Profile |
SEC |
Zacks Reports |
StockTalk |
News |
Chart |
Request a new note
C
A N
S L
I M
|
JAZZ
-
NASDAQ
Jazz Pharmaceuticals Plc
DRUGS - Biotechnology
|
$56.01
|
-0.43
-0.76% |
$56.70
|
650,330
119.46% of 50 DAV
50 DAV is 544,400
|
$60.79
-7.86%
|
3/5/2013
|
$59.10
|
PP = $60.10
|
|
MB = $63.11
|
Most Recent Note - 3/22/2013 8:30:25 PM
G - Color code is changed to green after quietly slumping below its 50 DMA line this week raising concerns. Its Relative Strength rating has also slumped to 58, well below the 80+ minimum guideline for buy candidates. Completed a Secondary Offering on 3/05/13. It did not trigger a technical buy signal after its latest base.
>>> The latest Featured Stock Update with an annotated graph appeared on 3/7/2013. Click here.
View all notes |
Alert me of new notes |
CANSLIM.net Company Profile |
SEC |
Zacks Reports |
StockTalk |
News |
Chart |
Request a new note
C
A N
S L
I M
|
KORS
-
NYSE
Michael Kors Hldgs Ltd
RETAIL - Apparel Stores
|
$55.22
|
-0.20
-0.36% |
$55.80
|
3,842,274
63.30% of 50 DAV
50 DAV is 6,069,700
|
$65.10
-15.18%
|
1/23/2013
|
$54.98
|
PP = $58.72
|
|
MB = $61.66
|
Most Recent Note - 3/19/2013 5:35:59 PM
G - Color code is changed to green after slumping back below its 50 DMA line raising concerns. Completed another Secondary Offering 2/20/13 while perched near its all-time high.
>>> The latest Featured Stock Update with an annotated graph appeared on 3/8/2013. Click here.
View all notes |
Alert me of new notes |
CANSLIM.net Company Profile |
SEC |
Zacks Reports |
StockTalk |
News |
Chart |
Request a new note
C
A N
S L
I M
|
LNKD
-
NYSE
Linkedin Corp Class A
INTERNET - Internet Information Providers
|
$176.05
|
+0.22
0.13% |
$177.48
|
1,386,207
55.86% of 50 DAV
50 DAV is 2,481,400
|
$184.15
-4.40%
|
2/8/2013
|
$147.04
|
PP = $127.55
|
|
MB = $133.93
|
Most Recent Note - 3/25/2013 8:33:09 PM
G - Erased most of the prior session's gain, retreating from its best-ever close with volume near average behind today's loss. Very extended from its prior base, meanwhile its 50 DMA line defines important near term support to watch on pullbacks.
>>> The latest Featured Stock Update with an annotated graph appeared on 3/11/2013. Click here.
View all notes |
Alert me of new notes |
CANSLIM.net Company Profile |
SEC |
Zacks Reports |
StockTalk |
News |
Chart |
Request a new note
C
A N
S L
I M
|
Symbol/Exchange
Company Name
Industry Group |
PRICE |
CHANGE
(%Change) |
Day High |
Volume
(% DAV)
(% 50 day avg vol) |
52 Wk Hi
% From Hi |
Featured
Date |
Price
Featured |
Pivot Featured |
|
Max Buy |
LOPE
-
NASDAQ
Grand Canyon Education
DIVERSIFIED SERVICES - Education and; Training Services
|
$24.80
|
-0.10
-0.40% |
$25.02
|
334,884
75.66% of 50 DAV
50 DAV is 442,600
|
$27.18
-8.76%
|
2/20/2013
|
$26.44
|
PP = $25.10
|
|
MB = $26.36
|
Most Recent Note - 3/20/2013 5:20:00 PM
G - Rising from its 50 DMA line with light volume behind its recent gains. Volume totals have cooled in recent weeks after it quickly negated the prior technical breakout. It has not formed a sound new base.
>>> The latest Featured Stock Update with an annotated graph appeared on 3/13/2013. Click here.
View all notes |
Alert me of new notes |
CANSLIM.net Company Profile |
SEC |
Zacks Reports |
StockTalk |
News |
Chart |
Request a new note
C
A N
S L
I M
|
MIDD
-
NASDAQ
Middleby Corp
MANUFACTURING - Diversified Machinery
|
$150.26
|
+1.29
0.87% |
$150.91
|
66,194
70.49% of 50 DAV
50 DAV is 93,900
|
$154.74
-2.90%
|
10/8/2012
|
$118.46
|
PP = $122.67
|
|
MB = $128.80
|
Most Recent Note - 3/25/2013 9:01:47 PM
G - Recently staying in tight trading range near all-time highs, stubbornly holding its ground. Fundamental concerns were recently noted. See latest FSU analysis for more details and a new annotated graph.
>>> The latest Featured Stock Update with an annotated graph appeared on 3/25/2013. Click here.
View all notes |
Alert me of new notes |
CANSLIM.net Company Profile |
SEC |
Zacks Reports |
StockTalk |
News |
Chart |
Request a new note
C
A N
S L
I M
|
MNTX
-
NASDAQ
Manitex International
MANUFACTURING - Diversified Machinery
|
$12.03
|
-0.42
-3.37% |
$13.08
|
332,899
190.66% of 50 DAV
50 DAV is 174,600
|
$13.14
-8.45%
|
3/20/2013
|
$11.29
|
PP = $12.05
|
|
MB = $12.65
|
Most Recent Note - 3/26/2013 12:29:07 PM
Y - Reversed from the session's early highs which had it again briefly trading above the "max buy" level. A considerable gain with heavy volume cleared its pivot point and triggered a technical buy signal on the prior session. Disciplined investors avoid chasing stocks extended more than +5% above their pivot point.
>>> The latest Featured Stock Update with an annotated graph appeared on 3/20/2013. Click here.
View all notes |
Alert me of new notes |
CANSLIM.net Company Profile |
SEC |
Zacks Reports |
StockTalk |
News |
Chart |
Request a new note
C
A N
S L
I M
|
MRLN
-
NASDAQ
Marlin Business Services
DIVERSIFIED SERVICES - Rental and Leasing Services
|
$23.58
|
+0.42
1.81% |
$23.62
|
19,185
81.29% of 50 DAV
50 DAV is 23,600
|
$23.65
-0.30%
|
3/15/2013
|
$22.29
|
PP = $23.18
|
|
MB = $24.34
|
Most Recent Note - 3/25/2013 8:45:21 PM
Y - Volume was +45% above average behind today's 6th consecutive gain as it hit a new 52-week high and finished at its best close of the year. The recent action is indicative of institutional accumulation, however it closed the session 2 cents below the pivot point cited. Subsequent volume-driven gains above the pivot point could help clinch a more convincing technical buy signal.
>>> The latest Featured Stock Update with an annotated graph appeared on 3/15/2013. Click here.
View all notes |
Alert me of new notes |
CANSLIM.net Company Profile |
SEC |
Zacks Reports |
StockTalk |
News |
Chart |
Request a new note
C
A N
S L
I M
|
MWIV
-
NASDAQ
M W I Veterinary Supply
HEALTH SERVICES - Medical Instruments and; Supplies
|
$134.25
|
+2.20
1.67% |
$134.64
|
25,281
44.20% of 50 DAV
50 DAV is 57,200
|
$137.18
-2.14%
|
3/4/2013
|
$130.90
|
PP = $129.45
|
|
MB = $135.92
|
Most Recent Note - 3/22/2013 8:09:58 PM
Y - Pulled back today with above average volume, consolidating above its pivot point. Disciplined investors limit loses by selling if ever any stock fall more than -7% from their purchase price.
>>> The latest Featured Stock Update with an annotated graph appeared on 3/6/2013. Click here.
View all notes |
Alert me of new notes |
CANSLIM.net Company Profile |
SEC |
Zacks Reports |
StockTalk |
News |
Chart |
Request a new note
C
A N
S L
I M
|
Symbol/Exchange
Company Name
Industry Group |
PRICE |
CHANGE
(%Change) |
Day High |
Volume
(% DAV)
(% 50 day avg vol) |
52 Wk Hi
% From Hi |
Featured
Date |
Price
Featured |
Pivot Featured |
|
Max Buy |
N
-
NYSE
Netsuite Inc
DIVERSIFIED SERVICES - Business/Management Services
|
$77.83
|
+0.36
0.46% |
$78.35
|
208,751
57.81% of 50 DAV
50 DAV is 361,100
|
$78.55
-0.92%
|
12/12/2012
|
$64.75
|
PP = $67.12
|
|
MB = $70.48
|
Most Recent Note - 3/22/2013 8:22:33 PM
G - Perched at its 52-week and all-time high, holding its ground after another gain backed by above average volume on the prior session. Its 50 DMA line acted as support during the recent consolidation.
>>> The latest Featured Stock Update with an annotated graph appeared on 3/1/2013. Click here.
View all notes |
Alert me of new notes |
CANSLIM.net Company Profile |
SEC |
Zacks Reports |
StockTalk |
News |
Chart |
Request a new note
C
A N
S L
I M
|
NSR
-
NYSE
Neustar Inc
TELECOMMUNICATIONS - Diversified Communication Serv
|
$46.05
|
+1.07
2.38% |
$46.08
|
700,094
163.42% of 50 DAV
50 DAV is 428,400
|
$47.24
-2.52%
|
3/8/2013
|
$44.99
|
PP = $47.34
|
|
MB = $49.71
|
Most Recent Note - 3/22/2013 8:26:36 PM
Y - Its Relative Strength rating has slumped to 75, below the 80+ minimum guideline for buy candidates, while quietly consolidating this week near its 50 DMA line which has acted as support. Volume-driven gains above the pivot point may trigger a new (or add-on) technical buy signal. The 2/21/13 low ($42.40) defines important near-term support where any subsequent deterioration would raise greater concerns and trigger a worrisome technical sell signal.
>>> The latest Featured Stock Update with an annotated graph appeared on 2/27/2013. Click here.
View all notes |
Alert me of new notes |
CANSLIM.net Company Profile |
SEC |
Zacks Reports |
StockTalk |
News |
Chart |
Request a new note
C
A N
S L
I M
|
SLCA
-
NYSE
U S Silica Holdings Inc
CHEMICALS - Specialty Chemicals
|
$22.19
|
-0.87
-3.77% |
$23.26
|
1,817,168
181.35% of 50 DAV
50 DAV is 1,002,000
|
$28.50
-22.14%
|
2/26/2013
|
$22.23
|
PP = $21.50
|
|
MB = $22.58
|
Most Recent Note - 3/25/2013 8:39:57 PM
G - Fell today with above average volume but ended near the middle of its intra-day range. Recently rebounding from damaging losses since completing a Secondary Offering on 3/14/13. Previously noted - "Very extended from its prior base, but having rallied more than +20% in the first 2-3 weeks after its breakout, the investment system rules suggest holding such winners for a minimum of 8 weeks."
>>> The latest Featured Stock Update with an annotated graph appeared on 3/22/2013. Click here.
View all notes |
Alert me of new notes |
CANSLIM.net Company Profile |
SEC |
Zacks Reports |
StockTalk |
News |
Chart |
Request a new note
C
A N
S L
I M
|
VRX
-
NYSE
Valeant Pharmaceuticals
DRUGS - Drug Manufacturers - Other
|
$74.40
|
+0.45
0.61% |
$74.48
|
774,675
61.53% of 50 DAV
50 DAV is 1,259,100
|
$74.81
-0.55%
|
12/20/2012
|
$60.24
|
PP = $61.21
|
|
MB = $64.27
|
Most Recent Note - 3/20/2013 12:52:11 PM
G - Hitting yet another new high with today's 3rd consecutive gain, getting very extended from the secondary buy point noted earlier. The 50 DMA line and recent low ($64.05 on 2/21/13) define important support areas to watch on pullbacks.
>>> The latest Featured Stock Update with an annotated graph appeared on 3/12/2013. Click here.
View all notes |
Alert me of new notes |
CANSLIM.net Company Profile |
SEC |
Zacks Reports |
StockTalk |
News |
Chart |
Request a new note
C
A N
S L
I M
|