You are not logged in.
This means you
CAN ONLY VIEW reports that were published prior to Sunday, March 30, 2025.
You
MUST UPGRADE YOUR MEMBERSHIP if you want to see any current reports.
AFTER MARKET UPDATE - MONDAY, MARCH 25TH, 2013
Previous After Market Report Next After Market Report >>>
|
|
|
|
DOW |
-64.28 |
14,447.75 |
-0.44% |
|
Volume |
659,511,090 |
+6% |
|
Volume |
1,607,135,660 |
-0% |
|
NASDAQ |
-9.70 |
3,235.30 |
-0.30% |
|
Advancers |
1,222 |
39% |
|
Advancers |
1,160 |
46% |
|
S&P 500 |
-5.20 |
1,551.69 |
-0.33% |
|
Decliners |
1,789 |
57% |
|
Decliners |
1,265 |
50% |
|
Russell 2000 |
-0.42 |
945.85 |
-0.04% |
|
52 Wk Highs |
315 |
|
|
52 Wk Highs |
185 |
|
|
S&P 600 |
-0.29 |
528.33 |
-0.05% |
|
52 Wk Lows |
25 |
|
|
52 Wk Lows |
24 |
|
|
 |
Major Averages Erased Early Gains and Ended Lower
Kenneth J. Gruneisen - Passed the CAN SLIM® Master's Exam
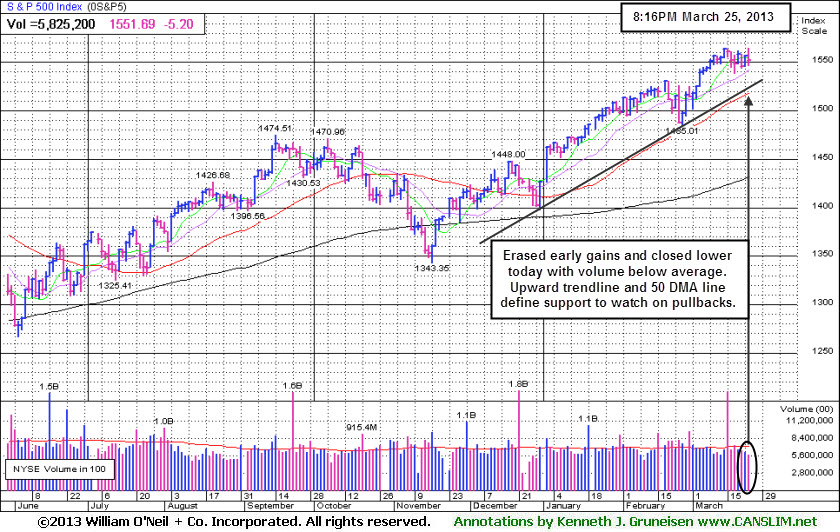
The major averages gave up early gains and ended lower on Monday. Decliners led advancers by a 3-2 margin on the NYSE while the mix was closer to even on the Nasdaq exchange. The volume total was reported higher than the prior session total on the NYSE while the volume total on the Nasdaq exchange was very near the prior session total. The total number of stocks hitting new 52-week highs expanded and new highs easily outnumbered new 52-week lows on the NYSE and on the Nasdaq exchange. There were 92 high-ranked companies from the CANSLIM.net Leaders List making new 52-week highs and appearing on the CANSLIM.net BreakOuts Page, up considerably from the prior session total of 57 stocks. There were gains for 7 of the 18 high-ranked companies currently included on the Featured Stocks Page.
Fed Chairman Ben Bernanke said that low interest rates in advanced nations benefit the world economy while not creating a disruptive diversion of trade through weaker currencies. New York Fed President William Dudley also said in a speech in New York that he sees the U.S. labor market improving but slowing, warranting a continuation of "very accommodative" policy. Stocks turned lower after Jeroen Dijsselbloem, who heads the Eurogroup of euro-zone finance ministers, said that when failing banks need rescuing, euro-zone officials would turn to the bank's shareholders, bondholders and uninsured depositors to contribute to their recapitalization.
All 10 S&P 500 sectors declined, however there were a few well known names that tallied gains on Monday. Shares of Dell (DELL +2.62%) rose after the PC maker confirmed it received bids from Blackstone Group and activist investor Carl Icahn to buy the company. Vodafone Group Plc (VOD +1.36%) edged higher amid reports it may sell its stake in Verizon Wireless. Discount retailer Dollar General Corp (DG +2.02%) rallied after quarterly results topped analyst projections. University of Phoenix owner Apollo Group (APOL +7.1%) rallied after the company reported a better-than-expected profit even as student sign-ups fell for the fourth straight quarter. The stock was the S&P 500's biggest percentage gainer.
New buying efforts are justified under the fact-based system since a follow-through day on 3/05/13 shifted the market's (M criteria) direction to a confirmed rally again after a brief correction. Any sustainable rally requires a healthy crop of companies hitting new 52-week highs, so it is always essential to see meaningful leadership (stocks hitting new 52-week highs).
Watch for an announcement via email concerning the next WEBCAST. The webcast will also be available via an updated link highlighted at the top of the Premium Member Homepage.
PICTURED: The S&P 500 Index erased the session's earlier gains that drove it to within less than a point away from its record close.
|
 Kenneth J. Gruneisen started out as a licensed stockbroker in August 1987, a couple of months prior to the historic stock market crash that took the Dow Jones Industrial Average down -22.6% in a single day. He has published daily fact-based fundamental and technical analysis on high-ranked stocks online for two decades. Through FACTBASEDINVESTING.COM, Kenneth provides educational articles, news, market commentary, and other information regarding proven investment systems that work in good times and bad.
Comments contained in the body of this report are technical opinions only and are not necessarily those of Gruneisen Growth Corp. The material herein has been obtained from sources believed to be reliable and accurate, however, its accuracy and completeness cannot be guaranteed. Our firm, employees, and customers may effect transactions, including transactions contrary to any recommendation herein, or have positions in the securities mentioned herein or options with respect thereto. Any recommendation contained in this report may not be suitable for all investors and it is not to be deemed an offer or solicitation on our part with respect to the purchase or sale of any securities. |
|
 |
Financial, Tech, and Defensive Groups Ended Lower
Kenneth J. Gruneisen - Passed the CAN SLIM® Master's Exam
Financial shares created a drag on the major averages as the Broker/Dealer Index ($XBD -1.20%) outpaced the Bank Index ($BKX -0.32%) to the downside. Defensive groups were led lower by the Gold & Silver Index ($XAU -1.09%), followed by the Healthcare Index ($HMO -0.19%) with a smaller loss. The tech sector had a negative bias as the Biotechnology Index ($BTK -0.71%), Internet Index ($IIX -0.70%), Networking Index ($NWX -0.27%), and Semiconductor Index ($SOX -0.21%) ended with unanimous but small losses of less than -1%. The Retail Index ($RLX -0.05%) and the Oil Services Index ($OSX +0.01%) finished flat while the Integrated Oil Index ($XOI -0.55%) also edged lower on the mostly negative session for the industry groups regularly studied in this Industry Group Watch section.
Charts courtesy www.stockcharts.com
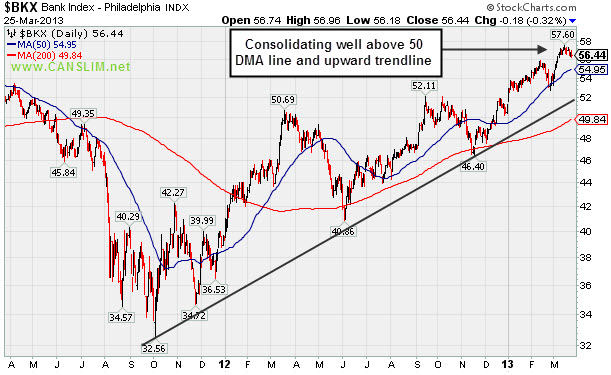
PICTURED: The Bank Index ($BKX -0.32%) is consolidating well above its 50-day moving average (DMA) line and an upward trendline connecting prior chart lows.
| Oil Services |
$OSX |
239.61 |
+0.03 |
+0.01% |
+8.83% |
| Healthcare |
$HMO |
2,729.55 |
-5.11 |
-0.19% |
+8.57% |
| Integrated Oil |
$XOI |
1,350.06 |
-7.50 |
-0.55% |
+8.72% |
| Semiconductor |
$SOX |
429.17 |
-0.91 |
-0.21% |
+11.75% |
| Networking |
$NWX |
232.63 |
-0.63 |
-0.27% |
+2.69% |
| Internet |
$IIX |
358.98 |
-2.54 |
-0.70% |
+9.78% |
| Broker/Dealer |
$XBD |
107.73 |
-1.31 |
-1.20% |
+14.20% |
| Retail |
$RLX |
720.73 |
-0.37 |
-0.05% |
+10.36% |
| Gold & Silver |
$XAU |
135.47 |
-1.49 |
-1.09% |
-18.19% |
| Bank |
$BKX |
56.44 |
-0.18 |
-0.32% |
+10.06% |
| Biotech |
$BTK |
1,778.91 |
-12.74 |
-0.71% |
+14.99% |
|
|
|
 |
Resilient Leader Still Near Highs After Fundamental Flaws Raised Concerns
Kenneth J. Gruneisen - Passed the CAN SLIM® Master's Exam
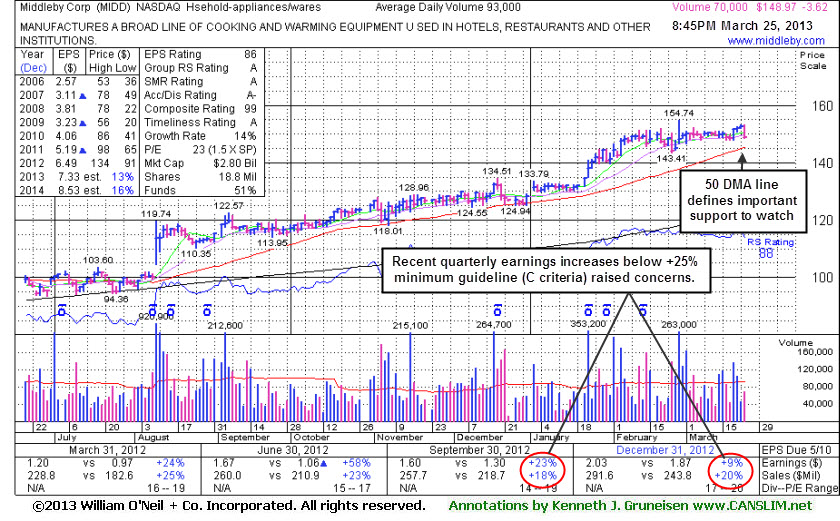
Middleby Corp (MIDD -$3.62 or -2.37% to $148.97) has been recently staying in tight trading range near all-time highs, stubbornly holding its ground. Fundamental concerns were recently noted. Its 50-day moving average (DMA) line defines important near-term chart support. Its last appearance in this FSU section was on 2/25/13 with an annotated graph under the headline, "Negative Reversals Emphasize Distributional Action", however it followed with additional volume-driven gains into new high territory after prior reports noted - "Disciplined investors may watch closely for sell signals if holding it and giving it a chance to produce more climactic gains."
Earnings +9% on +20% sales for the Dec '12 quarter marked its 2nd consecutive quarterly comparison with an earnings increase below the +25% minimum earnings guideline (C criteria), raising more concerns. The number of top-rated funds owning its shares rose from 351 in Dec '11 to 413 in Dec '12, a reassuring sign concerning the I criteria. Its current Up/Down Volume Ratio of 2.0 is still an unbiased indication its shares have been under accumulation over the past 50 days. Its small supply (S criteria) of only 17.1 million shares in the public float can contribute to greater price volatility in the event of institutional buying or selling.
MIDD has traded up as much as +29% since first highlighted in yellow in the 8/09/12 mid-day report as it gapped up and broke out from a long flat base with a considerable gain 9 times average volume. Prior reports cautioned members - "Investors who are disciplined, selective, and patient would likely watch for a fresh breakout in another high-ranked stock without any fundamental flaws, rather than looking for excuses to buy one that has flaws."
 |
|
|
Color Codes Explained :
Y - Better candidates highlighted by our
staff of experts.
G - Previously featured
in past reports as yellow but may no longer be buyable under the
guidelines.
***Last / Change / Volume data in this table is the closing quote data***
Symbol/Exchange
Company Name
Industry Group |
PRICE |
CHANGE
(%Change) |
Day High |
Volume
(% DAV)
(% 50 day avg vol) |
52 Wk Hi
% From Hi |
Featured
Date |
Price
Featured |
Pivot Featured |
|
Max Buy |
CELG
-
NASDAQ
Celgene Corp
DRUGS - Drug Manufacturers - Major
|
$111.79
|
-1.34
-1.18% |
$113.71
|
2,606,955
72.55% of 50 DAV
50 DAV is 3,593,400
|
$115.44
-3.16%
|
12/11/2012
|
$82.24
|
PP = $81.34
|
|
MB = $85.41
|
Most Recent Note - 3/19/2013 5:34:37 PM
G - Hovering near its all-time high after 3 consecutive small losses. Very extended from any sound base. Its 50 DMA line defines important support to watch.
>>> The latest Featured Stock Update with an annotated graph appeared on 2/28/2013. Click here.
View all notes |
Alert me of new notes |
CANSLIM.net Company Profile |
SEC |
Zacks Reports |
StockTalk |
News |
Chart |
Request a new note
C
A N
S L
I M


|
CFNL
-
NASDAQ
Cardinal Financial Corp
BANKING - Regional - Southeast Banks
|
$18.20
|
+0.21
1.17% |
$18.40
|
239,940
111.81% of 50 DAV
50 DAV is 214,600
|
$18.19
0.05%
|
3/22/2013
|
$17.99
|
PP = $18.29
|
|
MB = $19.20
|
Most Recent Note - 3/22/2013 8:19:04 PM
Y - Closed 3 weeks in a row in a very tight range forming an advanced "3-weeks tight" base. Color code is changed to yellow with new pivot point cited based on its 3/08/13 high plus 10 cents. Subsequent volume-driven gains into new high territory may trigger a new (or add-on) technical buy signal.
>>> The latest Featured Stock Update with an annotated graph appeared on 3/18/2013. Click here.
View all notes |
Alert me of new notes |
CANSLIM.net Company Profile |
SEC |
Zacks Reports |
StockTalk |
News |
Chart |
Request a new note
C
A N
S L
I M
|
CMCSA
-
NASDAQ
Comcast Corp Cl A
MEDIA - CATV Systems
|
$41.72
|
+0.50
1.20% |
$41.82
|
21,844,003
157.78% of 50 DAV
50 DAV is 13,844,900
|
$42.00
-0.68%
|
12/3/2012
|
$37.08
|
PP = $38.06
|
|
MB = $39.96
|
Most Recent Note - 3/19/2013 5:32:52 PM
G - Testing support at its 50 DMA line while enduring mild distributional pressure. Relative Strength Rating has slumped to 75, below the 80+ guideline. Fundamental concerns remain since it reported earnings +11% on +6% sales revenues for the Dec '12 quarter. See latest FSU analysis for more details and a new annotated graph.
>>> The latest Featured Stock Update with an annotated graph appeared on 3/19/2013. Click here.
View all notes |
Alert me of new notes |
CANSLIM.net Company Profile |
SEC |
Zacks Reports |
StockTalk |
News |
Chart |
Request a new note
C
A N
S L
I M
|
CVLT
-
NASDAQ
Commvault Systems Inc
COMPUTER SOFTWARE and SERVICES - Business Software and Services
|
$81.26
|
-0.66
-0.81% |
$82.89
|
382,414
52.03% of 50 DAV
50 DAV is 735,000
|
$86.89
-6.48%
|
3/14/2013
|
$84.71
|
PP = $79.63
|
|
MB = $83.61
|
Most Recent Note - 3/21/2013 7:10:56 PM
Y - Volume totals have been cooling while consolidating following its technical breakout on 3/14/13 with a solid gain backed by 4.5 times average volume. Prior highs define initial support to watch above its 50 DMA line.
>>> The latest Featured Stock Update with an annotated graph appeared on 3/14/2013. Click here.
View all notes |
Alert me of new notes |
CANSLIM.net Company Profile |
SEC |
Zacks Reports |
StockTalk |
News |
Chart |
Request a new note
C
A N
S L
I M
|
EVER
-
NYSE
Everbank Financial Corp
BANKING
|
$15.25
|
+0.02
0.13% |
$15.31
|
820,232
91.89% of 50 DAV
50 DAV is 892,600
|
$17.29
-11.80%
|
3/4/2013
|
$15.38
|
PP = $15.83
|
|
MB = $16.62
|
Most Recent Note - 3/22/2013 8:14:53 PM
G - Quietly consolidating near its 50 DMA line. That important short-term average has acted as support since damaging losses violated prior highs in the $16 area raising concerns while completely negating its prior technical breakout.
>>> The latest Featured Stock Update with an annotated graph appeared on 3/4/2013. Click here.
View all notes |
Alert me of new notes |
CANSLIM.net Company Profile |
SEC |
Zacks Reports |
StockTalk |
News |
Chart |
Request a new note
C
A N
S L
I M
|
Symbol/Exchange
Company Name
Industry Group |
PRICE |
CHANGE
(%Change) |
Day High |
Volume
(% DAV)
(% 50 day avg vol) |
52 Wk Hi
% From Hi |
Featured
Date |
Price
Featured |
Pivot Featured |
|
Max Buy |
FLT
-
NYSE
Fleetcor Technologies
DIVERSIFIED SERVICES - Business/Management Services
|
$75.46
|
-0.36
-0.47% |
$76.88
|
982,113
135.11% of 50 DAV
50 DAV is 726,900
|
$76.00
-0.71%
|
3/21/2013
|
$71.14
|
PP = $73.00
|
|
MB = $76.65
|
 Most Recent Note - 3/25/2013 12:14:11 PM
Y - Perched at its 52-week high today. Rallied above its pivot point with 2 consecutive volume-driven gains last week triggering a technical buy signal. Prior high in the $72 area defines near-term support to watch on pullbacks.
>>> The latest Featured Stock Update with an annotated graph appeared on 3/21/2013. Click here.
View all notes |
Alert me of new notes |
CANSLIM.net Company Profile |
SEC |
Zacks Reports |
StockTalk |
News |
Chart |
Request a new note
C
A N
S L
I M
|
JAZZ
-
NASDAQ
Jazz Pharmaceuticals Plc
DRUGS - Biotechnology
|
$56.44
|
-0.54
-0.95% |
$57.51
|
481,288
88.65% of 50 DAV
50 DAV is 542,900
|
$60.79
-7.16%
|
3/5/2013
|
$59.10
|
PP = $60.10
|
|
MB = $63.11
|
Most Recent Note - 3/22/2013 8:30:25 PM
G - Color code is changed to green after quietly slumping below its 50 DMA line this week raising concerns. Its Relative Strength rating has also slumped to 58, well below the 80+ minimum guideline for buy candidates. Completed a Secondary Offering on 3/05/13. It did not trigger a technical buy signal after its latest base.
>>> The latest Featured Stock Update with an annotated graph appeared on 3/7/2013. Click here.
View all notes |
Alert me of new notes |
CANSLIM.net Company Profile |
SEC |
Zacks Reports |
StockTalk |
News |
Chart |
Request a new note
C
A N
S L
I M
|
KORS
-
NYSE
Michael Kors Hldgs Ltd
RETAIL - Apparel Stores
|
$55.42
|
-0.19
-0.34% |
$56.75
|
2,716,940
44.56% of 50 DAV
50 DAV is 6,097,900
|
$65.10
-14.87%
|
1/23/2013
|
$54.98
|
PP = $58.72
|
|
MB = $61.66
|
Most Recent Note - 3/19/2013 5:35:59 PM
G - Color code is changed to green after slumping back below its 50 DMA line raising concerns. Completed another Secondary Offering 2/20/13 while perched near its all-time high.
>>> The latest Featured Stock Update with an annotated graph appeared on 3/8/2013. Click here.
View all notes |
Alert me of new notes |
CANSLIM.net Company Profile |
SEC |
Zacks Reports |
StockTalk |
News |
Chart |
Request a new note
C
A N
S L
I M
|
LNKD
-
NYSE
Linkedin Corp Class A
INTERNET - Internet Information Providers
|
$175.83
|
-5.65
-3.11% |
$182.29
|
2,423,860
97.19% of 50 DAV
50 DAV is 2,494,000
|
$184.15
-4.52%
|
2/8/2013
|
$147.04
|
PP = $127.55
|
|
MB = $133.93
|
Most Recent Note - 3/25/2013 8:33:09 PM
G - Erased most of the prior session's gain, retreating from its best-ever close with volume near average behind today's loss. Very extended from its prior base, meanwhile its 50 DMA line defines important near term support to watch on pullbacks.
>>> The latest Featured Stock Update with an annotated graph appeared on 3/11/2013. Click here.
View all notes |
Alert me of new notes |
CANSLIM.net Company Profile |
SEC |
Zacks Reports |
StockTalk |
News |
Chart |
Request a new note
C
A N
S L
I M
|
LOPE
-
NASDAQ
Grand Canyon Education
DIVERSIFIED SERVICES - Education and; Training Services
|
$24.90
|
-0.07
-0.28% |
$25.44
|
272,804
61.36% of 50 DAV
50 DAV is 444,600
|
$27.18
-8.39%
|
2/20/2013
|
$26.44
|
PP = $25.10
|
|
MB = $26.36
|
Most Recent Note - 3/20/2013 5:20:00 PM
G - Rising from its 50 DMA line with light volume behind its recent gains. Volume totals have cooled in recent weeks after it quickly negated the prior technical breakout. It has not formed a sound new base.
>>> The latest Featured Stock Update with an annotated graph appeared on 3/13/2013. Click here.
View all notes |
Alert me of new notes |
CANSLIM.net Company Profile |
SEC |
Zacks Reports |
StockTalk |
News |
Chart |
Request a new note
C
A N
S L
I M
|
Symbol/Exchange
Company Name
Industry Group |
PRICE |
CHANGE
(%Change) |
Day High |
Volume
(% DAV)
(% 50 day avg vol) |
52 Wk Hi
% From Hi |
Featured
Date |
Price
Featured |
Pivot Featured |
|
Max Buy |
MIDD
-
NASDAQ
Middleby Corp
MANUFACTURING - Diversified Machinery
|
$148.97
|
-3.62
-2.37% |
$153.28
|
70,035
75.31% of 50 DAV
50 DAV is 93,000
|
$154.74
-3.73%
|
10/8/2012
|
$118.46
|
PP = $122.67
|
|
MB = $128.80
|
Most Recent Note - 3/25/2013 9:01:47 PM
G - Recently staying in tight trading range near all-time highs, stubbornly holding its ground. Fundamental concerns were recently noted. See latest FSU analysis for more details and a new annotated graph.
>>> The latest Featured Stock Update with an annotated graph appeared on 3/25/2013. Click here.
View all notes |
Alert me of new notes |
CANSLIM.net Company Profile |
SEC |
Zacks Reports |
StockTalk |
News |
Chart |
Request a new note
C
A N
S L
I M
|
MNTX
-
NASDAQ
Manitex International
MANUFACTURING - Diversified Machinery
|
$12.45
|
+0.68
5.78% |
$13.14
|
732,320
449.28% of 50 DAV
50 DAV is 163,000
|
$11.95
4.18%
|
3/20/2013
|
$11.29
|
PP = $12.05
|
|
MB = $12.65
|
Most Recent Note - 3/25/2013 12:35:56 PM
Y - Tallying a considerable gain today with heavy volume while blasting above its pivot point triggering a technical buy signal and quickly trading near and slightly above its "max buy" level. Disciplined investors avoid chasing stocks extended more than +5% above their pivot point.
>>> The latest Featured Stock Update with an annotated graph appeared on 3/20/2013. Click here.
View all notes |
Alert me of new notes |
CANSLIM.net Company Profile |
SEC |
Zacks Reports |
StockTalk |
News |
Chart |
Request a new note
C
A N
S L
I M
|
MRLN
-
NASDAQ
Marlin Business Services
DIVERSIFIED SERVICES - Rental and Leasing Services
|
$23.16
|
+0.83
3.72% |
$23.65
|
33,262
144.62% of 50 DAV
50 DAV is 23,000
|
$23.08
0.35%
|
3/15/2013
|
$22.29
|
PP = $23.18
|
|
MB = $24.34
|
Most Recent Note - 3/25/2013 8:45:21 PM
Y - Volume was +45% above average behind today's 6th consecutive gain as it hit a new 52-week high and finished at its best close of the year. The recent action is indicative of institutional accumulation, however it closed the session 2 cents below the pivot point cited. Subsequent volume-driven gains above the pivot point could help clinch a more convincing technical buy signal.
>>> The latest Featured Stock Update with an annotated graph appeared on 3/15/2013. Click here.
View all notes |
Alert me of new notes |
CANSLIM.net Company Profile |
SEC |
Zacks Reports |
StockTalk |
News |
Chart |
Request a new note
C
A N
S L
I M
|
MWIV
-
NASDAQ
M W I Veterinary Supply
HEALTH SERVICES - Medical Instruments and; Supplies
|
$132.05
|
+1.35
1.03% |
$133.52
|
37,879
66.45% of 50 DAV
50 DAV is 57,000
|
$137.18
-3.74%
|
3/4/2013
|
$130.90
|
PP = $129.45
|
|
MB = $135.92
|
Most Recent Note - 3/22/2013 8:09:58 PM
Y - Pulled back today with above average volume, consolidating above its pivot point. Disciplined investors limit loses by selling if ever any stock fall more than -7% from their purchase price.
>>> The latest Featured Stock Update with an annotated graph appeared on 3/6/2013. Click here.
View all notes |
Alert me of new notes |
CANSLIM.net Company Profile |
SEC |
Zacks Reports |
StockTalk |
News |
Chart |
Request a new note
C
A N
S L
I M
|
N
-
NYSE
Netsuite Inc
DIVERSIFIED SERVICES - Business/Management Services
|
$77.47
|
-0.52
-0.67% |
$78.35
|
201,665
55.91% of 50 DAV
50 DAV is 360,700
|
$78.55
-1.37%
|
12/12/2012
|
$64.75
|
PP = $67.12
|
|
MB = $70.48
|
Most Recent Note - 3/22/2013 8:22:33 PM
G - Perched at its 52-week and all-time high, holding its ground after another gain backed by above average volume on the prior session. Its 50 DMA line acted as support during the recent consolidation.
>>> The latest Featured Stock Update with an annotated graph appeared on 3/1/2013. Click here.
View all notes |
Alert me of new notes |
CANSLIM.net Company Profile |
SEC |
Zacks Reports |
StockTalk |
News |
Chart |
Request a new note
C
A N
S L
I M
|
Symbol/Exchange
Company Name
Industry Group |
PRICE |
CHANGE
(%Change) |
Day High |
Volume
(% DAV)
(% 50 day avg vol) |
52 Wk Hi
% From Hi |
Featured
Date |
Price
Featured |
Pivot Featured |
|
Max Buy |
NSR
-
NYSE
Neustar Inc
TELECOMMUNICATIONS - Diversified Communication Serv
|
$44.98
|
+0.03
0.07% |
$45.13
|
394,259
91.60% of 50 DAV
50 DAV is 430,400
|
$47.24
-4.78%
|
3/8/2013
|
$44.99
|
PP = $47.34
|
|
MB = $49.71
|
Most Recent Note - 3/22/2013 8:26:36 PM
Y - Its Relative Strength rating has slumped to 75, below the 80+ minimum guideline for buy candidates, while quietly consolidating this week near its 50 DMA line which has acted as support. Volume-driven gains above the pivot point may trigger a new (or add-on) technical buy signal. The 2/21/13 low ($42.40) defines important near-term support where any subsequent deterioration would raise greater concerns and trigger a worrisome technical sell signal.
>>> The latest Featured Stock Update with an annotated graph appeared on 2/27/2013. Click here.
View all notes |
Alert me of new notes |
CANSLIM.net Company Profile |
SEC |
Zacks Reports |
StockTalk |
News |
Chart |
Request a new note
C
A N
S L
I M
|
SLCA
-
NYSE
U S Silica Holdings Inc
CHEMICALS - Specialty Chemicals
|
$23.06
|
-0.70
-2.95% |
$24.05
|
1,239,373
125.25% of 50 DAV
50 DAV is 989,500
|
$28.50
-19.09%
|
2/26/2013
|
$22.23
|
PP = $21.50
|
|
MB = $22.58
|
Most Recent Note - 3/25/2013 8:39:57 PM
G - Fell today with above average volume but ended near the middle of its intra-day range. Recently rebounding from damaging losses since completing a Secondary Offering on 3/14/13. Previously noted - "Very extended from its prior base, but having rallied more than +20% in the first 2-3 weeks after its breakout, the investment system rules suggest holding such winners for a minimum of 8 weeks."
>>> The latest Featured Stock Update with an annotated graph appeared on 3/22/2013. Click here.
View all notes |
Alert me of new notes |
CANSLIM.net Company Profile |
SEC |
Zacks Reports |
StockTalk |
News |
Chart |
Request a new note
C
A N
S L
I M
|
VRX
-
NYSE
Valeant Pharmaceuticals
DRUGS - Drug Manufacturers - Other
|
$73.95
|
-0.02
-0.03% |
$74.81
|
1,264,147
100.38% of 50 DAV
50 DAV is 1,259,400
|
$74.67
-0.96%
|
12/20/2012
|
$60.24
|
PP = $61.21
|
|
MB = $64.27
|
Most Recent Note - 3/20/2013 12:52:11 PM
G - Hitting yet another new high with today's 3rd consecutive gain, getting very extended from the secondary buy point noted earlier. The 50 DMA line and recent low ($64.05 on 2/21/13) define important support areas to watch on pullbacks.
>>> The latest Featured Stock Update with an annotated graph appeared on 3/12/2013. Click here.
View all notes |
Alert me of new notes |
CANSLIM.net Company Profile |
SEC |
Zacks Reports |
StockTalk |
News |
Chart |
Request a new note
C
A N
S L
I M
|
|
|
|
THESE ARE NOT BUY RECOMMENDATIONS!
Comments contained in the body of this report are technical
opinions only. The material herein has been obtained
from sources believed to be reliable and accurate, however,
its accuracy and completeness cannot be guaranteed.
This site is not an investment advisor, hence it does
not endorse or recommend any securities or other investments.
Any recommendation contained in this report may not
be suitable for all investors and it is not to be deemed
an offer or solicitation on our part with respect to
the purchase or sale of any securities. All trademarks,
service marks and trade names appearing in this report
are the property of their respective owners, and are
likewise used for identification purposes only.
This report is a service available
only to active Paid Premium Members.
You may opt-out of receiving report notifications
at any time. Questions or comments may be submitted
by writing to Premium Membership Services 665 S.E. 10 Street, Suite 201 Deerfield Beach, FL 33441-5634 or by calling 1-800-965-8307
or 954-785-1121.
|
|
|

