You are not logged in.
This means you
CAN ONLY VIEW reports that were published prior to Monday, April 14, 2025.
You
MUST UPGRADE YOUR MEMBERSHIP if you want to see any current reports.
AFTER MARKET UPDATE - TUESDAY, MARCH 22ND, 2011
Previous After Market Report Next After Market Report >>>
|
|
|
|
DOW |
-17.90 |
12,018.63 |
-0.15% |
|
Volume |
824,035,640 |
-18% |
|
Volume |
1,599,337,480 |
-6% |
|
NASDAQ |
-8.22 |
2,683.87 |
-0.31% |
|
Advancers |
1,246 |
40% |
|
Advancers |
1,060 |
39% |
|
S&P 500 |
-4.61 |
1,293.77 |
-0.36% |
|
Decliners |
1,745 |
56% |
|
Decliners |
1,552 |
57% |
|
Russell 2000 |
-4.36 |
808.66 |
-0.54% |
|
52 Wk Highs |
103 |
|
|
52 Wk Highs |
71 |
|
|
S&P 600 |
-2.12 |
429.11 |
-0.49% |
|
52 Wk Lows |
9 |
|
|
52 Wk Lows |
33 |
|
|
 |
Major Averages End With Small Losses on Lighter Volume
Kenneth J. Gruneisen - Passed the CAN SLIM® Master's Exam
While the indices ended with small losses, the volume totals were reported lighter on the NYSE and on the Nasdaq exchange versus the prior session's totals. That action suggested that on Tuesday's session there was not heavy distribution (selling) of stocks taking place by large and influential institutional investors. Declining issues beat advancers by 3-2 on the Nasdaq and on the NYSE. However, new 52-week highs outnumbered new 52-week lows on the Nasdaq exchange and on the NYSE, and the new lows total on the NYSE was in the single digits again. There were 35 high-ranked companies from the CANSLIM.net Leaders List that made new 52-week highs and appeared on the CANSLIM.net BreakOuts Page, down from a total of 44 on the prior session. On the Featured Stocks Page there were gains from 12 of the 20 high-ranked market leaders currently listed.
The euro fell against the dollar on renewed European debt concerns. Meanwhile, the market was soothed by an apparent easing of the nuclear crisis in Japan. Fighting in Libya and unrest in Yemen contributed to higher oil prices. Crude oil climbed above $104 a barrel, the highest settlement price since March 9th. Gold gained for the fifth day in a row.
Sprint Nextel Corp (S +2.5%) and Netflix Inc (NFLX +4.01%) both benefited from analyst upgrades. Meanwhile, Walgreen Co (WAG -6.58%) fell after the company's profit margin disappointed in the latest quarter. Carnival Corp (CCL -4.5%) faced pressure after it forecast full-year earnings that missed projections. Bristol-Myers Squibb Co (BMY +1.1%) rose on hopes a new melanoma drug may be approved soon.
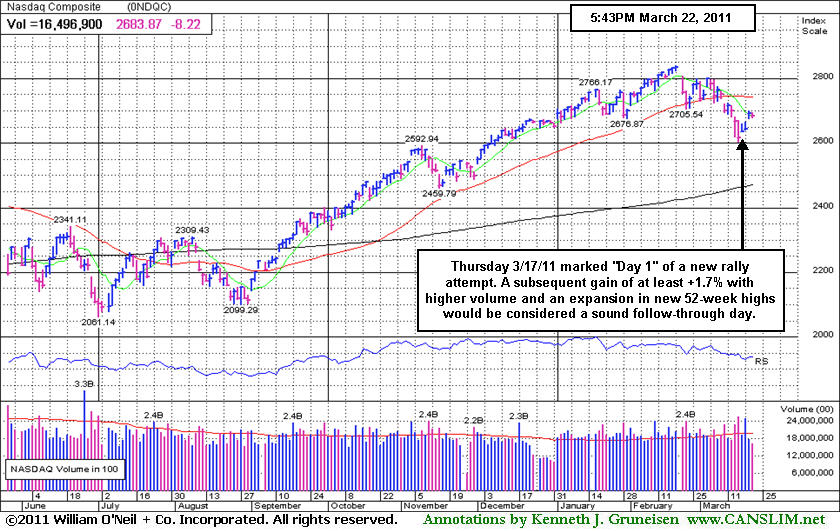
New buying efforts should be avoided until a new rally with a follow-through day (FTD) provides a fresh confirmation that buying demand from the institutional crowd is returning again. Even after a FTD, new buying efforts should be cautiously and carefully made when all of the investment system's key criteria are met.
PICTURED: The Nasdaq Composite Index's gain on Thursday, March 17, 2011 marked "Day 1" of a new rally attempt. A subsequent gain of at least +1.7% with higher volume and an expansion in new 52-week highs would be considered a sound follow-through day (FTD). Based on studies of how past market corrections ended and went on to become new sustained rallies, it is considered most favorable for a solid FTD to come between Day 4-7 of a new rally attempt.
|
 Kenneth J. Gruneisen started out as a licensed stockbroker in August 1987, a couple of months prior to the historic stock market crash that took the Dow Jones Industrial Average down -22.6% in a single day. He has published daily fact-based fundamental and technical analysis on high-ranked stocks online for two decades. Through FACTBASEDINVESTING.COM, Kenneth provides educational articles, news, market commentary, and other information regarding proven investment systems that work in good times and bad.
Comments contained in the body of this report are technical opinions only and are not necessarily those of Gruneisen Growth Corp. The material herein has been obtained from sources believed to be reliable and accurate, however, its accuracy and completeness cannot be guaranteed. Our firm, employees, and customers may effect transactions, including transactions contrary to any recommendation herein, or have positions in the securities mentioned herein or options with respect thereto. Any recommendation contained in this report may not be suitable for all investors and it is not to be deemed an offer or solicitation on our part with respect to the purchase or sale of any securities. |
|
 |
Tech Sector Leads Losses; Retail and Financial Shares Sputter
Kenneth J. Gruneisen - Passed the CAN SLIM® Master's Exam
The Networking Index ($NWX -1.84%) led the tech sector lower, and the Semiconductor Index ($SOX -0.91%), Biotechnology Index ($BTK -0.67%), and Internet Index ($IIX -0.46%) also ended unanimously lower. The Retail Index ($RLX -0.48%) and financial shares had a negative influence on the major averages as the Bank Index ($BKX -0.58%) and Broker/Dealer Index ($XBD -0.35%) continued to sputter below their respective 50-day moving average (DMA) lines. The Healthcare Index ($HMO -0.23%) inched lower and energy-related shares had a slightly negative bias as the Oil Services Index ($OSX -0.47%) and Integrated Oil Index ($XOI -0.08%) fell sightly, meanwhile the Gold & Silver Index ($XAU +0.55%) posted a small gain.
Charts courtesy www.stockcharts.com
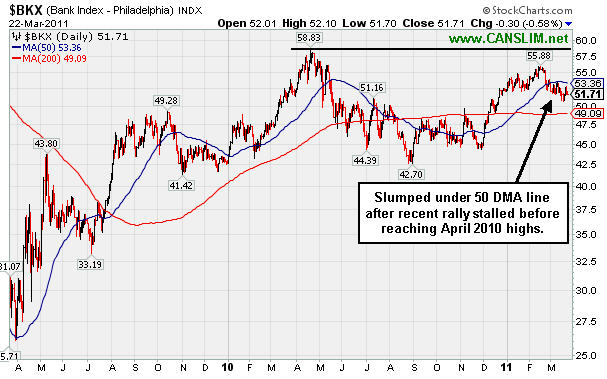
PICTURED: The Bank Index ($BKX -0.58%) has slumped under its 50 DMA line after its recent rally stalled before reaching the April 2010 highs. Since the financial group is recognized as an important leading indicator, subsequent gains above the 50 DMA line would help the broader market outlook. Additional losses for the bank Index beyond its recent lows would not bode well for the market's latest rally attempt.
| Oil Services |
$OSX |
287.50 |
-1.37 |
-0.47% |
+17.29% |
| Healthcare |
$HMO |
2,047.33 |
-4.79 |
-0.23% |
+21.00% |
| Integrated Oil |
$XOI |
1,344.61 |
-1.05 |
-0.08% |
+10.84% |
| Semiconductor |
$SOX |
422.91 |
-3.88 |
-0.91% |
+2.69% |
| Networking |
$NWX |
312.18 |
-5.86 |
-1.84% |
+11.27% |
| Internet |
$IIX |
305.72 |
-1.43 |
-0.46% |
-0.65% |
| Broker/Dealer |
$XBD |
120.14 |
-0.42 |
-0.35% |
-1.13% |
| Retail |
$RLX |
498.84 |
-2.41 |
-0.48% |
-1.88% |
| Gold & Silver |
$XAU |
209.75 |
+1.15 |
+0.55% |
-7.43% |
| Bank |
$BKX |
51.71 |
-0.30 |
-0.58% |
-0.96% |
| Biotech |
$BTK |
1,276.35 |
-8.65 |
-0.67% |
-1.64% |
|
|
|
 |
Big Volume Accompanied Breakout This Week
Kenneth J. Gruneisen - Passed the CAN SLIM® Master's Exam
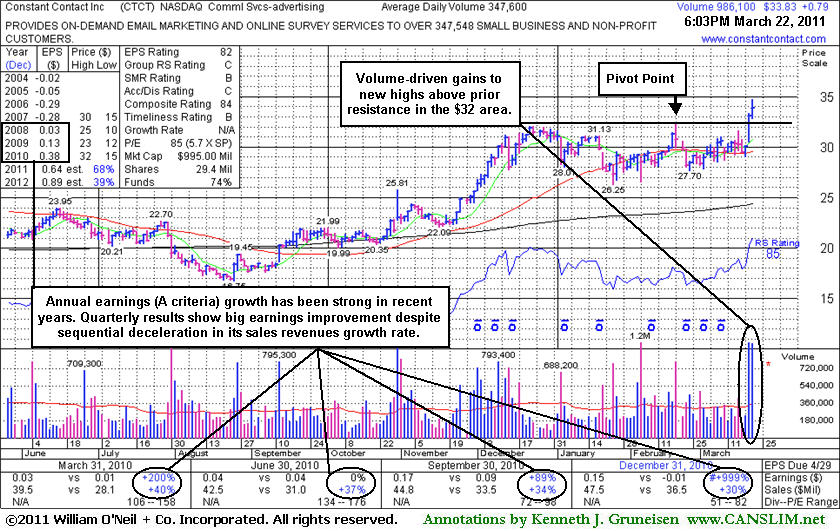
A proper technical buy signal under the investment system's guidelines requires a gain above the pivot backed by more than +50% above average volume. Most big winners in market history, in fact, blasted off with very heavy volume, they did not barely limp over their pivot points. Volume is a critical component to a sound technical breakout, as the intense burst of trading activity is what gives investors evidence of serious institutional buying demand - which is needed for a sustained advance!
Constant Contact inc (CTCT +$0.79 +2.39% to $33.83) hit a new all-time high today with a second consecutive volume-driven gain backed by approximately 3 times average volume. Its color code was changed to yellow with pivot point cited based on its prior high plus 10 cents when featured in the mid-day report earlier today. Volume driven gains to new all-time highs (N criteria) were reassuring proof of fresh institutional (I criteria) buying demand which can potentially lead to a sustained advance into new high territory. The bullish action warrants attention, however disciplined investors know that the M criteria remains an overriding concern until a follow-through day (FTD) from at least one of the major averages confirms a new rally. Three out of four stocks tend to go in the same direction of the major averages, and waiting for a FTD increases the odds that your new buying efforts will turn out to be profitable. The market commentary this evening goes into greater detail concerning what constitutes a proper FTD.
The 3/16/11 mid-day report cautiously had noted - "Sales revenues increases show steady sequential deceleration from +55%, +49%, +47%, +43%, +40%, +37%, +34%, to +30% from the Mar '09 through the latest Dec '10 quarterly comparison(s) versus the respective year(s) earlier. It has shown good annual earnings increases since FY '08 and (A criteria) and great earning improvement in recent quarterly comparisons. Very little overhead supply remains to act as resistance up through the $32 level, meanwhile it has been enduring distributional pressure while building a choppy 13-week base. Increasing ownership by top-rated funds is a reassuring sign (I criteria), rising from 241 in Mar '10 to 293 in Dec '10."
|
|
|
Color Codes Explained :
Y - Better candidates highlighted by our
staff of experts.
G - Previously featured
in past reports as yellow but may no longer be buyable under the
guidelines.
***Last / Change / Volume data in this table is the closing quote data***
Symbol/Exchange
Company Name
Industry Group |
PRICE |
CHANGE
(%Change) |
Day High |
Volume
(% DAV)
(% 50 day avg vol) |
52 Wk Hi
% From Hi |
Featured
Date |
Price
Featured |
Pivot Featured |
|
Max Buy |
BIDU
-
NASDAQ
Baidu Inc Ads
INTERNET - Internet Information Providers
|
$127.09
|
+3.09
2.49% |
$127.33
|
6,788,475
101.55% of 50 DAV
50 DAV is 6,684,600
|
$131.63
-3.45%
|
3/17/2011
|
$121.97
|
PP = $131.73
|
|
MB = $138.32
|
 Most Recent Note - 3/22/2011 6:45:40 PM
Y - Finished near the session high today with a gain on higher (but still near average) volume. Color code was changed to yellow with new pivot point cited based on its 52-week high plus 10 cents after consolidating for the past 5 weeks above support at its 50 DMA line. Volume-driven gains above its pivot point and a new rally with follow-through day from at least one of the major averages (M criteria) are necessary first in order to justify new (or add-on) buying efforts under the system's guidelines. Its recent chart low ($112.95 on 2/23/11) is the next important chart support to watch below its short-term average.
>>> The latest Featured Stock Update with an annotated graph appeared on 3/9/2011. Click here.
View all notes |
Alert me of new notes |
CANSLIM.net Company Profile |
SEC |
Zacks Reports |
StockTalk |
News |
Chart |
Request a new note
C
A N
S L
I M


|
CMG
-
NYSE
Chipotle Mexican Grill
LEISURE - Restaurants
|
$243.89
|
-3.61
-1.46% |
$250.00
|
932,645
87.20% of 50 DAV
50 DAV is 1,069,600
|
$275.00
-11.31%
|
2/11/2011
|
$271.15
|
PP = $262.87
|
|
MB = $276.01
|
Most Recent Note - 3/22/2011 6:49:31 PM
G - It has slumped -11.3% off its all-time high and it is testing support at its 50 DMA line. Its recent low ($234.48 on 3/02/11) defines another important nearby level for chart readers to watch closely. Subsequent violations and damaging losses would raise greater concerns and trigger technical sell signals.
>>> The latest Featured Stock Update with an annotated graph appeared on 3/14/2011. Click here.
View all notes |
Alert me of new notes |
CANSLIM.net Company Profile |
SEC |
Zacks Reports |
StockTalk |
News |
Chart |
Request a new note
C
A N
S L
I M
|
CTCT
-
NASDAQ
Constant Contact Inc
MEDIA - Advertising Services
|
$33.83
|
+0.79
2.39% |
$34.69
|
986,066
283.68% of 50 DAV
50 DAV is 347,600
|
$33.37
1.38%
|
3/22/2011
|
$33.59
|
PP = $32.49
|
|
MB = $34.11
|
Most Recent Note - 3/22/2011 6:34:11 PM
Y - Posted a second consecutive gain for a new high today following a technical breakout and strong finish on the prior session with 3 times average volume. Color code was changed to yellow with pivot point cited based on its prior high plus 10 cents. The bullish action warrants attention, however the M criteria remains an overriding concern until a follow-through day from at least one of the major averages confirms a new rally. See the latest FSU analysis for more details and an annotated graph.
>>> The latest Featured Stock Update with an annotated graph appeared on 3/22/2011. Click here.
View all notes |
Alert me of new notes |
CANSLIM.net Company Profile |
SEC |
Zacks Reports |
StockTalk |
News |
Chart |
Request a new note
C
A N
S L
I M
|
CTSH
-
NASDAQ
Cognizant Tech Sol Cl A
COMPUTER SOFTWARE and SERVICES - Business Software and Services
|
$76.87
|
+1.26
1.67% |
$77.44
|
2,643,961
111.74% of 50 DAV
50 DAV is 2,366,200
|
$78.69
-2.31%
|
2/7/2011
|
$75.09
|
PP = $76.46
|
|
MB = $80.28
|
Most Recent Note - 3/22/2011 1:47:10 PM
Y - Rallying back above its 50 DMA line this week after briefly undercutting hat important short-term average and its previously noted low ($73.25 on 2/23/11) last week. It is perched only -2.0% off its 52-week high now. Color code is changed to yellow after showing resilience following the noted technical violations.
>>> The latest Featured Stock Update with an annotated graph appeared on 3/17/2011. Click here.
View all notes |
Alert me of new notes |
CANSLIM.net Company Profile |
SEC |
Zacks Reports |
StockTalk |
News |
Chart |
Request a new note
C
A N
S L
I M
|
DECK
-
NASDAQ
Deckers Outdoor Corp
CONSUMER NON-DURABLES - Textile - Apparel Footwear
|
$80.53
|
-0.54
-0.67% |
$81.69
|
756,921
48.72% of 50 DAV
50 DAV is 1,553,600
|
$94.70
-14.96%
|
2/3/2011
|
$79.61
|
PP = $82.67
|
|
MB = $86.80
|
Most Recent Note - 3/21/2011 1:39:09 PM
G - Up today, yet still lingering below its 50 DMA line. A rebound above that important short-term average would technically help its outlook improve.
>>> The latest Featured Stock Update with an annotated graph appeared on 3/3/2011. Click here.
View all notes |
Alert me of new notes |
CANSLIM.net Company Profile |
SEC |
Zacks Reports |
StockTalk |
News |
Chart |
Request a new note
C
A N
S L
I M
|
Symbol/Exchange
Company Name
Industry Group |
PRICE |
CHANGE
(%Change) |
Day High |
Volume
(% DAV)
(% 50 day avg vol) |
52 Wk Hi
% From Hi |
Featured
Date |
Price
Featured |
Pivot Featured |
|
Max Buy |
EBIX
-
NASDAQ
Ebix Inc
COMPUTER SOFTWARE and SERVICES - Business Software and Services
|
$29.08
|
-0.37
-1.26% |
$29.72
|
425,707
68.62% of 50 DAV
50 DAV is 620,400
|
$29.82
-2.48%
|
2/28/2011
|
$25.70
|
PP = $25.97
|
|
MB = $27.27
|
Most Recent Note - 3/21/2011 10:02:42 AM
G - Gapped up today, rising within close striking distance of its all-time high. Prior highs in the $25-26 area define important chart support to watch along with its 50 DMA line.
>>> The latest Featured Stock Update with an annotated graph appeared on 2/28/2011. Click here.
View all notes |
Alert me of new notes |
CANSLIM.net Company Profile |
SEC |
Zacks Reports |
StockTalk |
News |
Chart |
Request a new note
C
A N
S L
I M
|
EZPW
-
NASDAQ
Ezcorp Inc Cl A
SPECIALTY RETAIL - Specialty Retail, Other
|
$28.91
|
-0.17
-0.58% |
$29.54
|
372,883
101.88% of 50 DAV
50 DAV is 366,000
|
$29.94
-3.44%
|
2/18/2011
|
$27.94
|
PP = $30.04
|
|
MB = $31.54
|
Most Recent Note - 3/21/2011 10:06:27 AM
Y - Gapped up today, rising above its 50 DMA line, a technical improvement that helps its outlook. Color code is changed to yellow while its pivot point last cited remains the same. The recent low ($25.56 on 1/25/11) defines the next important support level.
>>> The latest Featured Stock Update with an annotated graph appeared on 3/10/2011. Click here.
View all notes |
Alert me of new notes |
CANSLIM.net Company Profile |
SEC |
Zacks Reports |
StockTalk |
News |
Chart |
Request a new note
C
A N
S L
I M
|
FOSL
-
NASDAQ
Fossil Inc
CONSUMER DURABLES - Recreational Goods, Other
|
$83.04
|
+1.24
1.52% |
$83.66
|
749,354
76.96% of 50 DAV
50 DAV is 973,700
|
$85.20
-2.54%
|
2/1/2011
|
$73.30
|
PP = $74.44
|
|
MB = $78.16
|
Most Recent Note - 3/21/2011 2:47:32 PM
G - Up today with lighter volume. It has not formed a sound base. It found support at its 50 DMA line while consolidating above prior resistance in the $74 area.
>>> The latest Featured Stock Update with an annotated graph appeared on 2/24/2011. Click here.
View all notes |
Alert me of new notes |
CANSLIM.net Company Profile |
SEC |
Zacks Reports |
StockTalk |
News |
Chart |
Request a new note
C
A N
S L
I M
|
HMSY
-
NASDAQ
H M S Holdings Corp
COMPUTER SOFTWARE and SERVICES - Healthcare Information Service
|
$81.31
|
+0.17
0.21% |
$82.18
|
93,079
54.34% of 50 DAV
50 DAV is 171,300
|
$81.36
-0.06%
|
11/19/2010
|
$61.89
|
PP = $63.01
|
|
MB = $66.16
|
Most Recent Note - 3/21/2011 10:12:14 AM
G - Rallying within close striking distance of its 52-week high today after a brief consolidation, not a sound new base. Support to watch is its 50 DMA line.
>>> The latest Featured Stock Update with an annotated graph appeared on 2/16/2011. Click here.
View all notes |
Alert me of new notes |
CANSLIM.net Company Profile |
SEC |
Zacks Reports |
StockTalk |
News |
Chart |
Request a new note
C
A N
S L
I M
|
HS
-
NYSE
Healthspring Inc
HEALTH SERVICES - Health Care Plans
|
$38.09
|
+0.79
2.12% |
$39.19
|
1,018,520
169.56% of 50 DAV
50 DAV is 600,700
|
$38.75
-1.70%
|
3/22/2011
|
$38.29
|
PP = $38.85
|
|
MB = $40.79
|
Most Recent Note - 3/22/2011 6:39:09 PM
Y - Touched a new 52-week high earlier today and finished at a new high close with +69% above average volume behind its gain. After an orderly flat base near minimum length its color code was changed to yellow with pivot point cited based on its 52-week high plus 10 cents when featured in the mid-day report earlier today. However, the M criteria argues against new buying efforts until a follow-through day confirms a new rally. Also, Street earnings estimates calling for EPS growth in the +8% range in FY '11 and FY '12 were previously noted as a concern. It was extended from an ideal base when last noted in the 2/23/11 mid-day report - "It rebounded above its 50 DMA line and made an impressive rally after it was dropped from the Featured Stocks list on 12/22/10 based on fundamental and technical concerns. Reported earnings +49% on +30% sales revenues for the quarter ended December 31, 2010 versus the year ago period."
>>> The latest Featured Stock Update with an annotated graph appeared on 12/10/2010. Click here.
View all notes |
Alert me of new notes |
CANSLIM.net Company Profile |
SEC |
Zacks Reports |
StockTalk |
News |
Chart |
Request a new note
C
A N
S L
I M
|
Symbol/Exchange
Company Name
Industry Group |
PRICE |
CHANGE
(%Change) |
Day High |
Volume
(% DAV)
(% 50 day avg vol) |
52 Wk Hi
% From Hi |
Featured
Date |
Price
Featured |
Pivot Featured |
|
Max Buy |
LULU
-
NASDAQ
Lululemon Athletica
MANUFACTURING - Textile Manufacturing
|
$77.21
|
+0.33
0.43% |
$77.81
|
1,402,482
66.04% of 50 DAV
50 DAV is 2,123,800
|
$85.28
-9.46%
|
1/26/2011
|
$68.11
|
PP = $74.70
|
|
MB = $78.44
|
Most Recent Note - 3/17/2011 11:20:45 AM
G - Down today with heavy volume after reporting earnings per share +60% on +53% revenues for the quarter ended January 31, 2011 versus the year ago period. Volume and volatility often increase near earnings news. It is again testing its 50 DMA line, a classic chart support level. As previously noted - "A close below a significant prior high close ($73.51 on 12/21/10) would completely negate its latest breakout, raising more serious concerns."
>>> The latest Featured Stock Update with an annotated graph appeared on 2/25/2011. Click here.
View all notes |
Alert me of new notes |
CANSLIM.net Company Profile |
SEC |
Zacks Reports |
StockTalk |
News |
Chart |
Request a new note
C
A N
S L
I M
|
MG
-
NYSE
Mistras Group Inc
DIVERSIFIED SERVICES - Bulding and Faci;ity Management Services
|
$17.01
|
+0.03
0.18% |
$17.09
|
303,121
298.64% of 50 DAV
50 DAV is 101,500
|
$17.00
0.06%
|
3/15/2011
|
$15.48
|
PP = $15.90
|
|
MB = $16.70
|
Most Recent Note - 3/22/2011 1:00:13 PM
G - Touched another new high today. After rallying beyond its "max buy" level its color code was changed to green. Prior highs near its pivot point define chart support to watch following last week's technical breakout. The M criteria argues against new buying efforts until a confirmed rally with follow-through day occurs.
>>> The latest Featured Stock Update with an annotated graph appeared on 3/15/2011. Click here.
View all notes |
Alert me of new notes |
CANSLIM.net Company Profile |
SEC |
Zacks Reports |
StockTalk |
News |
Chart |
Request a new note
C
A N
S L
I M
|
MWIV
-
NASDAQ
M W I Veterinary Supply
HEALTH SERVICES - Medical Instruments and; Supplies
|
$76.74
|
+0.58
0.76% |
$76.80
|
36,137
39.93% of 50 DAV
50 DAV is 90,500
|
$78.48
-2.22%
|
11/4/2010
|
$61.79
|
PP = $59.60
|
|
MB = $62.58
|
Most Recent Note - 3/18/2011 4:43:33 PM
G - Today's gain leaves its -2.8% off its all-time high. It is extended from any sound base pattern.
>>> The latest Featured Stock Update with an annotated graph appeared on 3/8/2011. Click here.
View all notes |
Alert me of new notes |
CANSLIM.net Company Profile |
SEC |
Zacks Reports |
StockTalk |
News |
Chart |
Request a new note
C
A N
S L
I M
|
OPEN
-
NASDAQ
Opentable Inc
INTERNET - Internet Software and Services
|
$92.63
|
+0.48
0.52% |
$93.25
|
883,017
80.19% of 50 DAV
50 DAV is 1,101,100
|
$95.97
-3.48%
|
3/17/2011
|
$90.71
|
PP = $96.07
|
|
MB = $100.87
|
Most Recent Note - 3/21/2011 1:45:55 PM
Y - Inching higher today without great volume conviction. Color code was changed to yellow after it formed a sound new flat base pattern of sufficient length. Volume-driven gains above the new pivot point cited and a confirmed rally with follow-through day may eventually justify new (or add-on) buying efforts under the investment system guidelines. Important support to watch in the meanwhile is at its 50 DMA line and prior chart highs.
>>> The latest Featured Stock Update with an annotated graph appeared on 2/15/2011. Click here.
View all notes |
Alert me of new notes |
CANSLIM.net Company Profile |
SEC |
Zacks Reports |
StockTalk |
News |
Chart |
Request a new note
C
A N
S L
I M
|
PAY
-
NYSE
Verifone Systems Inc
COMPUTER HARDWARE - Transaction Automation Systems
|
$52.38
|
-0.78
-1.47% |
$54.00
|
1,544,140
80.85% of 50 DAV
50 DAV is 1,909,800
|
$53.85
-2.73%
|
1/27/2011
|
$41.77
|
PP = $44.97
|
|
MB = $47.22
|
Most Recent Note - 3/21/2011 1:33:15 PM
G - Gap up gain today has it poised for a possible new high close. Repeatedly noted - "No resistance remains due to overhead supply, but it is extended from a sound base pattern. Its 50 DMA line defines chart support to watch."
>>> The latest Featured Stock Update with an annotated graph appeared on 3/2/2011. Click here.
View all notes |
Alert me of new notes |
CANSLIM.net Company Profile |
SEC |
Zacks Reports |
StockTalk |
News |
Chart |
Request a new note
C
A N
S L
I M
|
Symbol/Exchange
Company Name
Industry Group |
PRICE |
CHANGE
(%Change) |
Day High |
Volume
(% DAV)
(% 50 day avg vol) |
52 Wk Hi
% From Hi |
Featured
Date |
Price
Featured |
Pivot Featured |
|
Max Buy |
PCLN
-
NASDAQ
Priceline.Com Inc
INTERNET - Internet Software and Services
|
$455.70
|
-1.23
-0.27% |
$462.19
|
1,331,676
116.35% of 50 DAV
50 DAV is 1,144,500
|
$474.74
-4.01%
|
1/3/2011
|
$399.55
|
PP = $428.20
|
|
MB = $449.61
|
Most Recent Note - 3/21/2011 1:44:48 PM
G - Overcame early weakness after dipping below its 50 DMA line today, positively reversing near that important short-term average. Perched only -4.1% off its 52-week high, but it has not built a sound base pattern.
>>> The latest Featured Stock Update with an annotated graph appeared on 3/21/2011. Click here.
View all notes |
Alert me of new notes |
CANSLIM.net Company Profile |
SEC |
Zacks Reports |
StockTalk |
News |
Chart |
Request a new note
C
A N
S L
I M
|
RAX
-
NYSE
Rackspace Hosting Inc
INTERNET - Internet Software and; Services
|
$36.69
|
-1.22
-3.22% |
$37.99
|
1,263,813
68.63% of 50 DAV
50 DAV is 1,841,400
|
$40.62
-9.68%
|
3/16/2011
|
$36.28
|
PP = $40.72
|
|
MB = $42.76
|
Most Recent Note - 3/22/2011 1:41:11 PM
Y - Considerable loss today, slumping back toward prior highs near $35 and its 50 DMA line defining important chart support to watch. The M criteria is an overriding concern arguing against new buying efforts until a rally with follow-through day occurs.
>>> The latest Featured Stock Update with an annotated graph appeared on 3/16/2011. Click here.
View all notes |
Alert me of new notes |
CANSLIM.net Company Profile |
SEC |
Zacks Reports |
StockTalk |
News |
Chart |
Request a new note
C
A N
S L
I M
|
TIBX
-
NASDAQ
Tibco Software Inc
COMPUTER SOFTWARE and SERVICES - Business Software and Services
|
$24.61
|
+0.03
0.12% |
$24.70
|
1,138,648
45.27% of 50 DAV
50 DAV is 2,515,200
|
$25.94
-5.13%
|
3/18/2011
|
$23.88
|
PP = $26.04
|
|
MB = $27.34
|
Most Recent Note - 3/21/2011 1:41:13 PM
Y - Small gap up today. Color code was changed to yellow with new pivot point cited based on its 52-week high plus ten cents. Currently consolidating above support at its 50 DMA line and recent chart lows defining support above its old resistance area. More damaging losses would raise concerns and trigger more worrisome technical sell signals.
>>> The latest Featured Stock Update with an annotated graph appeared on 3/18/2011. Click here.
View all notes |
Alert me of new notes |
CANSLIM.net Company Profile |
SEC |
Zacks Reports |
StockTalk |
News |
Chart |
Request a new note
C
A N
S L
I M
|
UA
-
NYSE
Under Armour Inc Cl A
CONSUMER NON-DURABLES - Textile - Apparel Clothing
|
$64.19
|
-1.32
-2.01% |
$65.65
|
476,193
59.70% of 50 DAV
50 DAV is 797,600
|
$70.69
-9.20%
|
1/27/2011
|
$58.31
|
PP = $56.99
|
|
MB = $59.84
|
Most Recent Note - 3/22/2011 6:41:58 PM
G - Down today with light volume, slumping toward its 50 DMA line and recent lows defining important chart support. It may be forming a base-on-base pattern, but more damaging losses would hurt its outlook.
>>> The latest Featured Stock Update with an annotated graph appeared on 3/7/2011. Click here.
View all notes |
Alert me of new notes |
CANSLIM.net Company Profile |
SEC |
Zacks Reports |
StockTalk |
News |
Chart |
Request a new note
C
A N
S L
I M
|
ULTA
-
NASDAQ
Ulta Salon Cosm & Frag
SPECIALTY RETAIL - Specialty Retail, Other
|
$46.47
|
-0.78
-1.65% |
$47.42
|
431,255
68.61% of 50 DAV
50 DAV is 628,600
|
$47.93
-3.05%
|
1/6/2011
|
$36.12
|
PP = $37.34
|
|
MB = $39.21
|
Most Recent Note - 3/22/2011 6:43:51 PM
G - Hovering near its all-time high, quietly holding its ground after a spurt of volume-driven gains. Support to watch is at its 50 DMA line and recent chart lows near the $40 level.
>>> The latest Featured Stock Update with an annotated graph appeared on 2/17/2011. Click here.
View all notes |
Alert me of new notes |
CANSLIM.net Company Profile |
SEC |
Zacks Reports |
StockTalk |
News |
Chart |
Request a new note
C
A N
S L
I M
|
Symbol/Exchange
Company Name
Industry Group |
PRICE |
CHANGE
(%Change) |
Day High |
Volume
(% DAV)
(% 50 day avg vol) |
52 Wk Hi
% From Hi |
Featured
Date |
Price
Featured |
Pivot Featured |
|
Max Buy |
|
|
|
THESE ARE NOT BUY RECOMMENDATIONS!
Comments contained in the body of this report are technical
opinions only. The material herein has been obtained
from sources believed to be reliable and accurate, however,
its accuracy and completeness cannot be guaranteed.
This site is not an investment advisor, hence it does
not endorse or recommend any securities or other investments.
Any recommendation contained in this report may not
be suitable for all investors and it is not to be deemed
an offer or solicitation on our part with respect to
the purchase or sale of any securities. All trademarks,
service marks and trade names appearing in this report
are the property of their respective owners, and are
likewise used for identification purposes only.
This report is a service available
only to active Paid Premium Members.
You may opt-out of receiving report notifications
at any time. Questions or comments may be submitted
by writing to Premium Membership Services 665 S.E. 10 Street, Suite 201 Deerfield Beach, FL 33441-5634 or by calling 1-800-965-8307
or 954-785-1121.
|
|
|

