You are not logged in.
This means you
CAN ONLY VIEW reports that were published prior to Monday, April 14, 2025.
You
MUST UPGRADE YOUR MEMBERSHIP if you want to see any current reports.
AFTER MARKET UPDATE - THURSDAY, MARCH 21ST, 2013
Previous After Market Report Next After Market Report >>>
|
|
|
|
DOW |
-90.24 |
14,421.49 |
-0.62% |
|
Volume |
652,157,760 |
-3% |
|
Volume |
1,625,068,040 |
+6% |
|
NASDAQ |
-31.59 |
3,222.60 |
-0.97% |
|
Advancers |
1,053 |
34% |
|
Advancers |
785 |
31% |
|
S&P 500 |
-12.91 |
1,545.80 |
-0.83% |
|
Decliners |
1,960 |
63% |
|
Decliners |
1,649 |
65% |
|
Russell 2000 |
-8.03 |
943.92 |
-0.84% |
|
52 Wk Highs |
211 |
|
|
52 Wk Highs |
101 |
|
|
S&P 600 |
-4.43 |
527.21 |
-0.83% |
|
52 Wk Lows |
18 |
|
|
52 Wk Lows |
12 |
|
|
 |
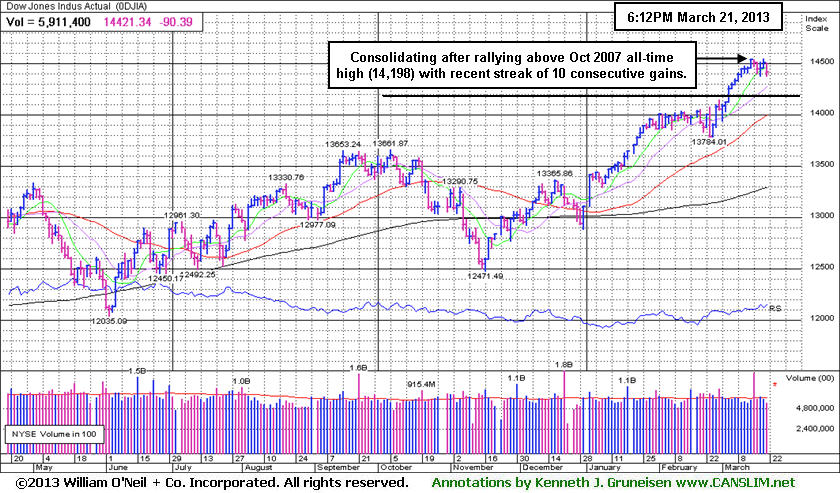
Breadth Negative as Indices Consolidate Following Streak of Gains
Kenneth J. Gruneisen - Passed the CAN SLIM® Master's Exam
As the major averages fell on Thursday the market's breadth was clearly negative as decliners led advancers by a 2-1 margin on the NYSE and on the Nasdaq exchange. The volume totals were reported mixed, lighter than the prior session totals on the NYSE and higher on the Nasdaq exchange. The total number of stocks hitting new 52-week highs contracted, however new highs still easily outnumbered new 52-week lows on the NYSE and on the Nasdaq exchange. There were 47 high-ranked companies from the CANSLIM.net Leaders List making new 52-week highs and appearing on the CANSLIM.net BreakOuts Page, down considerably from the prior session total of 97 stocks. There were gains for 9 of the 18 high-ranked companies currently included on the Featured Stocks Page, a favorable balance considering the broader market's negative slant on the session.
On our shores, the housing market continued to show signs of improvement. Existing home sales increased in February to the highest level since November 2009 and home prices advanced for the 12th consecutive month in January. Meanwhile, the Philadelphia Fed Index moved into expansionary territory for the first time since December and a gauge of leading indicators rose for a third month in February.
Concerns surrounding the euro zone overshadowed the encouraging U.S. economic data. In Europe, the ECB warned Cyprus it has until next Monday to agree to a bailout plan before it cuts off funding to the nation's troubled banks. Stock losses accelerated late in the session as anxiety about Cypriot finances increased. Just before the U.S. market's close, Standard & Poor's cut Cyprus' sovereign credit rating deeper into junk status. Investors still fear that a collapse of the banking system in Cyprus will tighten credit across Europe. Meanwhile new data showed that the region's economy contracted more than expected in March, only adding to investors' lingering fears.
Oracle Corp (ORCL -9.69%) reported revenue far short of expectations and it led tech shares lower while it was the biggest drag on the tech-heavy Nasdaq. Cisco Systems Inc (CSCO -3.83%) was the Dow's biggest percentage loser after an analyst downgraded the network equipment maker's stock and cut its price target. Among other tech shares, International Business Machines Corp (IBM -1.30%) slumped. Apparel retailers Guess Inc (GES -7.20%), Tilly's Inc (TLYS -8.43%) and Pacific Sunwear of California Inc (PSUN -9.84%) each fell hard after they forecast first-quarter results significantly below analysts' estimates. After the bell, shares of Nike Inc (NKE -2.24%) traded considerably higher (+8.3%) after it posted a profit that beat analyst expectations. None of the above mentioned companies is a match with the fact-based investment system's key criteria. Stocks currently included on the Featured Stocks Page are recognized as most noteworthy and potentially action-worthy candidates.
New buying efforts are justified under the fact-based system since a follow-through day on 3/05/13 shifted the market's (M criteria) direction to a confirmed rally again after a brief correction. Any sustainable rally requires a healthy crop of companies hitting new 52-week highs, so it is always essential to see meaningful leadership (stocks hitting new 52-week highs).
Watch for an announcement via email concerning the next WEBCAST. The webcast will also be available via an updated link highlighted at the top of the Premium Member Homepage.
PICTURED: The Dow Jones Industrial Average is consolidating after a recent streak of 10 consecutive gains helped it rally well above its October 2007 high into new all-time high territory.
|
 Kenneth J. Gruneisen started out as a licensed stockbroker in August 1987, a couple of months prior to the historic stock market crash that took the Dow Jones Industrial Average down -22.6% in a single day. He has published daily fact-based fundamental and technical analysis on high-ranked stocks online for two decades. Through FACTBASEDINVESTING.COM, Kenneth provides educational articles, news, market commentary, and other information regarding proven investment systems that work in good times and bad.
Comments contained in the body of this report are technical opinions only and are not necessarily those of Gruneisen Growth Corp. The material herein has been obtained from sources believed to be reliable and accurate, however, its accuracy and completeness cannot be guaranteed. Our firm, employees, and customers may effect transactions, including transactions contrary to any recommendation herein, or have positions in the securities mentioned herein or options with respect thereto. Any recommendation contained in this report may not be suitable for all investors and it is not to be deemed an offer or solicitation on our part with respect to the purchase or sale of any securities. |
|
 |
Gold & Silver Index Posted Standout Gain on Mostly Weak Session
Kenneth J. Gruneisen - Passed the CAN SLIM® Master's Exam
The Networking Index ($NWX -1.87%) and the Semiconductor Index ($SOX -1.56%) led the tech sector lower while the Biotechnology Index ($BTK -0.68%) and Internet Index ($IIX -0.67%) followed with smaller losses. The financial groups were also a drag on the major averages as the Broker/Dealer Index ($XBD -1.62%) and the Bank Index ($BKX -1.14%) lost ground. Weakness in the Retail Index ($RLX -0.71%) and the Healthcare Index ($HMO -0.79%) added to the market's negative bias. Energy-related shares also slid as the Oil Services Index ($OSX -0.73%) and Integrated Oil Index ($XOI -0.64%) sank. The Gold & Silver Index ($XAU +2.39%) was a standout gainer.
Charts courtesy www.stockcharts.com
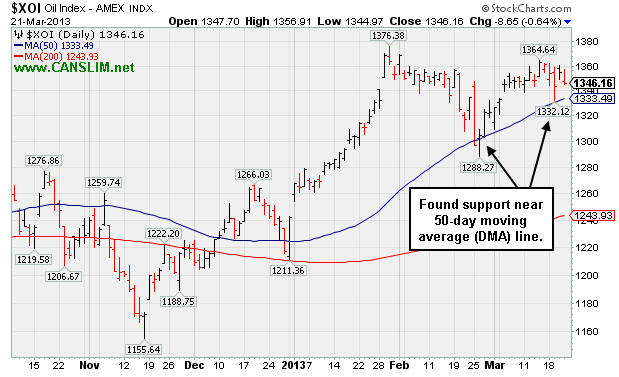
PICTURED: The Integrated Oil Index ($XOI -0.64%) recently found support near its 50-day moving average (DMA) line when consolidating after a strong start to 2013.
| Oil Services |
$OSX |
238.56 |
-1.75 |
-0.73% |
+8.36% |
| Healthcare |
$HMO |
2,754.45 |
-22.06 |
-0.79% |
+9.56% |
| Integrated Oil |
$XOI |
1,346.16 |
-8.65 |
-0.64% |
+8.40% |
| Semiconductor |
$SOX |
425.25 |
-6.76 |
-1.56% |
+10.72% |
| Networking |
$NWX |
234.62 |
-4.46 |
-1.87% |
+3.56% |
| Internet |
$IIX |
362.27 |
-2.45 |
-0.67% |
+10.79% |
| Broker/Dealer |
$XBD |
108.99 |
-1.79 |
-1.62% |
+15.55% |
| Retail |
$RLX |
713.18 |
-5.07 |
-0.71% |
+9.21% |
| Gold & Silver |
$XAU |
137.70 |
+3.21 |
+2.39% |
-16.85% |
| Bank |
$BKX |
56.47 |
-0.65 |
-1.14% |
+10.12% |
| Biotech |
$BTK |
1,783.65 |
-12.27 |
-0.68% |
+15.30% |
|
|
|
 |
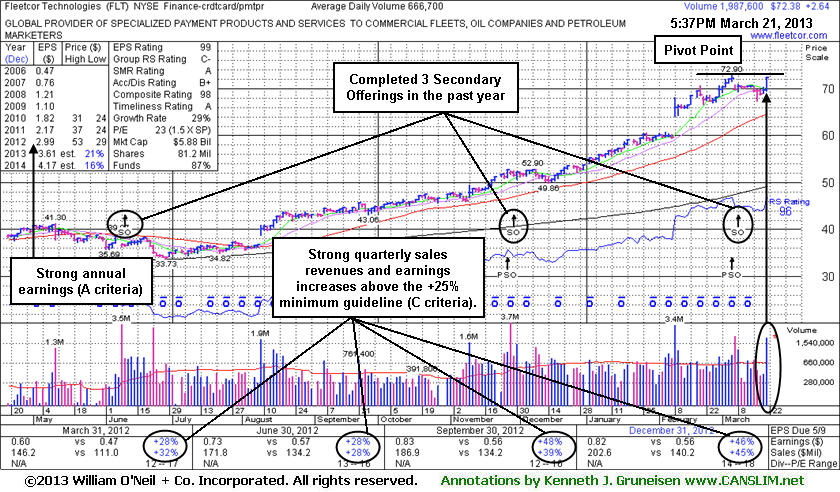
Rallied Near Pivot Point of Advanced "3-Weeks Tight" Base
Kenneth J. Gruneisen - Passed the CAN SLIM® Master's Exam
Often, when a leading stock is setting up to breakout of a solid base it is highlighted in CANSLIM.net's Mid-Day Breakouts Report. The most relevant factors are noted in the report which alerts prudent CANSLIM oriented investors to place the issue in their watch list. After doing any necessary backup research, the investor is prepared to act after the stock triggers a technical buy signal (breaks above its pivot point on more than +50% average turnover) but before it gets too extended from a sound base. In the event the stock fails to trigger a technical buy signal and its price declines then it will simply be removed from the watch list. Disciplined investors know to buy as near as possible to the pivot point and avoid chasing stocks after they have rallied more than +5% above their pivot point. It is crucial to always limit losses whenever any stock heads the wrong direction, and disciplined investors sell if a struggling stock ever falls more than -7% from their purchase price.
FleetCor Technologies, Inc. (FLT +$2.64 or +3.79% to $72.38) finished near the session high with a solid gain on 3 times average volume after highlighted in yellow with pivot point cited based on its 3/06/13 high plus 10 cents in the earlier mid-day report (click here). A volume driven gain above the pivot point may trigger a new technical buy signal. It recently held its ground and formed an advanced "3-weeks tight" base marked by 3 weekly closes in a very tight range. It rallied near its 52-week high with today's solid gain, coming close but not clearing the pivot point. The high-rank Completed another Secondary Offering on 3/08/13 after a streak of volume-driven gains into new high territory. Reported earnings +46% on +45% sales for the Dec '12 quarter, marking its 4th consecutive quarterly comparison with earnings above the +25% guideline (C criteria). On 3/14/12, 6/11/12, and 11/29/12 it priced Secondary Offerings and it was previously noted, "Such offerings often are a short-term hindrance to upward price progress yet typically result in broader institutional ownership interest."
The number of top-rated funds owning its shares rose from 193 in Mar '12 to 301 in Dec '12, a reassuring sign concerning the I criteria. Its current Up/Down Volume Ratio of 2.0 is also an unbiased indication that its shares have been under accumulation over the past 50 days. The company hails from the Finance - Credit Card Payment Processing group which currently has a below average 33 Group Relative Strength Rating, however impressive strength and leadership from a couple of other firms in the same industry group is considered sufficient reassurance concerning the L criteria.
This advanced base may be considered a "late-stage" and somewhat riskier than bases of greater duration. Careful investors may use a tactic called "pyramiding" to allow the ongoing market action to help dictate their weighting in the stock if subsequent volume-driven gains lift it above the pivot point cited. Disciplined investors avoid chasing a stock more than +5% above the pivot point and always limit losses by selling if any stock falls more than -7% from their purchase price.
|
|
|
Color Codes Explained :
Y - Better candidates highlighted by our
staff of experts.
G - Previously featured
in past reports as yellow but may no longer be buyable under the
guidelines.
***Last / Change / Volume data in this table is the closing quote data***
Symbol/Exchange
Company Name
Industry Group |
PRICE |
CHANGE
(%Change) |
Day High |
Volume
(% DAV)
(% 50 day avg vol) |
52 Wk Hi
% From Hi |
Featured
Date |
Price
Featured |
Pivot Featured |
|
Max Buy |
CELG
-
NASDAQ
Celgene Corp
DRUGS - Drug Manufacturers - Major
|
$112.03
|
-0.29
-0.26% |
$112.87
|
1,894,270
48.86% of 50 DAV
50 DAV is 3,876,800
|
$115.44
-2.95%
|
12/11/2012
|
$82.24
|
PP = $81.34
|
|
MB = $85.41
|
Most Recent Note - 3/19/2013 5:34:37 PM
G - Hovering near its all-time high after 3 consecutive small losses. Very extended from any sound base. Its 50 DMA line defines important support to watch.
>>> The latest Featured Stock Update with an annotated graph appeared on 2/28/2013. Click here.
View all notes |
Alert me of new notes |
CANSLIM.net Company Profile |
SEC |
Zacks Reports |
StockTalk |
News |
Chart |
Request a new note
C
A N
S L
I M


|
CFNL
-
NASDAQ
Cardinal Financial Corp
BANKING - Regional - Southeast Banks
|
$17.82
|
+0.08
0.45% |
$17.90
|
158,874
72.05% of 50 DAV
50 DAV is 220,500
|
$18.19
-2.03%
|
3/7/2013
|
$17.27
|
PP = $16.77
|
|
MB = $17.61
|
Most Recent Note - 3/15/2013 5:05:49 PM
G - Color code is changed to green while holding its ground stubbornly. Perched near its 52-week high since volume-driven gains last week cleared a "double bottom" base and triggered a technical buy signal. Prior highs in the high $16 area define initial support to watch on pullbacks.
>>> The latest Featured Stock Update with an annotated graph appeared on 3/18/2013. Click here.
View all notes |
Alert me of new notes |
CANSLIM.net Company Profile |
SEC |
Zacks Reports |
StockTalk |
News |
Chart |
Request a new note
C
A N
S L
I M
|
CMCSA
-
NASDAQ
Comcast Corp Cl A
MEDIA - CATV Systems
|
$40.40
|
-0.58
-1.42% |
$40.90
|
12,020,400
86.21% of 50 DAV
50 DAV is 13,943,900
|
$42.00
-3.81%
|
12/3/2012
|
$37.08
|
PP = $38.06
|
|
MB = $39.96
|
Most Recent Note - 3/19/2013 5:32:52 PM
G - Testing support at its 50 DMA line while enduring mild distributional pressure. Relative Strength Rating has slumped to 75, below the 80+ guideline. Fundamental concerns remain since it reported earnings +11% on +6% sales revenues for the Dec '12 quarter. See latest FSU analysis for more details and a new annotated graph.
>>> The latest Featured Stock Update with an annotated graph appeared on 3/19/2013. Click here.
View all notes |
Alert me of new notes |
CANSLIM.net Company Profile |
SEC |
Zacks Reports |
StockTalk |
News |
Chart |
Request a new note
C
A N
S L
I M
|
CVLT
-
NASDAQ
Commvault Systems Inc
COMPUTER SOFTWARE and SERVICES - Business Software and Services
|
$81.91
|
-0.83
-1.00% |
$82.61
|
390,997
51.20% of 50 DAV
50 DAV is 763,600
|
$86.89
-5.73%
|
3/14/2013
|
$84.71
|
PP = $79.63
|
|
MB = $83.61
|
 Most Recent Note - 3/21/2013 7:10:56 PM
Y - Volume totals have been cooling while consolidating following its technical breakout on 3/14/13 with a solid gain backed by 4.5 times average volume. Prior highs define initial support to watch above its 50 DMA line.
>>> The latest Featured Stock Update with an annotated graph appeared on 3/14/2013. Click here.
View all notes |
Alert me of new notes |
CANSLIM.net Company Profile |
SEC |
Zacks Reports |
StockTalk |
News |
Chart |
Request a new note
C
A N
S L
I M
|
EVER
-
NYSE
Everbank Financial Corp
BANKING
|
$15.55
|
+0.28
1.83% |
$15.73
|
843,069
96.07% of 50 DAV
50 DAV is 877,600
|
$17.29
-10.06%
|
3/4/2013
|
$15.38
|
PP = $15.83
|
|
MB = $16.62
|
Most Recent Note - 3/18/2013 3:29:36 PM
G - Small gap down today trading near its 50 DMA line and its color code is changed to green. Damaging losses last week violated prior highs in the $16 area noted as initial chart support to watch, raising concerns and completely negating its prior technical breakout.
>>> The latest Featured Stock Update with an annotated graph appeared on 3/4/2013. Click here.
View all notes |
Alert me of new notes |
CANSLIM.net Company Profile |
SEC |
Zacks Reports |
StockTalk |
News |
Chart |
Request a new note
C
A N
S L
I M
|
Symbol/Exchange
Company Name
Industry Group |
PRICE |
CHANGE
(%Change) |
Day High |
Volume
(% DAV)
(% 50 day avg vol) |
52 Wk Hi
% From Hi |
Featured
Date |
Price
Featured |
Pivot Featured |
|
Max Buy |
FLT
-
NYSE
Fleetcor Technologies
DIVERSIFIED SERVICES - Business/Management Services
|
$72.38
|
+2.64
3.79% |
$72.50
|
1,991,217
298.67% of 50 DAV
50 DAV is 666,700
|
$72.90
-0.71%
|
3/21/2013
|
$71.14
|
PP = $73.00
|
|
MB = $76.65
|
Most Recent Note - 3/21/2013 7:08:19 PM
Y - Finished strong with a considerable gain on 3 times average volume after highlighted in yellow with pivot point cited based on its 3/06/13 high plus 10 cents. A volume driven gain above the pivot point may trigger a new technical buy signal. Held its ground and formed an advanced "3-weeks tight" base. Completed another Secondary Offering on 3/08/13 after a streak of volume-driven gains into new high territory. Reported earnings +46% on +45% sales for the Dec '12 quarter, marking its 4th consecutive quarterly comparison with earnings above the +25% guideline (C criteria). On 3/14/12, 6/11/12, and 11/29/12 it priced Secondary Offerings. See the latest FSU analysis for more details and an annotated graph.
>>> The latest Featured Stock Update with an annotated graph appeared on 3/21/2013. Click here.
View all notes |
Alert me of new notes |
CANSLIM.net Company Profile |
SEC |
Zacks Reports |
StockTalk |
News |
Chart |
Request a new note
C
A N
S L
I M
|
JAZZ
-
NASDAQ
Jazz Pharmaceuticals Plc
DRUGS - Biotechnology
|
$56.80
|
-1.41
-2.42% |
$58.21
|
540,024
98.96% of 50 DAV
50 DAV is 545,700
|
$60.79
-6.56%
|
3/5/2013
|
$59.10
|
PP = $60.10
|
|
MB = $63.11
|
Most Recent Note - 3/18/2013 5:52:46 PM
Y - Still holding its ground perched near its 52-week high since completing a Secondary Offering on 3/05/13. Disciplined investors may watch for a volume-driven gain above the pivot point to trigger a technical buy signal before new buying efforts may be justified under the fact-based investment system.
>>> The latest Featured Stock Update with an annotated graph appeared on 3/7/2013. Click here.
View all notes |
Alert me of new notes |
CANSLIM.net Company Profile |
SEC |
Zacks Reports |
StockTalk |
News |
Chart |
Request a new note
C
A N
S L
I M
|
KORS
-
NYSE
Michael Kors Hldgs Ltd
RETAIL - Apparel Stores
|
$55.05
|
-1.33
-2.36% |
$56.18
|
3,729,160
61.63% of 50 DAV
50 DAV is 6,050,700
|
$65.10
-15.44%
|
1/23/2013
|
$54.98
|
PP = $58.72
|
|
MB = $61.66
|
Most Recent Note - 3/19/2013 5:35:59 PM
G - Color code is changed to green after slumping back below its 50 DMA line raising concerns. Completed another Secondary Offering 2/20/13 while perched near its all-time high.
>>> The latest Featured Stock Update with an annotated graph appeared on 3/8/2013. Click here.
View all notes |
Alert me of new notes |
CANSLIM.net Company Profile |
SEC |
Zacks Reports |
StockTalk |
News |
Chart |
Request a new note
C
A N
S L
I M
|
LNKD
-
NYSE
Linkedin Corp Class A
INTERNET - Internet Information Providers
|
$175.04
|
+0.38
0.22% |
$175.70
|
1,372,262
55.81% of 50 DAV
50 DAV is 2,458,800
|
$184.15
-4.95%
|
2/8/2013
|
$147.04
|
PP = $127.55
|
|
MB = $133.93
|
Most Recent Note - 3/21/2013 7:14:19 PM
G - Volume totals have been cooling while consolidating. Very extended from its prior base, meanwhile its 50 DMA line defines important near term support to watch on pullbacks.
>>> The latest Featured Stock Update with an annotated graph appeared on 3/11/2013. Click here.
View all notes |
Alert me of new notes |
CANSLIM.net Company Profile |
SEC |
Zacks Reports |
StockTalk |
News |
Chart |
Request a new note
C
A N
S L
I M
|
LOPE
-
NASDAQ
Grand Canyon Education
DIVERSIFIED SERVICES - Education and; Training Services
|
$24.76
|
+0.26
1.06% |
$25.06
|
319,517
68.95% of 50 DAV
50 DAV is 463,400
|
$27.18
-8.90%
|
2/20/2013
|
$26.44
|
PP = $25.10
|
|
MB = $26.36
|
Most Recent Note - 3/20/2013 5:20:00 PM
G - Rising from its 50 DMA line with light volume behind its recent gains. Volume totals have cooled in recent weeks after it quickly negated the prior technical breakout. It has not formed a sound new base.
>>> The latest Featured Stock Update with an annotated graph appeared on 3/13/2013. Click here.
View all notes |
Alert me of new notes |
CANSLIM.net Company Profile |
SEC |
Zacks Reports |
StockTalk |
News |
Chart |
Request a new note
C
A N
S L
I M
|
Symbol/Exchange
Company Name
Industry Group |
PRICE |
CHANGE
(%Change) |
Day High |
Volume
(% DAV)
(% 50 day avg vol) |
52 Wk Hi
% From Hi |
Featured
Date |
Price
Featured |
Pivot Featured |
|
Max Buy |
MIDD
-
NASDAQ
Middleby Corp
MANUFACTURING - Diversified Machinery
|
$151.92
|
+0.13
0.09% |
$152.50
|
105,671
112.90% of 50 DAV
50 DAV is 93,600
|
$154.74
-1.82%
|
10/8/2012
|
$118.46
|
PP = $122.67
|
|
MB = $128.80
|
Most Recent Note - 3/20/2013 5:21:19 PM
G - Tallied a gain today with above average volume for a best-ever close. Recently staying in tight trading range near all-time highs, stubbornly holding its ground. Fundamental concerns were recently noted. Its 50 DMA line defines important near-term chart support.
>>> The latest Featured Stock Update with an annotated graph appeared on 2/25/2013. Click here.
View all notes |
Alert me of new notes |
CANSLIM.net Company Profile |
SEC |
Zacks Reports |
StockTalk |
News |
Chart |
Request a new note
C
A N
S L
I M
|
MNTX
-
NASDAQ
Manitex International
MANUFACTURING - Diversified Machinery
|
$11.11
|
-0.59
-5.04% |
$11.79
|
168,331
105.08% of 50 DAV
50 DAV is 160,200
|
$11.95
-7.03%
|
3/20/2013
|
$11.29
|
PP = $12.05
|
|
MB = $12.65
|
Most Recent Note - 3/21/2013 6:54:39 PM
Y - Erased a large part of the prior session's considerable gain with a loss today on near average volume, retreating from the pivot point cited based on its 2/06/13 high plus 10 cents. Previously noted - "Subsequent volume-driven gains above the pivot point cited are needed to trigger a technical buy signal before action may be justified under the fact-based system. See the latest FSU analysis for more details and a new annotated graph."
>>> The latest Featured Stock Update with an annotated graph appeared on 3/20/2013. Click here.
View all notes |
Alert me of new notes |
CANSLIM.net Company Profile |
SEC |
Zacks Reports |
StockTalk |
News |
Chart |
Request a new note
C
A N
S L
I M
|
MRLN
-
NASDAQ
Marlin Business Services
DIVERSIFIED SERVICES - Rental and Leasing Services
|
$21.62
|
+0.37
1.74% |
$21.72
|
23,461
103.81% of 50 DAV
50 DAV is 22,600
|
$23.08
-6.33%
|
3/15/2013
|
$22.29
|
PP = $23.18
|
|
MB = $24.34
|
Most Recent Note - 3/18/2013 5:51:50 PM
Y - Held its ground today following Friday's "negative reversal" and worrisome loss on above average volume. It was highlighted in yellow with pivot point cited based on its 9/21/12 high plus 10 cents in the 3/15/13 mid-day report (read here) and noted - "Disciplined investors may watch for subsequent volume-driven gains above the pivot point to trigger a technical buy signal before action may be justified under the fact-based investment system. Found support near its 200 DMA line in recent months and now rallying within close striking distance of its 52-week high. Recent quarterly comparisons through Dec '12 show strong earnings increases satisfying the C criteria. Annual earnings (A criteria) growth has improved following the downturn in FY '08 and '09." See the latest FSU analysis for more details and a new annotated graph.
>>> The latest Featured Stock Update with an annotated graph appeared on 3/15/2013. Click here.
View all notes |
Alert me of new notes |
CANSLIM.net Company Profile |
SEC |
Zacks Reports |
StockTalk |
News |
Chart |
Request a new note
C
A N
S L
I M
|
MWIV
-
NASDAQ
M W I Veterinary Supply
HEALTH SERVICES - Medical Instruments and; Supplies
|
$131.22
|
-1.22
-0.92% |
$133.01
|
26,811
47.12% of 50 DAV
50 DAV is 56,900
|
$137.18
-4.34%
|
3/4/2013
|
$130.90
|
PP = $129.45
|
|
MB = $135.92
|
Most Recent Note - 3/18/2013 3:26:52 PM
Y - Tallying a gain today after dipping below its pivot point late last week. Disciplined investors limit loses by selling if ever any stock fall more than -7% from their purchase price.
>>> The latest Featured Stock Update with an annotated graph appeared on 3/6/2013. Click here.
View all notes |
Alert me of new notes |
CANSLIM.net Company Profile |
SEC |
Zacks Reports |
StockTalk |
News |
Chart |
Request a new note
C
A N
S L
I M
|
N
-
NYSE
Netsuite Inc
DIVERSIFIED SERVICES - Business/Management Services
|
$78.07
|
+1.67
2.19% |
$78.55
|
461,851
129.04% of 50 DAV
50 DAV is 357,900
|
$77.60
0.61%
|
12/12/2012
|
$64.75
|
PP = $67.12
|
|
MB = $70.48
|
Most Recent Note - 3/15/2013 5:08:15 PM
G - Rose with above average volume today for another new 52-week and all-time high. Its 50 DMA line acted as support during the recent consolidation.
>>> The latest Featured Stock Update with an annotated graph appeared on 3/1/2013. Click here.
View all notes |
Alert me of new notes |
CANSLIM.net Company Profile |
SEC |
Zacks Reports |
StockTalk |
News |
Chart |
Request a new note
C
A N
S L
I M
|
Symbol/Exchange
Company Name
Industry Group |
PRICE |
CHANGE
(%Change) |
Day High |
Volume
(% DAV)
(% 50 day avg vol) |
52 Wk Hi
% From Hi |
Featured
Date |
Price
Featured |
Pivot Featured |
|
Max Buy |
NSR
-
NYSE
Neustar Inc
TELECOMMUNICATIONS - Diversified Communication Serv
|
$45.08
|
-0.32
-0.70% |
$45.44
|
253,218
57.34% of 50 DAV
50 DAV is 441,600
|
$47.24
-4.57%
|
3/8/2013
|
$44.99
|
PP = $47.34
|
|
MB = $49.71
|
Most Recent Note - 3/15/2013 3:52:25 PM
Y - Erased the prior session's gain today, retreating near its 50 DMA line. Volume-driven gains above the pivot point may trigger a new (or add-on) technical buy signal. The 2/21/13 low ($42.40) defines important near-term support where any subsequent deterioration would raise greater concerns and trigger a worrisome technical sell signal.
>>> The latest Featured Stock Update with an annotated graph appeared on 2/27/2013. Click here.
View all notes |
Alert me of new notes |
CANSLIM.net Company Profile |
SEC |
Zacks Reports |
StockTalk |
News |
Chart |
Request a new note
C
A N
S L
I M
|
SLCA
-
NYSE
U S Silica Holdings Inc
CHEMICALS - Specialty Chemicals
|
$23.90
|
+0.03
0.13% |
$24.35
|
1,378,125
142.94% of 50 DAV
50 DAV is 964,100
|
$28.50
-16.14%
|
2/26/2013
|
$22.23
|
PP = $21.50
|
|
MB = $22.58
|
Most Recent Note - 3/20/2013 5:18:07 PM
G - Tallied another considerable volume-driven gain today, rebounding from damaging losses since completing a Secondary Offering on 3/14/13. Previously noted - "Very extended from its prior base, but having rallied more than +20% in the first 2-3 weeks after its breakout, the investment system rules suggest holding such winners for a minimum of 8 weeks."
>>> The latest Featured Stock Update with an annotated graph appeared on 2/26/2013. Click here.
View all notes |
Alert me of new notes |
CANSLIM.net Company Profile |
SEC |
Zacks Reports |
StockTalk |
News |
Chart |
Request a new note
C
A N
S L
I M
|
VRX
-
NYSE
Valeant Pharmaceuticals
DRUGS - Drug Manufacturers - Other
|
$72.86
|
-0.47
-0.64% |
$74.11
|
2,027,748
161.47% of 50 DAV
50 DAV is 1,255,800
|
$74.67
-2.42%
|
12/20/2012
|
$60.24
|
PP = $61.21
|
|
MB = $64.27
|
Most Recent Note - 3/20/2013 12:52:11 PM
G - Hitting yet another new high with today's 3rd consecutive gain, getting very extended from the secondary buy point noted earlier. The 50 DMA line and recent low ($64.05 on 2/21/13) define important support areas to watch on pullbacks.
>>> The latest Featured Stock Update with an annotated graph appeared on 3/12/2013. Click here.
View all notes |
Alert me of new notes |
CANSLIM.net Company Profile |
SEC |
Zacks Reports |
StockTalk |
News |
Chart |
Request a new note
C
A N
S L
I M
|
|
|
|
THESE ARE NOT BUY RECOMMENDATIONS!
Comments contained in the body of this report are technical
opinions only. The material herein has been obtained
from sources believed to be reliable and accurate, however,
its accuracy and completeness cannot be guaranteed.
This site is not an investment advisor, hence it does
not endorse or recommend any securities or other investments.
Any recommendation contained in this report may not
be suitable for all investors and it is not to be deemed
an offer or solicitation on our part with respect to
the purchase or sale of any securities. All trademarks,
service marks and trade names appearing in this report
are the property of their respective owners, and are
likewise used for identification purposes only.
This report is a service available
only to active Paid Premium Members.
You may opt-out of receiving report notifications
at any time. Questions or comments may be submitted
by writing to Premium Membership Services 665 S.E. 10 Street, Suite 201 Deerfield Beach, FL 33441-5634 or by calling 1-800-965-8307
or 954-785-1121.
|
|
|

